Races in De Witt, Iowa (IA) Detailed Stats
Ancestries, Foreign-born residents, place of birth

Discuss De Witt, Iowa races on our local forum with over 2,400,000 registered users
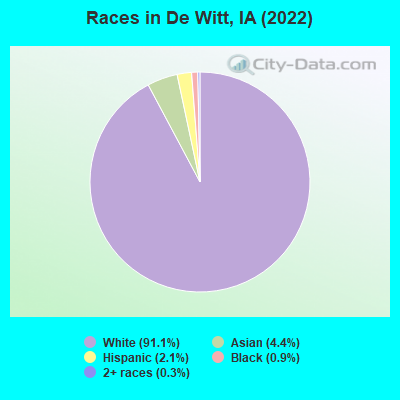
According to 2022 data, the most numerous races in De Witt, IA are White alone (5,036 residents), Hispanic (114 residents), and Black alone (50 residents). 94.6% of De Witt residents speak English at home. 4.6% of De Witt, IA residents are foreign-born (4.2% born in Asia), which is 8.8% less than the foreign-born rate of 5.0% across the entire state of Iowa.
Race distribution in De Witt
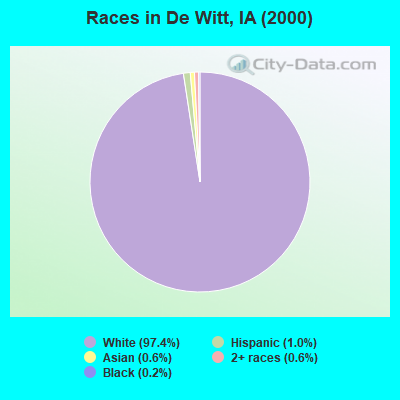
2000
2022

- 4,92097.4%White alone
- 491.0%Hispanic
- 280.6%Two or more races
- 300.6%Asian alone
- 100.2%Black alone
- 50.10%Other race alone
- 40.08%American Indian alone
- 30.06%Native Hawaiian and Other
Pacific Islander alone
-
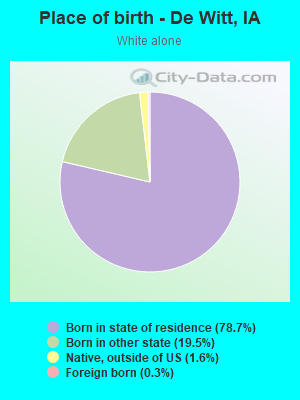
- 5,03691.1%White alone
- 2454.4%Asian alone
- 1142.1%Hispanic
- 500.9%Black alone
- 140.3%Two or more races
2000
2022
-
- 2,710,34492.6%White alone
- 82,4732.8%Hispanic
- 60,7442.1%Black alone
- 36,3451.2%Asian alone
- 25,4720.9%Two or more races
- 7,9550.3%American Indian alone
- 2,1030.07%Other race alone
- 8880.03%Native Hawaiian and Other
Pacific Islander alone

-
- 2,650,11082.8%White alone
- 218,0246.8%Hispanic
- 119,0043.7%Black alone
- 115,2863.6%Two or more races
- 74,8922.3%Asian alone
- 9,2600.3%Other race alone
- 8,5950.3%Native Hawaiian and Other
Pacific Islander alone - 5,3460.2%American Indian alone

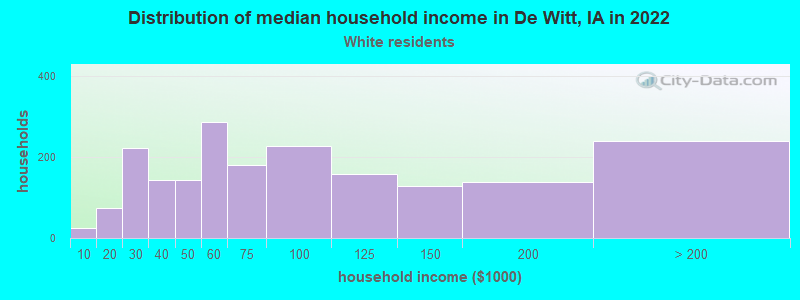
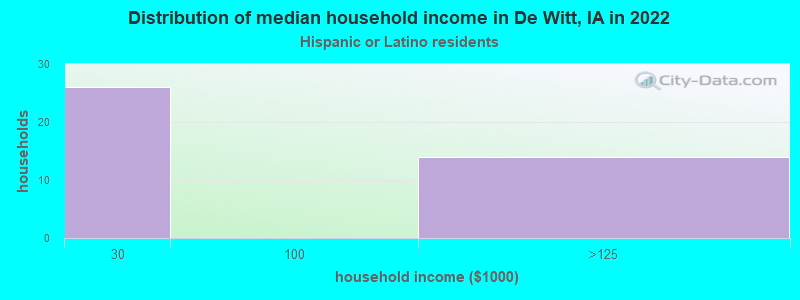
Income and house value in De Witt
- Median household income in 2022
- $67,916White non-Hispanic householders
- Median 2022 house value
- $208,271White Non-Hispanic householders
- $103,104Hispanic or Latino householders
Household income for White non-Hispanic householders
Household income for Hispanic or Latino race householders
Median age by race in De Witt
- 38.0Median age for White residents
- 38.9Males
- 36.9Females
- 48.7Median age for Black or African American residents
- -673,684,209.9Males
- -698,646,985.8Females
- -660,397,073.5Median age for American Indian / Alaska Native residents
- -654,282,765.1Males
- -670,912,950.5Females
- 36.3Median age for Asian residents
- -729,641,693.1Males
- 35.9Females
- -580,729,166.1Median age for Native Hawaiian / Pacific Islander residents
- -776,978,416.5Males
- -504,347,825.6Females
- -668,973,471.1Median age for Other race residents
- -678,486,997.0Males
- -664,399,092.3Females
- 30.0Median age for Two or more races residents
- 29.0Males
- -811,594,202.1Females
- 37.6Median age for White alone residents
- 38.6Males
- 36.5Females
- 50.8Median age for Hispanic or Latino residents
- 49.2Males
- -735,632,183.2Females
Owner/renter occupied households by race in De Witt
- House owners and renters - White residents
- 1,60181.1%Owner occupied
- 37318.9%Renter occupied
- House owners and renters - Black or African American residents
- 29100.0%Renter occupied
- House owners and renters - Asian residents
- 17100.0%Owner occupied
- House owners and renters - Other race residents
- 24100.0%Renter occupied
- House owners and renters - White alone residents
- 1,61182.2%Owner occupied
- 34917.8%Renter occupied
- House owners and renters - Hispanic or Latino residents
- 49100.0%Renter occupied
Language usage in De Witt
- English speakers - Total
- 94.6% of residents of De Witt speak English at home.
- 0.3% of residents speak Spanish at home
- 17100.0%Speak English very well
- 4.9% of residents speak other language at home
- 18672.9%Speak English very well
- 6927.1%Speak English less than very well
- English speakers - Born in the United States
- 99.4% of residents of De Witt speak English at home.
- 0.8% of residents speak other language at home
- 9100.0%Speak English very well
All residents speak only English at home
- English speakers - Foreign-born
- 5.6% of residents of De Witt speak English at home.
- 7.5% of residents speak Spanish at home
- 20100.0%Speak English very well
- 87.6% of residents speak other language at home
- 16671.2%Speak English very well
- 6728.8%Speak English less than very well
White (Caucasian) - Speak only English
| Native: | 99.9% (4,695) |
| Foreign-born: | 100.0% (11) |
White alone - Speak only English
| Native: | 99.3% (4,654) |
| Foreign-born: | 99.1% (15) |
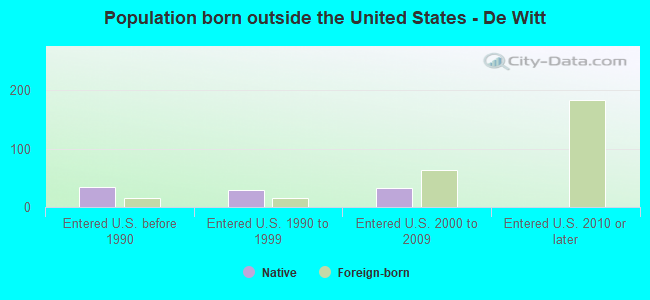
Foreign-born residents in De Witt
254 residents are foreign born (4.2% Asia).
| This city: | 4.6% |
| Iowa: | 5.6% |
Marital status for residents in De Witt
Marital status - White (Caucasian) population 15 years and over
- Males
- 21.1%Never married
- 59.8%Now married
- 1.2%Separated
- 5.1%Widowed
- 12.8%Divorced
- Females
- 24.6%Never married
- 50.5%Now married
- 0.0%Separated
- 8.9%Widowed
- 16.0%Divorced
Women who gave birth in the past 12 months
| Now married: | 70.5% (42) |
| Unmarried: | 29.5% (18) |
Women who did not give birth in the past 12 months
| Now married: | 47.2% (517) |
| Unmarried: | 52.8% (579) |
Marital status - Black or African American population 15 years and over
- Males
- 100.0%Never married
- 0.0%Now married
- 0.0%Separated
- 0.0%Widowed
- 0.0%Divorced
- Females
- 100.0%Never married
- 0.0%Now married
- 0.0%Separated
- 0.0%Widowed
- 0.0%Divorced
Women who did not give birth in the past 12 months
| Now married: | 0.0% (0) |
| Unmarried: | 100.0% (29) |
Marital status - Asian population 15 years and over
- Males
- 0.0%Never married
- 100.0%Now married
- 0.0%Separated
- 0.0%Widowed
- 0.0%Divorced
- Females
- 15.8%Never married
- 84.2%Now married
- 0.0%Separated
- 0.0%Widowed
- 0.0%Divorced
Women who did not give birth in the past 12 months
| Now married: | 77.9% (126) |
| Unmarried: | 22.1% (36) |
Marital status - White alone, not Hispanic / Latino population 15 years and over
- Males
- 20.6%Never married
- 61.7%Now married
- 1.2%Separated
- 3.3%Widowed
- 13.2%Divorced
- Females
- 24.6%Never married
- 50.5%Now married
- 0.0%Separated
- 8.9%Widowed
- 16.0%Divorced
Women who gave birth in the past 12 months
| Now married: | 70.5% (43) |
| Unmarried: | 29.5% (18) |
Women who did not give birth in the past 12 months
| Now married: | 47.2% (526) |
| Unmarried: | 52.8% (589) |
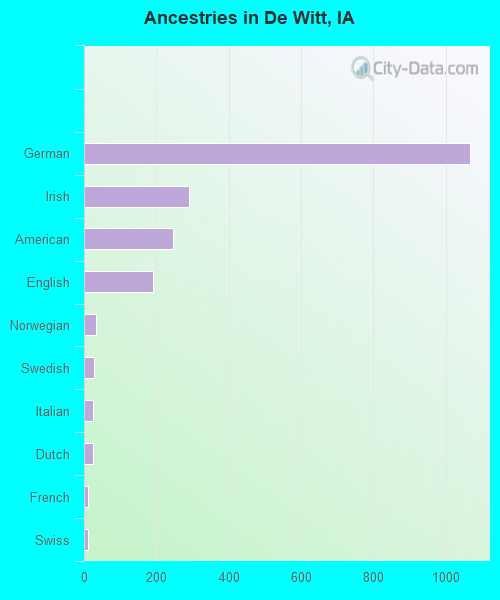
Ancestries in De Witt

- 1,06647.8%German
- 28913.0%Irish
- 24511.0%American
- 1918.6%English
- 341.5%Norwegian
- 291.3%Swedish
- 251.1%Italian
- 241.1%Dutch
- 110.5%French
- 100.4%Swiss
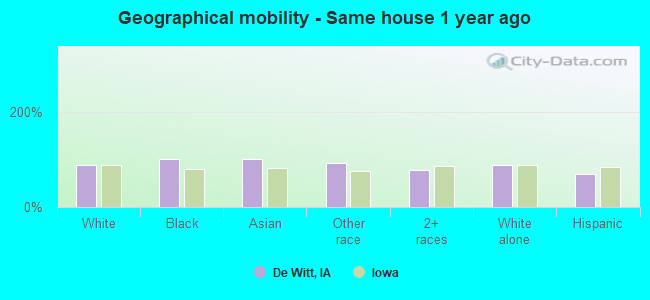
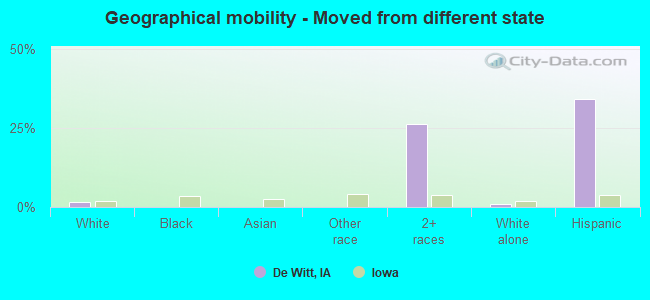
Geographical mobility in De Witt

- Same house 1 year ago
- 4,32087.7%White (Caucasian)
- 53100.0%Black or African American
- 248100.0%Asian
- 2293.4%Other race
- 5576.6%Two or more races
- 4,36388.1%White alone, not Hispanic / Latino
- 8069.2%Hispanic or Latino
-
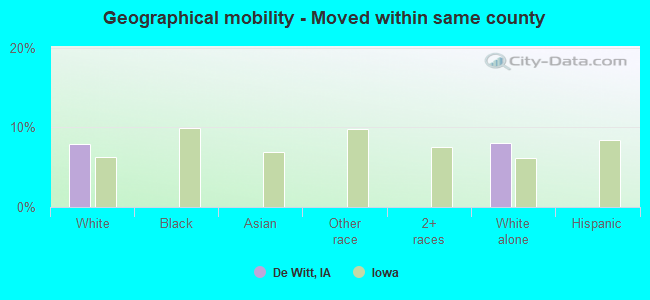
- Moved within same county
- 3907.9%White / Caucasian
- 3988.0%White alone, not Hispanic / Latino
-
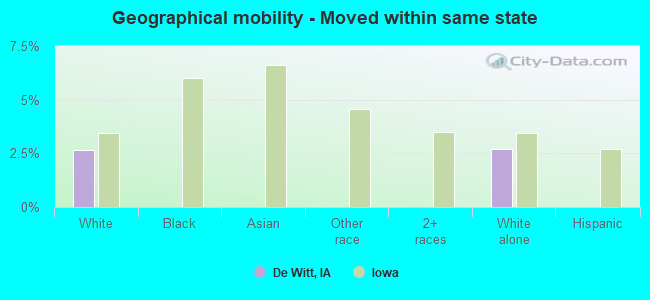
- Moved within same state
- 1322.7%White / Caucasian
- 1342.7%White alone, not Hispanic / Latino
-
- Moved from different state
- 831.7%White / Caucasian
- 1926.3%Two or more races
- 531.1%White alone, not Hispanic / Latino
- 3934.1%Hispanic or Latino
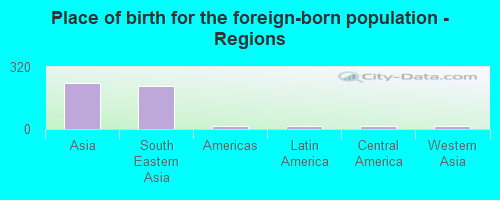
Children Nativity (place of birth) in De Witt
Place of birth for residents in De Witt
![Place of birth for the foreign-born population - Regions]()
- 237Asia
- 222South Eastern Asia
- 17Americas
- 17Latin America
- 17Central America
- 15Western Asia
Grandparents responsible for own grandchildren in De Witt
Zip codes: 52742.