Races in District 2, Oldtown, Maryland (MD) Detailed Stats
Ancestries, Foreign-born residents, place of birth
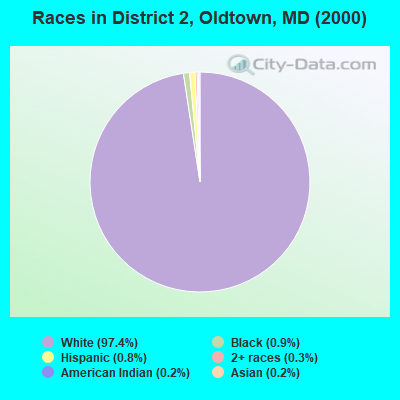
Race distribution in District 2, Oldtown

- 1,18397.4%White alone
- 110.9%Black alone
- 100.8%Hispanic
- 40.3%Two or more races
- 20.2%Asian alone
- 30.2%American Indian alone
- 10.08%Other race alone
2000
2022
-
- 3,286,54762.1%White alone
- 1,464,73527.7%Black alone
- 227,9164.3%Hispanic
- 209,7384.0%Asian alone
- 82,9461.6%Two or more races
- 13,3120.3%American Indian alone
- 9,3790.2%Other race alone
- 1,9130.04%Native Hawaiian and Other
Pacific Islander alone

-
- 2,906,49247.1%White alone
- 1,800,91429.2%Black alone
- 705,84211.4%Hispanic
- 401,8186.5%Asian alone
- 291,3174.7%Two or more races
- 46,9300.8%Other race alone
- 8,9300.1%American Indian alone
- 2,4170.04%Native Hawaiian and Other
Pacific Islander alone

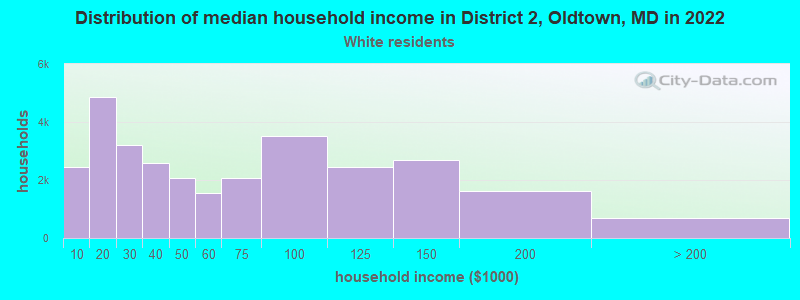
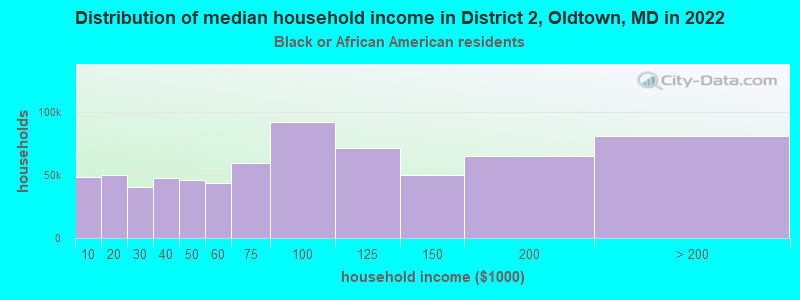
Income and house value in District 2, Oldtown
- Median household income in 2022
- $58,778White non-Hispanic householders
- $184,107Black householders
- Median 2022 house value
- $149,161White Non-Hispanic householders
- $151,176Black or African American householders
Household income for White non-Hispanic householders
Household income for Black householders
Zip code: 21555