Races in East Compton, California (CA) Detailed Stats
Ancestries, Foreign-born residents, place of birth

Recent posts about races in East Compton, California on our local forum with over 2,400,000 registered users:
 | Nonwhite youth population growing in California and nation, report finds (30 replies) |
40.8% of East Compton, CA residents are foreign-born (40.1% born in Latin America), which is 36.2% greater than the foreign-born rate of 26.0% across the entire state of California.
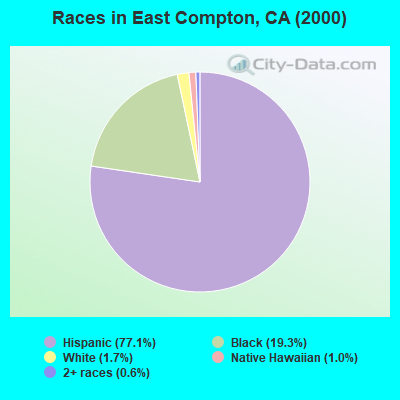
Race distribution in East Compton

- 7,16477.1%Hispanic
- 1,79119.3%Black alone
- 1611.7%White alone
- 961.0%Native Hawaiian and Other
Pacific Islander alone - 530.6%Two or more races
- 90.10%Other race alone
- 70.08%Asian alone
- 50.05%American Indian alone
2000
2022
-
- 15,816,79046.7%White alone
- 10,966,55632.4%Hispanic
- 3,648,86010.8%Asian alone
- 2,181,9266.4%Black alone
- 903,1152.7%Two or more races
- 178,9840.5%American Indian alone
- 103,7360.3%Native Hawaiian and Other
Pacific Islander alone - 71,6810.2%Other race alone

-
- 15,732,18440.3%Hispanic
- 13,160,42633.7%White alone
- 5,957,86715.3%Asian alone
- 2,025,2185.2%Black alone
- 1,663,2224.3%Two or more races
- 251,6180.6%Other race alone
- 135,7770.3%Native Hawaiian and Other
Pacific Islander alone - 103,0300.3%American Indian alone

Income and house value in East Compton
- Median household income in 2022
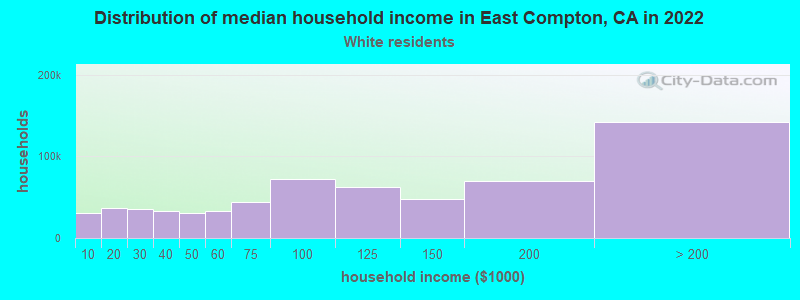
- $33,929White non-Hispanic householders
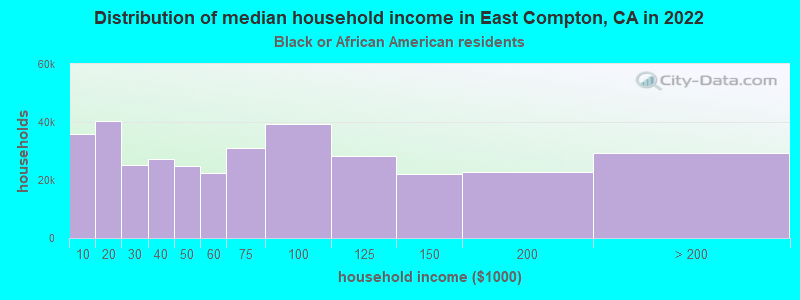
- $64,524Black householders
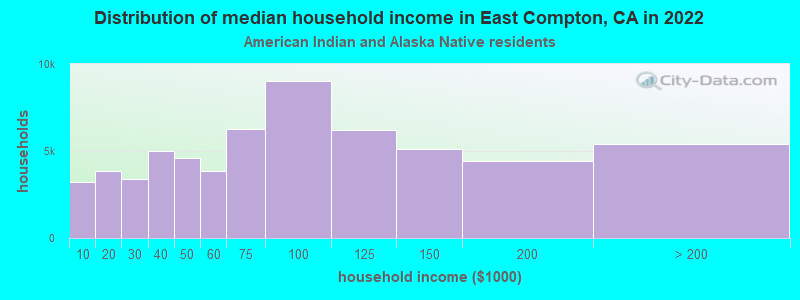
- $103,996American Indian and Alaska Native householders
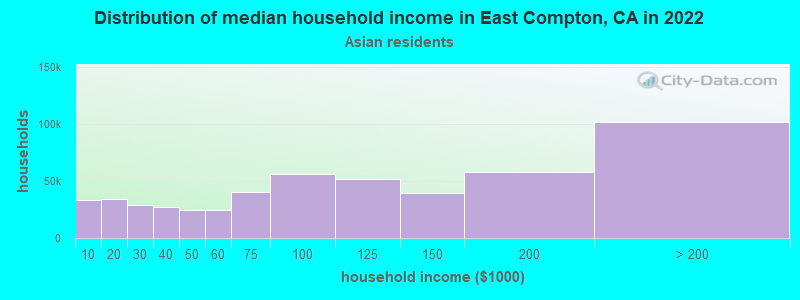
- $100,028Asian householders
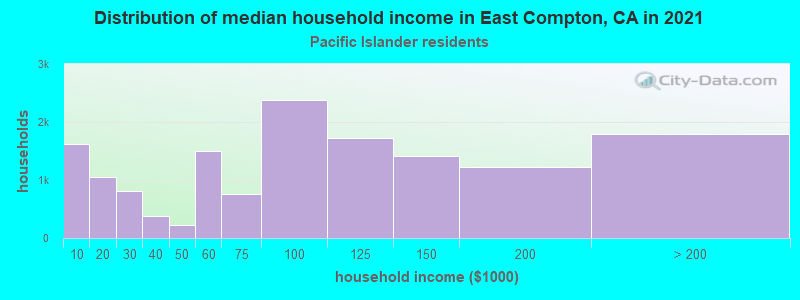
- $168,945Native Hawaiian and other Pacific Islander householders
- $63,113Some other race householders
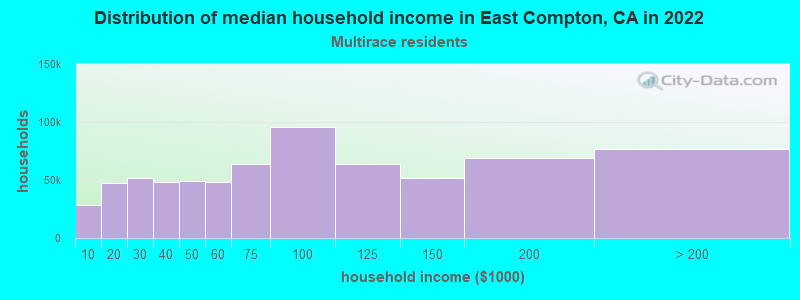
- $90,488Two or more races householders
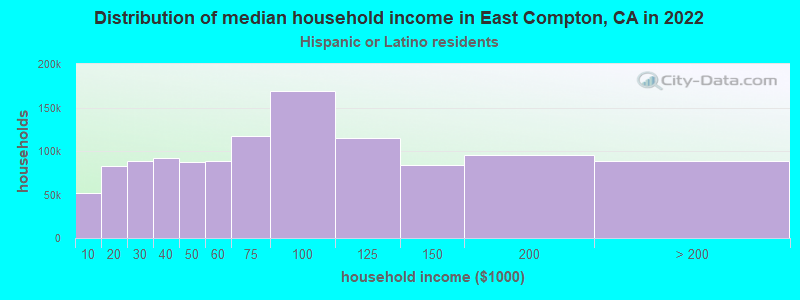
- $60,707Hispanic or Latino race householders
- Median 2022 house value
- $382,605White Non-Hispanic householders
- $490,584Black or African American householders
- $584,885Asian householders
- $674,868Native Hawaiian and other Pacific Islander householders
- $469,348Some other race householders
- $499,582Two or more races householders
- $478,346Hispanic or Latino householders
Household income for White non-Hispanic householders
Household income for Black householders
Household income for American Indian and Alaska Native householders
Household income for Asian householders
Household income for Native Hawaiian and other Pacific Islander householders
Household income for Two or more races householders
Household income for Hispanic or Latino race householders
Foreign-born residents in East Compton
3,787 residents are foreign born (40.1% Latin America).
| This city: | 40.8% |
| California: | 26.2% |
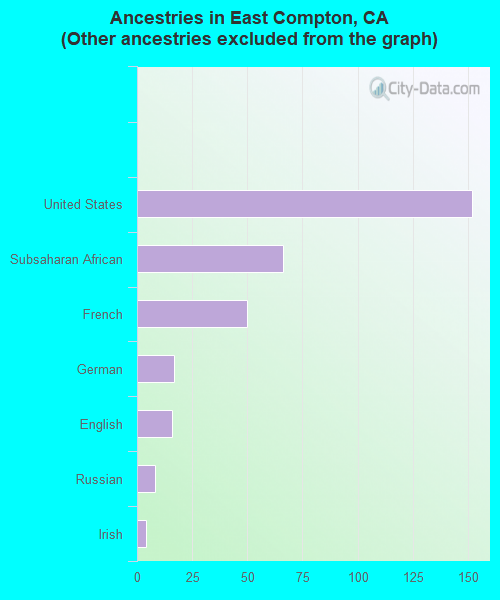
Ancestries in East Compton

- 7,88896.2%Other
- 1521.9%United States
- 660.8%Subsaharan African
- 500.6%French
- 170.2%German
- 160.2%English
- 80.10%Russian
- 40.05%Irish
Zip codes: 90221.