Races in Eden, North Carolina (NC) Detailed Stats
Ancestries, Foreign-born residents, place of birth
Settings
X


Recent posts about races in Eden, North Carolina on our local forum with over 2,400,000 registered users:
 | Any Asian food courts, shopping centers, neighborhoods, communities here? (5 replies) |
| Eden to get $450 million Purina Plant; 300 jobs (4 replies) |
| The Official Triad Random Thoughts Thread (39 replies) |
| looking at Eden NC need info on crime stats (14 replies) |
| The Official Triangle Random Thoughts Thread (5806 replies) |
| Need a professional to remove a huge poison ivy vine (32 replies) |
Latest news about races in Eden, NC collected exclusively by city-data.com from local newspapers, TV, and radio stations
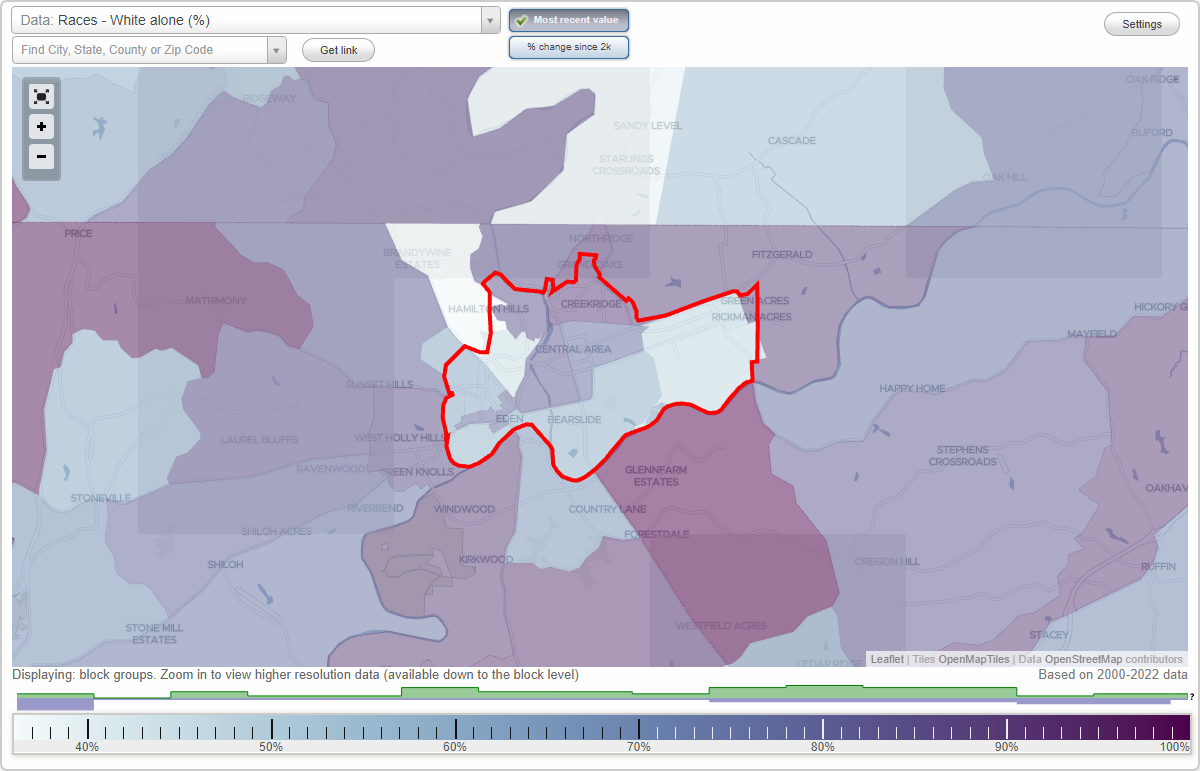
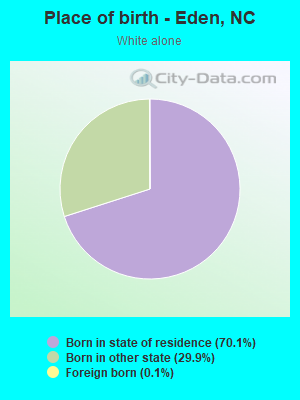
According to 2022 data, the most numerous races in Eden, NC are White alone (9,197 residents), Black alone (4,359 residents), and Hispanic (988 residents). 94.5% of Eden residents speak English at home. 3.3% of Eden, NC residents are foreign-born (1.4% born in Latin America, 1.4% born in Asia), which is 141.8% less than the foreign-born rate of 8.0% across the entire state of North Carolina.
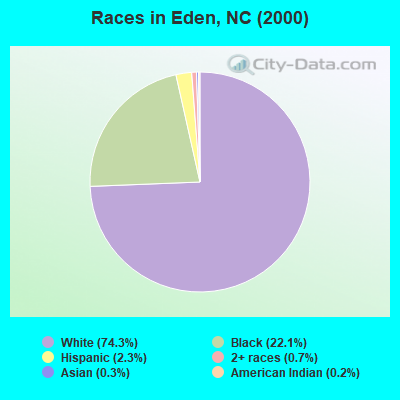
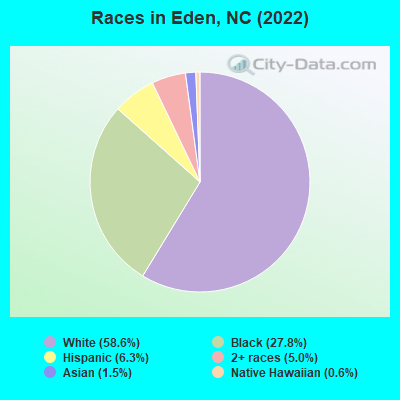
Race distribution in Eden
2000
2022

- 11,81974.3%White alone
- 3,51122.1%Black alone
- 3722.3%Hispanic
- 1100.7%Two or more races
- 480.3%Asian alone
- 290.2%American Indian alone
- 130.08%Other race alone
- 60.04%Native Hawaiian and Other
Pacific Islander alone
-
- 9,19758.6%White alone
- 4,35927.8%Black alone
- 9886.3%Hispanic
- 7915.0%Two or more races
- 2311.5%Asian alone
- 940.6%Native Hawaiian and Other
Pacific Islander alone - 110.07%American Indian alone
2000
2022
-
- 5,647,15570.2%White alone
- 1,723,30121.4%Black alone
- 378,9634.7%Hispanic
- 112,4161.4%Asian alone
- 95,3331.2%American Indian alone
- 79,9651.0%Two or more races
- 9,0150.1%Other race alone
- 3,1650.04%Native Hawaiian and Other
Pacific Islander alone

-
- 6,497,51960.7%White alone
- 2,155,65020.1%Black alone
- 1,114,79910.4%Hispanic
- 438,0614.1%Two or more races
- 341,0523.2%Asian alone
- 91,7580.9%American Indian alone
- 50,1800.5%Other race alone
- 9,9540.09%Native Hawaiian and Other
Pacific Islander alone

Income and house value in Eden
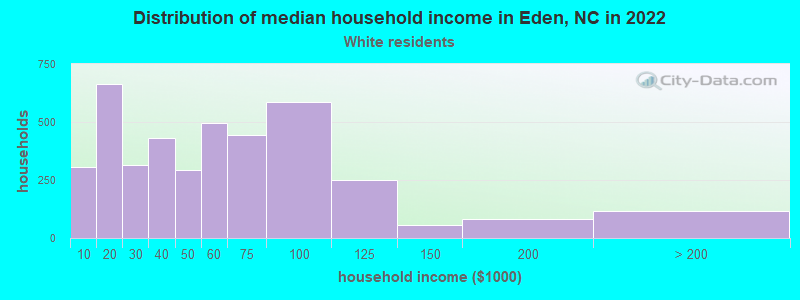
- Median household income in 2022
- $44,642White non-Hispanic householders
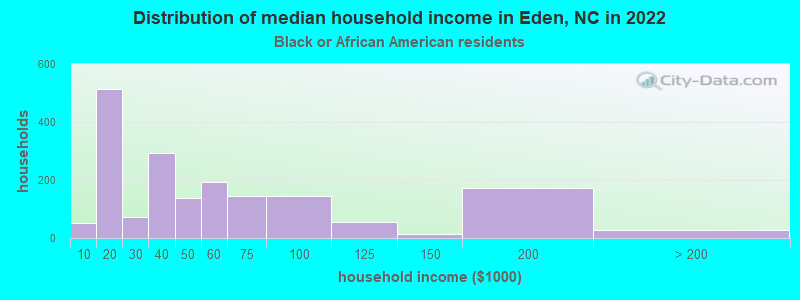
- $43,264Black householders
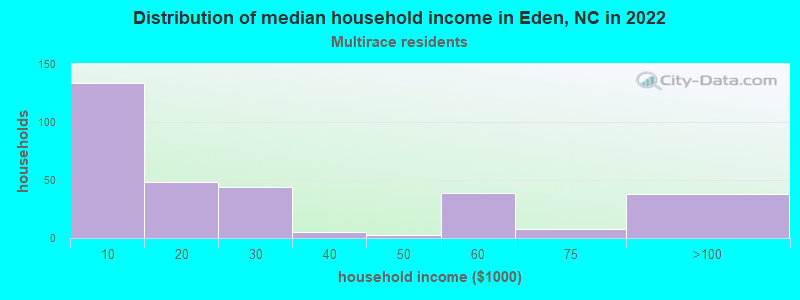
- $15,744Two or more races householders
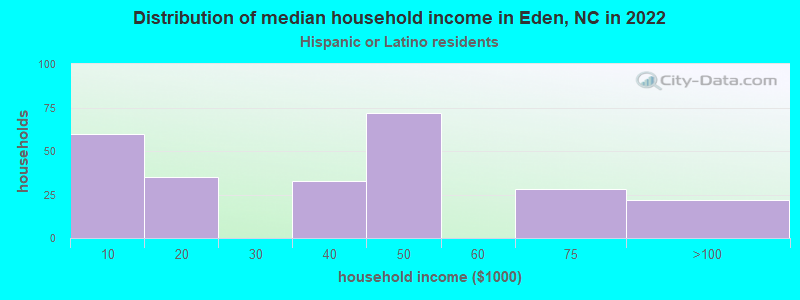
- $58,036Hispanic or Latino race householders
- Median 2022 house value
- $117,049White Non-Hispanic householders
- $92,945Black or African American householders
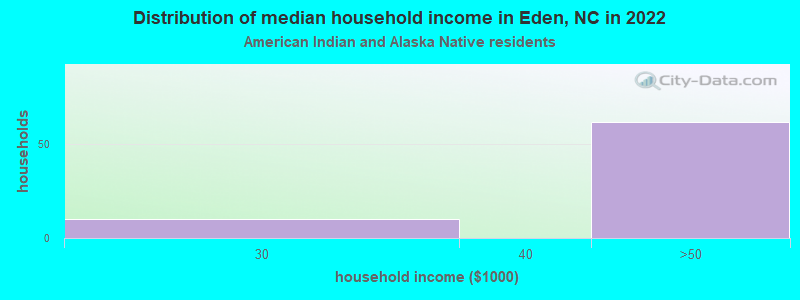
- $30,346American Indian or Alaska Native householders
- $216,758Asian householders
- $123,638Some other race householders
- $29,132Two or more races householders
- $114,448Hispanic or Latino householders
Household income for White non-Hispanic householders
Household income for Black householders
Household income for American Indian and Alaska Native householders
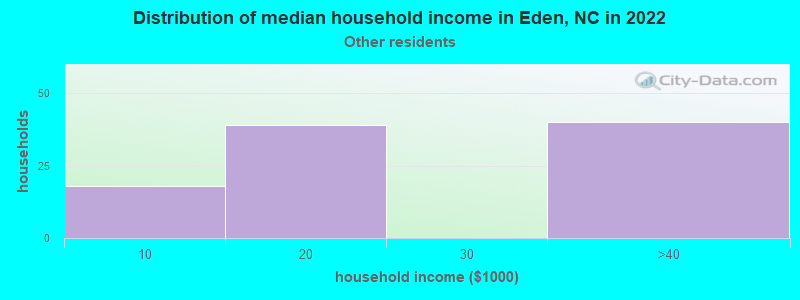
Household income for Some other race householders
Household income for Two or more races householders
Household income for Hispanic or Latino race householders
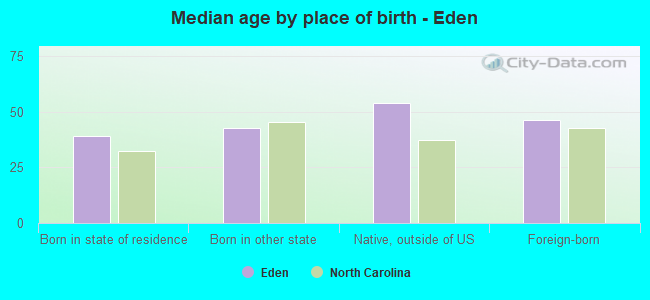
Median age by race in Eden
- 45.5Median age for White residents
- 44.9Males
- 44.0Females
- 37.1Median age for Black or African American residents
- 47.5Males
- 32.5Females
- 48.9Median age for American Indian / Alaska Native residents
- -852,216,747.9Males
- 35.5Females
- 60.7Median age for Asian residents
- -682,080,924.2Males
- 61.4Females
- 10.5Median age for Native Hawaiian / Pacific Islander residents
- -666,666,666.0Males
- -612,403,100.2Females
- 60.6Median age for Other race residents
- 33.8Males
- -1,136,666,665.5Females
- 15.3Median age for Two or more races residents
- 9.7Males
- 14.0Females
- 45.9Median age for White alone residents
- 45.2Males
- 44.2Females
- 16.2Median age for Hispanic or Latino residents
- 12.2Males
- 48.3Females
Owner/renter occupied households by race in Eden
- House owners and renters - White residents
- 2,59565.1%Owner occupied
- 1,38834.9%Renter occupied
- House owners and renters - Black or African American residents
- 54230.4%Owner occupied
- 1,24069.6%Renter occupied
- House owners and renters - American Indian / Alaska Native residents
- 1214.9%Owner occupied
- 6885.1%Renter occupied
- House owners and renters - Other race residents
- 4139.1%Owner occupied
- 6360.9%Renter occupied
- House owners and renters - Two or more races residents
- 13433.6%Owner occupied
- 26666.4%Renter occupied
- House owners and renters - White alone residents
- 2,60465.6%Owner occupied
- 1,36834.4%Renter occupied
- House owners and renters - Hispanic or Latino residents
- 5923.3%Owner occupied
- 19676.7%Renter occupied
Language usage in Eden
- English speakers - Total
- 94.5% of residents of Eden speak English at home.
- 4.2% of residents speak Spanish at home
- 42468.4%Speak English very well
- 19631.6%Speak English less than very well
- 0.9% of residents speak other language at home
- 13999.3%Speak English very well
- 10.7%Speak English less than very well
- English speakers - Born in the United States
- 94.9% of residents of Eden speak English at home.
- 4.8% of residents speak Spanish at home
- 183100.0%Speak English very well
- English speakers - Native, born elsewhere
- 29.7% of residents of Eden speak English at home.
- 82.8% of residents speak Spanish at home
- 53100.0%Speak English less than very well
- English speakers - Foreign-born
- 30.7% of residents of Eden speak English at home.
- 41.6% of residents speak Spanish at home
- 6430.0%Speak English very well
- 14970.0%Speak English less than very well
- 27.3% of residents speak other language at home
- 13999.3%Speak English very well
- 10.7%Speak English less than very well
White (Caucasian) - Speak only English
| Native: | 99.2% (8,803) |
| Foreign-born: | 36.5% (9) |
White (Caucasian) - Speak another language
| Native: | 1.2% (109) |
| Foreign-born: | 62.0% (16) |
Black or African American - Speak another language
| Native: | 0.9% (36) |
| Foreign-born: | 99.2% (20) |
Two or more races - Speak another language
| Native: | 8.5% (80) |
| Foreign-born: | 100.0% (154) |
White alone - Speak only English
| Native: | 99.2% (8,826) |
| Foreign-born: | 60.1% (10) |
White alone - Speak another language
| Native: | 0.8% (68) |
| Foreign-born: | 40.0% (6) |
Hispanic or Latino - Speak only English
| Native: | 51.8% (311) |
| Foreign-born: | 2.0% (5) |
Hispanic or Latino - Speak another language
| Native: | 48.5% (292) |
| Foreign-born: | 97.8% (242) |
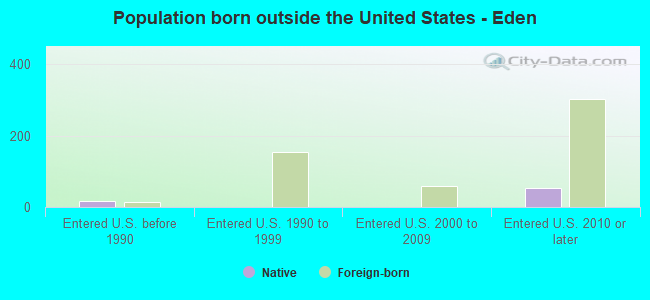
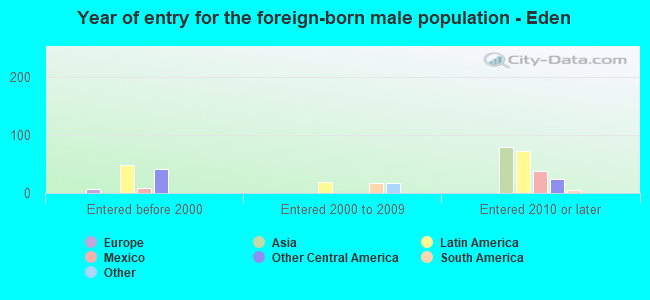
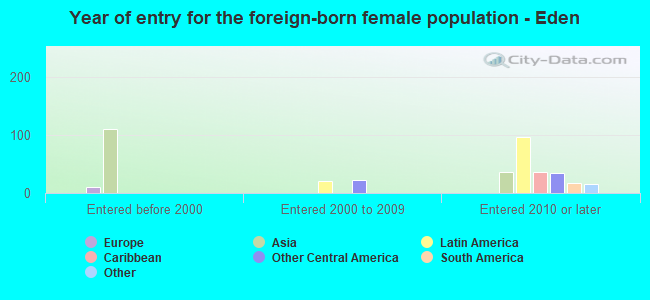
Foreign-born residents in Eden
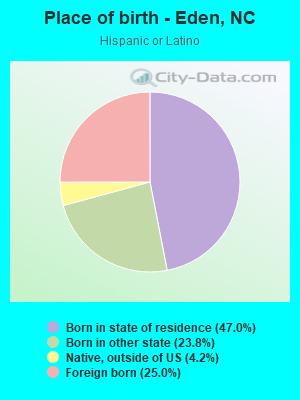
512 residents are foreign born (1.4% Latin America, 1.4% Asia).
| This city: | 3.3% |
| North Carolina: | 8.3% |
Marital status for residents in Eden
Marital status - White (Caucasian) population 15 years and over
- Males
- 31.9%Never married
- 51.8%Now married
- 2.5%Separated
- 2.6%Widowed
- 11.2%Divorced
- Females
- 17.9%Never married
- 50.9%Now married
- 1.9%Separated
- 14.2%Widowed
- 15.1%Divorced
Women who gave birth in the past 12 months
| Now married: | 100.0% (35) |
| Unmarried: | 0.0% (0) |
Women who did not give birth in the past 12 months
| Now married: | 58.1% (1,151) |
| Unmarried: | 41.9% (829) |
Marital status - Black or African American population 15 years and over
- Males
- 55.2%Never married
- 29.3%Now married
- 0.9%Separated
- 3.4%Widowed
- 11.2%Divorced
- Females
- 57.1%Never married
- 22.9%Now married
- 3.3%Separated
- 11.2%Widowed
- 5.5%Divorced
Women who gave birth in the past 12 months
| Now married: | 12.5% (12) |
| Unmarried: | 87.5% (84) |
Women who did not give birth in the past 12 months
| Now married: | 22.0% (223) |
| Unmarried: | 78.0% (789) |
Marital status - American Indian / Alaska Native population 15 years and over
- Males
- 0.0%Never married
- 100.0%Now married
- 0.0%Separated
- 0.0%Widowed
- 0.0%Divorced
- Females
- 0.0%Never married
- 81.7%Now married
- 0.0%Separated
- 0.0%Widowed
- 18.3%Divorced
Women who did not give birth in the past 12 months
| Now married: | 81.7% (52) |
| Unmarried: | 18.3% (12) |
Marital status - Asian population 15 years and over
- Males
- 0.0%Never married
- 100.0%Now married
- 0.0%Separated
- 0.0%Widowed
- 0.0%Divorced
- Females
- 0.0%Never married
- 100.0%Now married
- 0.0%Separated
- 0.0%Widowed
- 0.0%Divorced
Women who did not give birth in the past 12 months
| Now married: | 100.0% (18) |
| Unmarried: | 0.0% (0) |
Marital status - Other race population 15 years and over
- Males
- 53.5%Never married
- 46.5%Now married
- 0.0%Separated
- 0.0%Widowed
- 0.0%Divorced
- Females
- 0.0%Never married
- 100.0%Now married
- 0.0%Separated
- 0.0%Widowed
- 0.0%Divorced
Women who did not give birth in the past 12 months
| Now married: | 100.0% (30) |
| Unmarried: | 0.0% (0) |
Marital status - Two or more races population 15 years and over
- Males
- 66.5%Never married
- 19.0%Now married
- 10.1%Separated
- 4.5%Widowed
- 0.0%Divorced
- Females
- 36.9%Never married
- 38.9%Now married
- 10.2%Separated
- 3.3%Widowed
- 10.7%Divorced
Women who gave birth in the past 12 months
| Now married: | 100.0% (16) |
| Unmarried: | 0.0% (0) |
Women who did not give birth in the past 12 months
| Now married: | 50.8% (92) |
| Unmarried: | 49.2% (89) |
Marital status - White alone, not Hispanic / Latino population 15 years and over
- Males
- 31.8%Never married
- 51.7%Now married
- 2.5%Separated
- 2.6%Widowed
- 11.3%Divorced
- Females
- 18.1%Never married
- 50.8%Now married
- 2.0%Separated
- 14.4%Widowed
- 14.7%Divorced
Women who gave birth in the past 12 months
| Now married: | 100.0% (35) |
| Unmarried: | 0.0% (0) |
Women who did not give birth in the past 12 months
| Now married: | 58.1% (1,118) |
| Unmarried: | 41.9% (806) |
Marital status - Hispanic or Latino population 15 years and over
- Males
- 48.7%Never married
- 51.3%Now married
- 0.0%Separated
- 0.0%Widowed
- 0.0%Divorced
- Females
- 12.2%Never married
- 65.3%Now married
- 10.2%Separated
- 2.4%Widowed
- 9.8%Divorced
Women who gave birth in the past 12 months
| Now married: | 100.0% (13) |
| Unmarried: | 0.0% (0) |
Women who did not give birth in the past 12 months
| Now married: | 76.2% (187) |
| Unmarried: | 23.8% (58) |
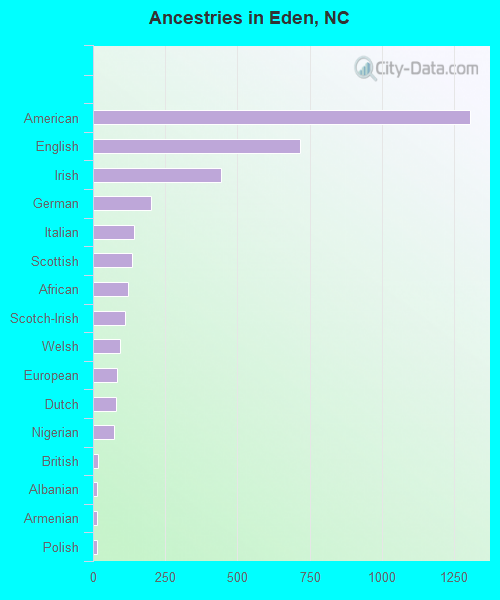
Ancestries in Eden

- 1,30615.2%American
- 7178.3%English
- 4445.2%Irish
- 2022.3%German
- 1421.6%Italian
- 1351.6%Scottish
- 1221.4%African
- 1101.3%Scotch-Irish
- 921.1%Welsh
- 841.0%European
- 800.9%Dutch
- 730.8%Nigerian
- 170.2%British
- 140.2%Albanian
- 140.2%Armenian
- 140.2%Polish
- 90.1%Hungarian
- 70.08%Canadian
- 70.08%French
- 60.07%French Canadian
- 60.07%Norwegian
- 60.07%Swedish
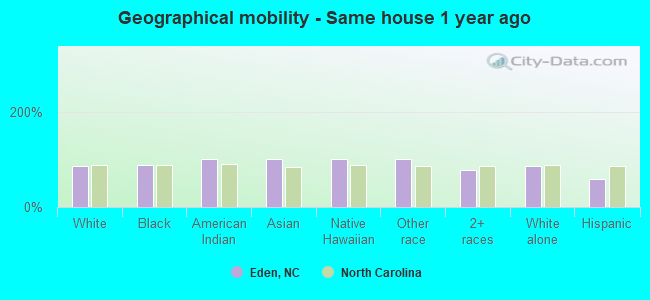
Geographical mobility in Eden

- Same house 1 year ago
- 7,89786.0%White (Caucasian)
- 3,45186.7%Black or African American
- 242100.0%American Indian / Alaska Native
- 237100.0%Asian
- 95100.0%Native Hawaiian / Pacific Islander
- 231100.0%Other race
- 93676.9%Two or more races
- 7,80786.4%White alone, not Hispanic / Latino
- 57459.3%Hispanic or Latino
-
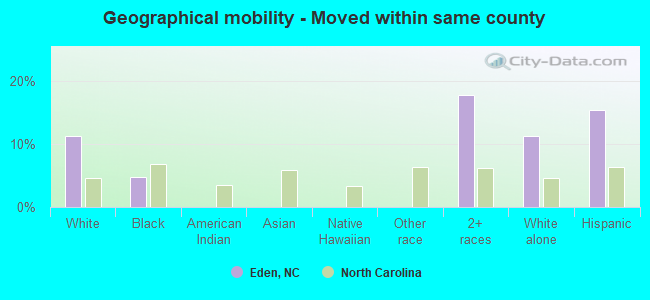
- Moved within same county
- 1,02611.2%White / Caucasian
- 1904.8%Black or African American
- 21617.8%Two or more races
- 1,00911.2%White alone, not Hispanic / Latino
- 14915.4%Hispanic or Latino
-
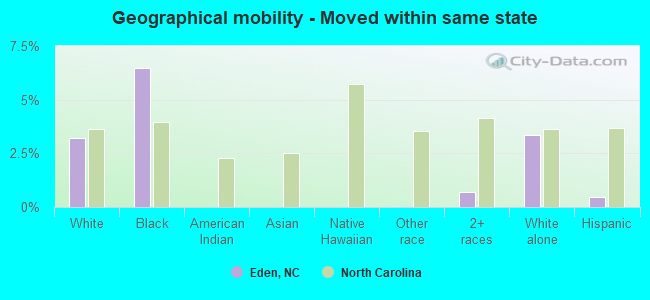
- Moved within same state
- 2953.2%White / Caucasian
- 2586.5%Black or African American
- 80.7%Two or more races
- 3043.4%White alone, not Hispanic / Latino
- 50.5%Hispanic or Latino
-
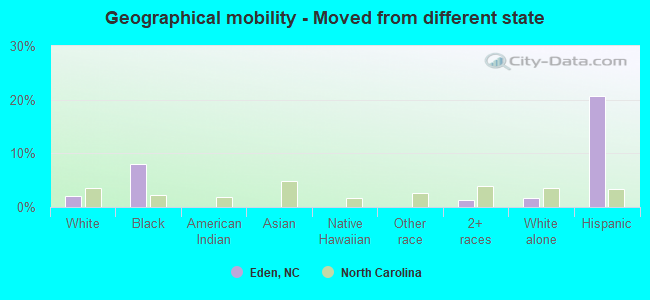
- Moved from different state
- 1832.0%White / Caucasian
- 3188.0%Black or African American
- 161.3%Two or more races
- 1521.7%White alone, not Hispanic / Latino
- 19920.6%Hispanic or Latino
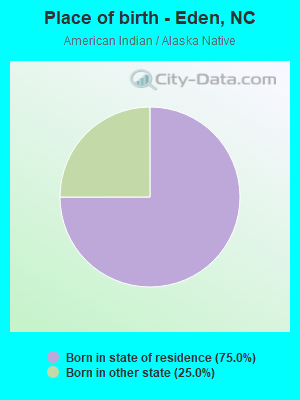
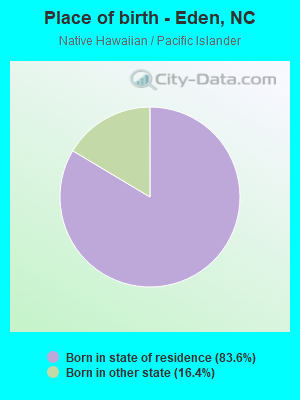
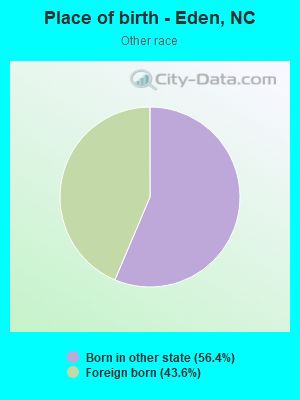
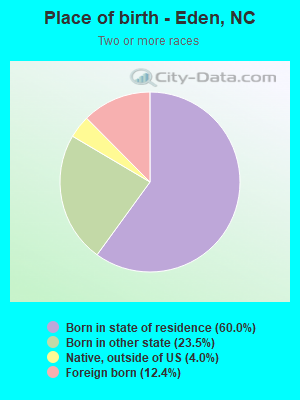
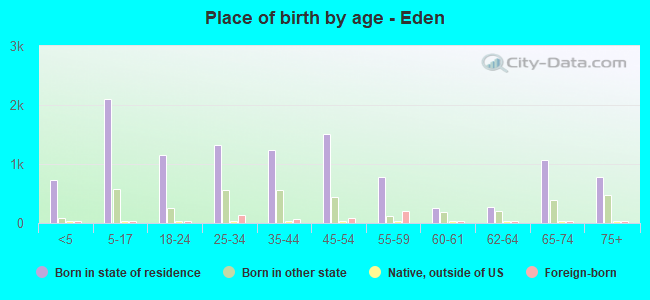
Children Nativity (place of birth) in Eden
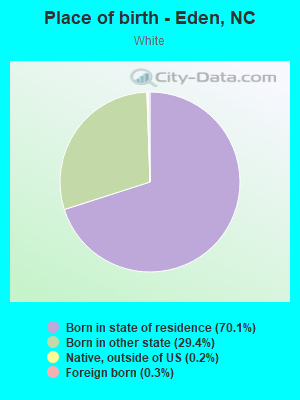
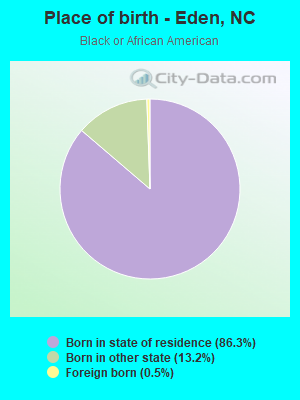
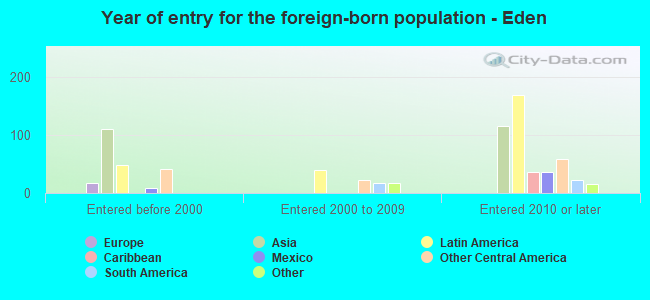
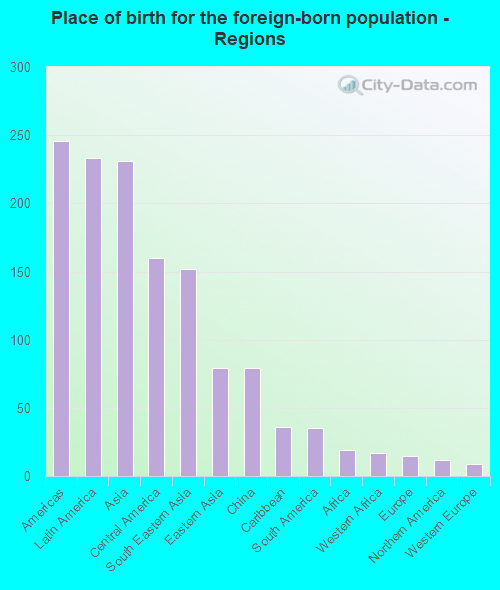
Place of birth for residents in Eden
![Place of birth for the foreign-born population - Regions]()
- 246Americas
- 233Latin America
- 231Asia
- 160Central America
- 152South Eastern Asia
- 79Eastern Asia
- 79China
- 36Caribbean
- 35South America
- 19Africa
- 17Western Africa
- 15Europe
- 12Northern America
- 9Western Europe
- 1Eastern Africa
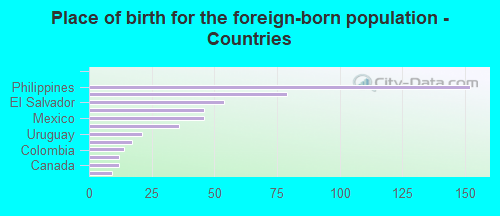
![Place of birth for the foreign-born population - Countries]()
- 152Philippines
- 79Hong Kong
- 54El Salvador
- 46Honduras
- 46Mexico
- 36Dominican Republic
- 21Uruguay
- 17Nigeria
- 14Colombia
- 12Guatemala
- 12Canada
- 9Germany
- 1Tanzania
Grandparents responsible for own grandchildren in Eden
Zip codes: 27288.