Races in Edmeston, New York (NY) Detailed Stats
Ancestries, Foreign-born residents, place of birth
Data:
1.6% of Edmeston, NY residents are foreign-born , which is 1237.6% less than the foreign-born rate of 22.0% across the entire state of New York.
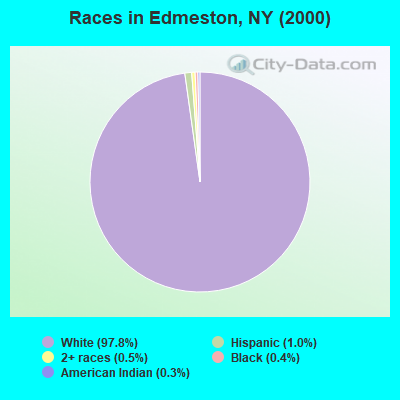
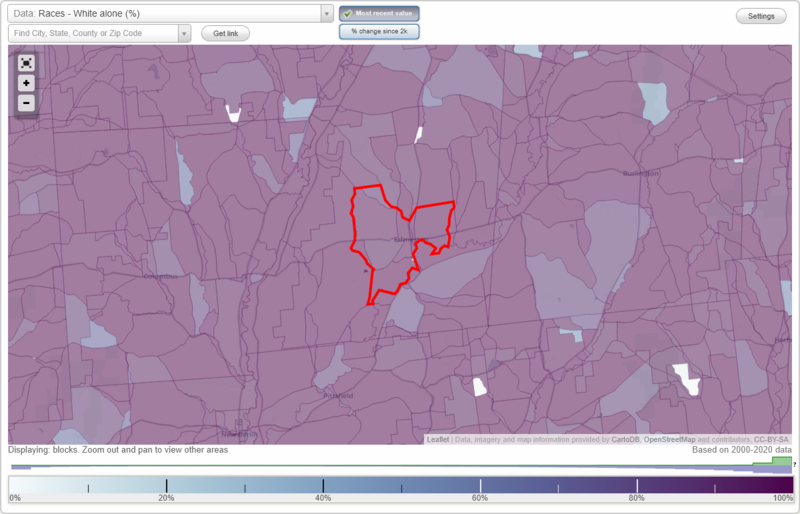
Race distribution in Edmeston

- 1,78397.8%White alone
- 181.0%Hispanic
- 90.5%Two or more races
- 80.4%Black alone
- 50.3%American Indian alone
- 10.05%Asian alone
2000
2022
-
- 11,760,98162.0%White alone
- 2,867,58315.1%Hispanic
- 2,812,62314.8%Black alone
- 1,035,9265.5%Asian alone
- 366,1161.9%Two or more races
- 75,4990.4%Other race alone
- 52,4990.3%American Indian alone
- 5,2300.03%Native Hawaiian and Other
Pacific Islander alone
-
- 10,408,93352.9%White alone
- 3,867,29919.7%Hispanic
- 2,633,84013.4%Black alone
- 1,776,2869.0%Asian alone
- 732,6703.7%Two or more races
- 216,1101.1%Other race alone
- 35,0820.2%American Indian alone
- 6,9310.04%Native Hawaiian and Other
Pacific Islander alone
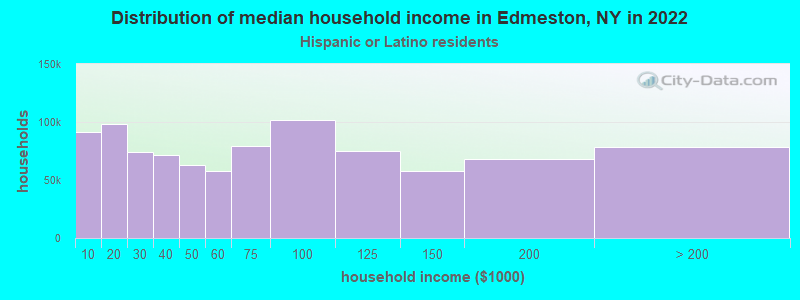
Income and house value in Edmeston
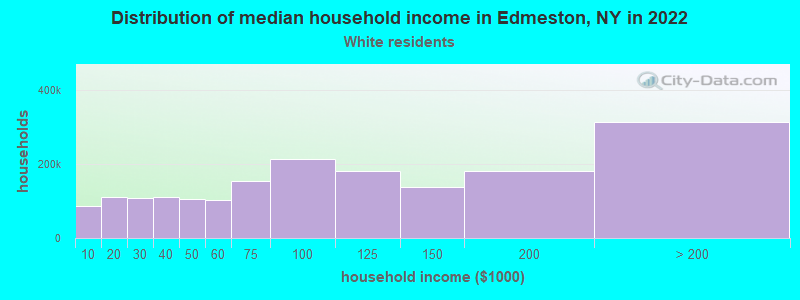
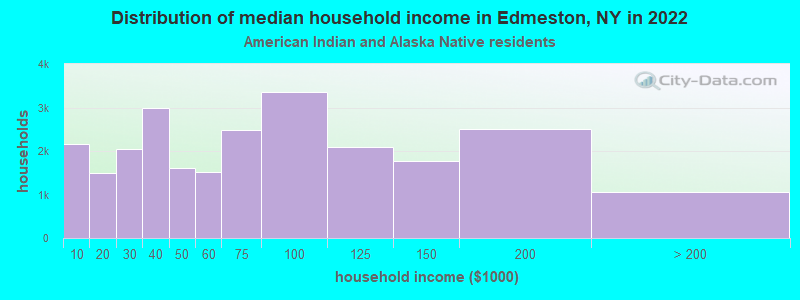
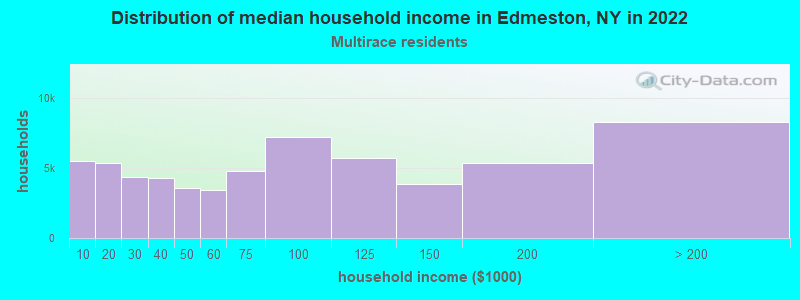
- Median household income in 2022
- $66,080White non-Hispanic householders
- $59,478American Indian and Alaska Native householders
- $13,044Two or more races householders
- $85,644Hispanic or Latino race householders
- Median 2022 house value
- $154,202White Non-Hispanic householders
Foreign-born residents in Edmeston
30 residents are foreign born
| This city: | 1.6% |
| New York: | 20.4% |
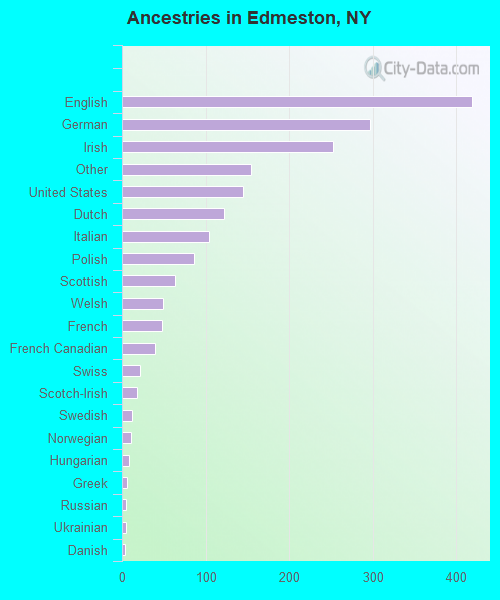
Ancestries in Edmeston

- 41822.3%English
- 29715.8%German
- 25213.4%Irish
- 1548.2%Other
- 1457.7%United States
- 1226.5%Dutch
- 1045.5%Italian
- 864.6%Polish
- 633.4%Scottish
- 492.6%Welsh
- 482.6%French
- 392.1%French Canadian
- 221.2%Swiss
- 181.0%Scotch-Irish
- 120.6%Swedish
- 110.6%Norwegian
- 80.4%Hungarian
- 60.3%Greek
- 50.3%Russian
- 50.3%Ukrainian
- 40.2%Danish
- 30.2%Czech
- 20.1%Arab
- 20.1%Portuguese
- 20.1%Slovak