Races in Edwardsville, Illinois (IL) Detailed Stats
Data:
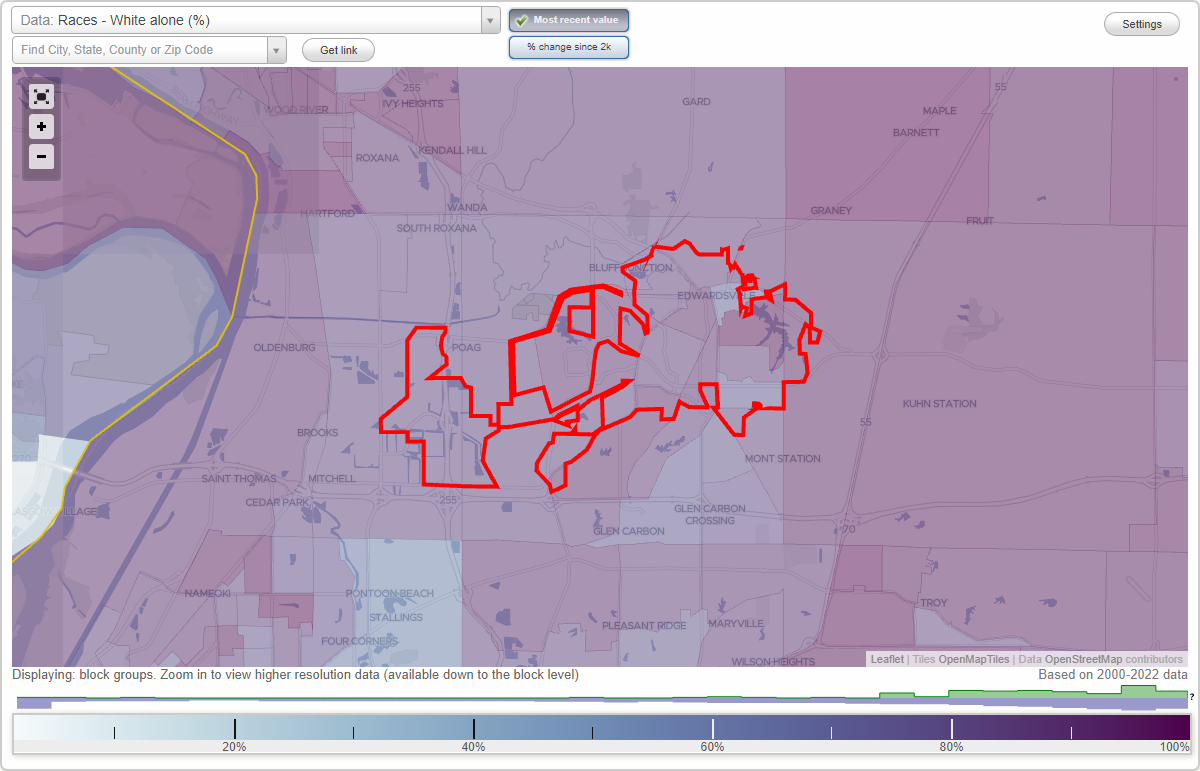
Races - White alone (%)
Races - White alone (% change since 2000)
Races - Black alone (%)
Races - Black alone (% change since 2000)
Races - American Indian alone (%)
Races - American Indian alone (% change since 2000)
Races - Asian alone (%)
Races - Asian alone (% change since 2000)
Races - Hispanic (%)
Races - Hispanic (% change since 2000)
Races - Native Hawaiian and Other Pacific Islander alone (%)
Races - Native Hawaiian and Other Pacific Islander alone (% change since 2000)
Races - Two or more races(%)
Races - Two or more races(% change since 2000)
Races - Other race alone (%)
Races - Other race alone (% change since 2000)
Racial diversity
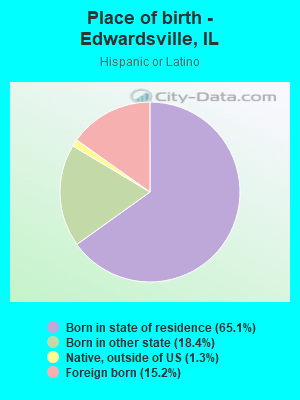
Place of birth - Born in state of residence (%)
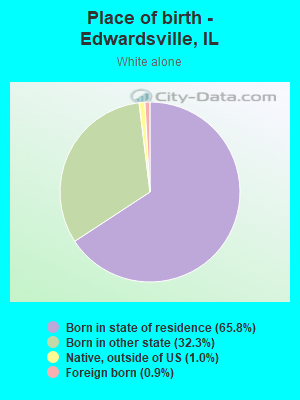
Place of birth - Born in state of residence (%) - White
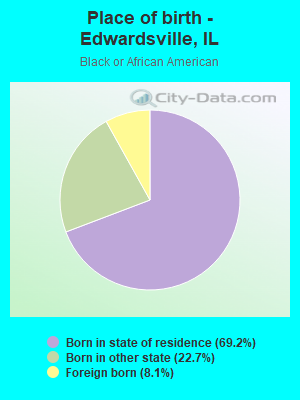
Place of birth - Born in state of residence (%) - Black or African American
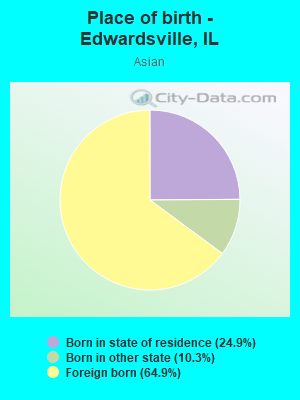
Place of birth - Born in state of residence (%) - Asian
Place of birth - Born in state of residence (%) - Hispanic or Latino
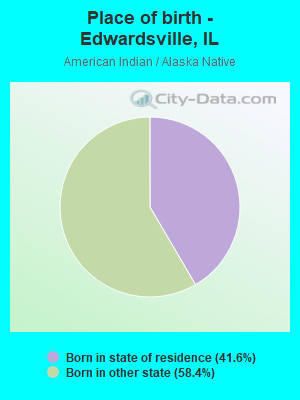
Place of birth - Born in state of residence (%) - American Indian and Alaska Native
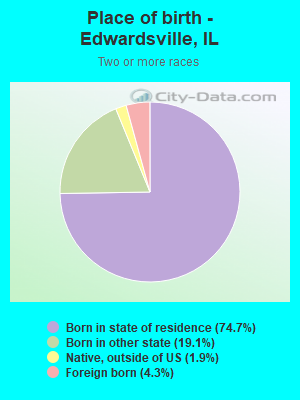
Place of birth - Born in state of residence (%) - Multirace
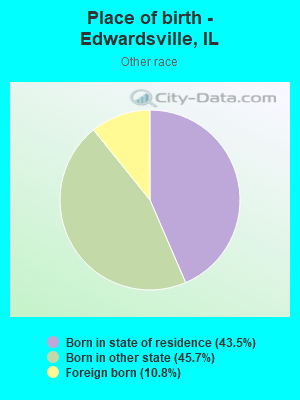
Place of birth - Born in state of residence (%) - Other Race
Place of birth - Born in other state (%)
Place of birth - Born in other state (%) - White
Place of birth - Born in other state (%) - Black or African American
Place of birth - Born in other state (%) - Asian
Place of birth - Born in other state (%) - Hispanic or Latino
Place of birth - Born in other state (%) - American Indian and Alaska Native
Place of birth - Born in other state (%) - Multirace
Place of birth - Born in other state (%) - Other Race
Place of birth - Native, outside of US (%)
Place of birth - Native, outside of US (%) - White
Place of birth - Native, outside of US (%) - Black or African American
Place of birth - Native, outside of US (%) - Asian
Place of birth - Native, outside of US (%) - Hispanic or Latino
Place of birth - Native, outside of US (%) - American Indian and Alaska Native
Place of birth - Native, outside of US (%) - Multirace
Place of birth - Native, outside of US (%) - Other Race
Place of birth - Foreign born (%)
Place of birth - Foreign born (%) - White
Place of birth - Foreign born (%) - Black or African American
Place of birth - Foreign born (%) - Asian
Place of birth - Foreign born (%) - Hispanic or Latino
Place of birth - Foreign born (%) - American Indian and Alaska Native
Place of birth - Foreign born (%) - Multirace
Place of birth - Foreign born (%) - Other Race
Residents speaking English at home (%)
Residents speaking English at home - Born in the United States (%)
Residents speaking English at home - Native, born elsewhere (%)
Residents speaking English at home - Foreign born (%)
Residents speaking Spanish at home (%)
Residents speaking Spanish at home - Born in the United States (%)
Residents speaking Spanish at home - Native, born elsewhere (%)
Residents speaking Spanish at home - Foreign born (%)
Residents speaking other language at home (%)
Residents speaking other language at home - Born in the United States (%)
Residents speaking other language at home - Native, born elsewhere (%)
Residents speaking other language at home - Foreign born (%)
Marital status - Never married (%)
Marital status - Now married (%)
Marital status - Separated (%)
Marital status - Widowed (%)
Marital status - Divorced (%)
Ancestries Reported - Arab (%)
Ancestries Reported - Czech (%)
Ancestries Reported - Danish (%)
Ancestries Reported - Dutch (%)
Ancestries Reported - English (%)
Ancestries Reported - French (%)
Ancestries Reported - French Canadian (%)
Ancestries Reported - German (%)
Ancestries Reported - Greek (%)
Ancestries Reported - Hungarian (%)
Ancestries Reported - Irish (%)
Ancestries Reported - Italian (%)
Ancestries Reported - Lithuanian (%)
Ancestries Reported - Norwegian (%)
Ancestries Reported - Polish (%)
Ancestries Reported - Portuguese (%)
Ancestries Reported - Russian (%)
Ancestries Reported - Scotch-Irish (%)
Ancestries Reported - Scottish (%)
Ancestries Reported - Slovak (%)
Ancestries Reported - Subsaharan African (%)
Ancestries Reported - Swedish (%)
Ancestries Reported - Swiss (%)
Ancestries Reported - Ukrainian (%)
Ancestries Reported - United States (%)
Ancestries Reported - Welsh (%)
Ancestries Reported - West Indian (%)
Ancestries Reported - Other (%)
Geographical mobility - Same house 1 year ago (%)
Geographical mobility - Same house 1 year ago (%) - White
Geographical mobility - Same house 1 year ago (%) - Black or African American
Geographical mobility - Same house 1 year ago (%) - Asian
Geographical mobility - Same house 1 year ago (%) - Hispanic or Latino
Geographical mobility - Same house 1 year ago (%) - American Indian and Alaska Native
Geographical mobility - Same house 1 year ago (%) - Multirace
Geographical mobility - Same house 1 year ago (%) - Other Race
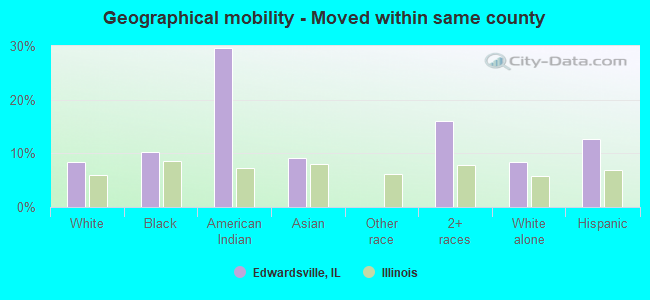
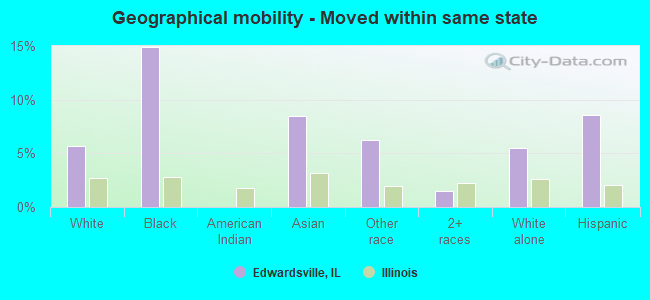
Geographical mobility - Moved within same county (%)
Geographical mobility - Moved within same county (%) - White
Geographical mobility - Moved within same county (%) - Black or African American
Geographical mobility - Moved within same county (%) - Asian
Geographical mobility - Moved within same county (%) - Hispanic or Latino
Geographical mobility - Moved within same county (%) - American Indian and Alaska Native
Geographical mobility - Moved within same county (%) - Multirace
Geographical mobility - Moved within same county (%) - Other Race
Geographical mobility - Moved from different county within same state (%)
Geographical mobility - Moved from different county within same state (%) - White
Geographical mobility - Moved from different county within same state (%) - Black or African American
Geographical mobility - Moved from different county within same state (%) - Asian
Geographical mobility - Moved from different county within same state (%) - Hispanic or Latino
Geographical mobility - Moved from different county within same state (%) - American Indian and Alaska Native
Geographical mobility - Moved from different county within same state (%) - Multirace
Geographical mobility - Moved from different county within same state (%) - Other Race
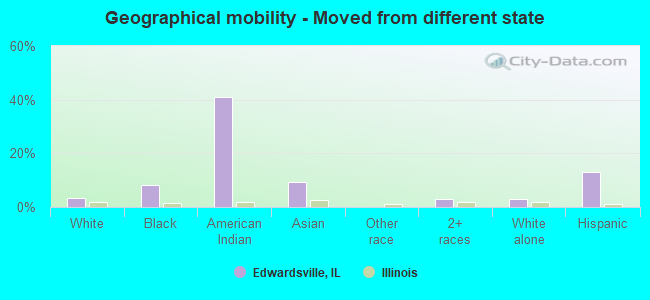
Geographical mobility - Moved from different state (%)
Geographical mobility - Moved from different state (%) - White
Geographical mobility - Moved from different state (%) - Black or African American
Geographical mobility - Moved from different state (%) - Asian
Geographical mobility - Moved from different state (%) - Hispanic or Latino
Geographical mobility - Moved from different state (%) - American Indian and Alaska Native
Geographical mobility - Moved from different state (%) - Multirace
Geographical mobility - Moved from different state (%) - Other Race
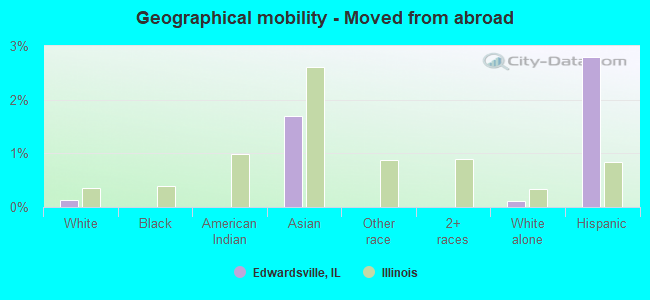
Geographical mobility - Moved from abroad (%)
Geographical mobility - Moved from abroad (%) - White
Geographical mobility - Moved from abroad (%) - Black or African American
Geographical mobility - Moved from abroad (%) - Asian
Geographical mobility - Moved from abroad (%) - Hispanic or Latino
Geographical mobility - Moved from abroad (%) - American Indian and Alaska Native
Geographical mobility - Moved from abroad (%) - Multirace
Geographical mobility - Moved from abroad (%) - Other Race
Place of birth for the foreign-born population - Ireland (%)
Place of birth for the foreign-born population - Denmark (%)
Place of birth for the foreign-born population - Norway (%)
Place of birth for the foreign-born population - Sweden (%)
Place of birth for the foreign-born population - United Kingdom (%)
Place of birth for the foreign-born population - England (%)
Place of birth for the foreign-born population - Scotland (%)
Place of birth for the foreign-born population - Other Northern Europe (%)
Place of birth for the foreign-born population - Austria (%)
Place of birth for the foreign-born population - Belgium (%)
Place of birth for the foreign-born population - France (%)
Place of birth for the foreign-born population - Germany (%)
Place of birth for the foreign-born population - Netherlands (%)
Place of birth for the foreign-born population - Switzerland (%)
Place of birth for the foreign-born population - Other Western Europe (%)
Place of birth for the foreign-born population - Greece (%)
Place of birth for the foreign-born population - Italy (%)
Place of birth for the foreign-born population - Portugal (%)
Place of birth for the foreign-born population - Spain (%)
Place of birth for the foreign-born population - Other Southern Europe (%)
Place of birth for the foreign-born population - Albania (%)
Place of birth for the foreign-born population - Belarus (%)
Place of birth for the foreign-born population - Bosnia and Herzegovina (%)
Place of birth for the foreign-born population - Bulgaria (%)
Place of birth for the foreign-born population - Croatia (%)
Place of birth for the foreign-born population - Czechoslovakia (%)
Place of birth for the foreign-born population - Hungary (%)
Place of birth for the foreign-born population - Latvia (%)
Place of birth for the foreign-born population - Lithuania (%)
Place of birth for the foreign-born population - North Macedonia (Macedonia) (%)
Place of birth for the foreign-born population - Moldova (%)
Place of birth for the foreign-born population - Poland (%)
Place of birth for the foreign-born population - Romania (%)
Place of birth for the foreign-born population - Russia (%)
Place of birth for the foreign-born population - Serbia (%)
Place of birth for the foreign-born population - Ukraine (%)
Place of birth for the foreign-born population - Other Eastern Europe (%)
Place of birth for the foreign-born population - China (%)
Place of birth for the foreign-born population - Hong Kong (%)
Place of birth for the foreign-born population - Taiwan (%)
Place of birth for the foreign-born population - Japan (%)
Place of birth for the foreign-born population - Korea (%)
Place of birth for the foreign-born population - Other Eastern Asia (%)
Place of birth for the foreign-born population - Afghanistan (%)
Place of birth for the foreign-born population - Bangladesh (%)
Place of birth for the foreign-born population - India (%)
Place of birth for the foreign-born population - Iran (%)
Place of birth for the foreign-born population - Kazakhstan (%)
Place of birth for the foreign-born population - Nepal (%)
Place of birth for the foreign-born population - Pakistan (%)
Place of birth for the foreign-born population - Sri Lanka (%)
Place of birth for the foreign-born population - Uzbekistan (%)
Place of birth for the foreign-born population - Other South Central Asia (%)
Place of birth for the foreign-born population - Burma (%)
Place of birth for the foreign-born population - Cambodia (%)
Place of birth for the foreign-born population - Indonesia (%)
Place of birth for the foreign-born population - Laos (%)
Place of birth for the foreign-born population - Malaysia (%)
Place of birth for the foreign-born population - Philippines (%)
Place of birth for the foreign-born population - Singapore (%)
Place of birth for the foreign-born population - Thailand (%)
Place of birth for the foreign-born population - Vietnam (%)
Place of birth for the foreign-born population - Other South Eastern Asia (%)
Place of birth for the foreign-born population - Armenia (%)
Place of birth for the foreign-born population - Iraq (%)
Place of birth for the foreign-born population - Israel (%)
Place of birth for the foreign-born population - Jordan (%)
Place of birth for the foreign-born population - Kuwait (%)
Place of birth for the foreign-born population - Lebanon (%)
Place of birth for the foreign-born population - Saudi Arabia (%)
Place of birth for the foreign-born population - Syria (%)
Place of birth for the foreign-born population - Turkey (%)
Place of birth for the foreign-born population - Yemen (%)
Place of birth for the foreign-born population - Other Western Asia (%)
Place of birth for the foreign-born population - Eritrea (%)
Place of birth for the foreign-born population - Ethiopia (%)
Place of birth for the foreign-born population - Kenya (%)
Place of birth for the foreign-born population - Somalia (%)
Place of birth for the foreign-born population - Uganda (%)
Place of birth for the foreign-born population - Zimbabwe (%)
Place of birth for the foreign-born population - Other Eastern Africa (%)
Place of birth for the foreign-born population - Cameroon (%)
Place of birth for the foreign-born population - Congo (%)
Place of birth for the foreign-born population - Democratic Republic of Congo (Zaire) (%)
Place of birth for the foreign-born population - Other Middle Africa (%)
Place of birth for the foreign-born population - Egypt (%)
Place of birth for the foreign-born population - Morocco (%)
Place of birth for the foreign-born population - Sudan (%)
Place of birth for the foreign-born population - Other Northern Africa (%)
Place of birth for the foreign-born population - South Africa (%)
Place of birth for the foreign-born population - Other Southern Africa (%)
Place of birth for the foreign-born population - Cabo Verde (%)
Place of birth for the foreign-born population - Ghana (%)
Place of birth for the foreign-born population - Liberia (%)
Place of birth for the foreign-born population - Nigeria (%)
Place of birth for the foreign-born population - Senegal (%)
Place of birth for the foreign-born population - Sierra Leone (%)
Place of birth for the foreign-born population - Other Western Africa (%)
Place of birth for the foreign-born population - Australia (%)
Place of birth for the foreign-born population - New Zealand (%)
Place of birth for the foreign-born population - Fiji (%)
Place of birth for the foreign-born population - Micronesia (%)
Place of birth for the foreign-born population - Bahamas (%)
Place of birth for the foreign-born population - Barbados (%)
Place of birth for the foreign-born population - Cuba (%)
Place of birth for the foreign-born population - Dominica (%)
Place of birth for the foreign-born population - Dominican Republic (%)
Place of birth for the foreign-born population - Grenada (%)
Place of birth for the foreign-born population - Haiti (%)
Place of birth for the foreign-born population - Jamaica (%)
Place of birth for the foreign-born population - St. Vincent and the Grenadines (%)
Place of birth for the foreign-born population - Trinidad and Tobago (%)
Place of birth for the foreign-born population - West Indies (%)
Place of birth for the foreign-born population - Other Caribbean (%)
Place of birth for the foreign-born population - Belize (%)
Place of birth for the foreign-born population - Costa Rica (%)
Place of birth for the foreign-born population - El Salvador (%)
Place of birth for the foreign-born population - Guatemala (%)
Place of birth for the foreign-born population - Honduras (%)
Place of birth for the foreign-born population - Mexico (%)
Place of birth for the foreign-born population - Nicaragua (%)
Place of birth for the foreign-born population - Panama (%)
Place of birth for the foreign-born population - Other Central America (%)
Place of birth for the foreign-born population - Argentina (%)
Place of birth for the foreign-born population - Bolivia (%)
Place of birth for the foreign-born population - Brazil (%)
Place of birth for the foreign-born population - Chile (%)
Place of birth for the foreign-born population - Colombia (%)
Place of birth for the foreign-born population - Ecuador (%)
Place of birth for the foreign-born population - Guyana (%)
Place of birth for the foreign-born population - Peru (%)
Place of birth for the foreign-born population - Uruguay (%)
Place of birth for the foreign-born population - Venezuela (%)
Place of birth for the foreign-born population - Other South America (%)
Place of birth for the foreign-born population - Canada (%)
Place of birth for the foreign-born population - Other Northern America (%)
Place of birth for the foreign-born population - Other (%)
Latest news about races in Edwardsville, IL collected exclusively by city-data.com from local newspapers, TV, and radio stations
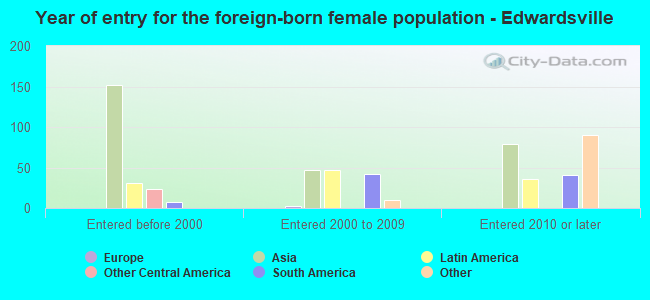
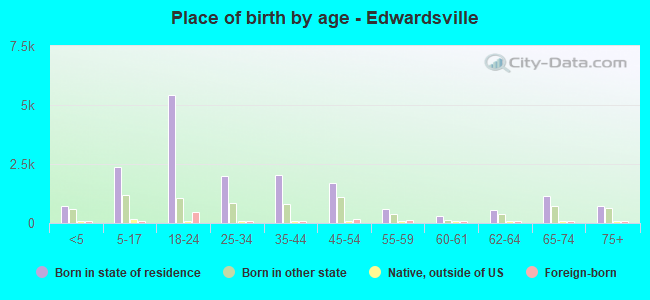
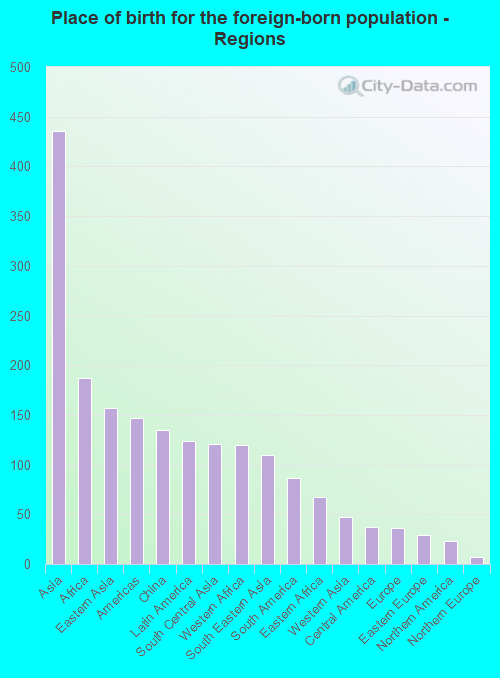
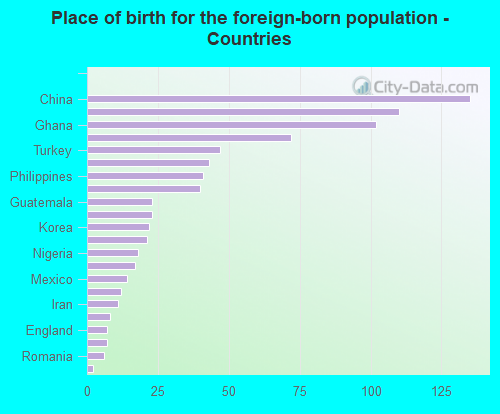
According to 2022 data, the most numerous races in Edwardsville, IL are White alone (22,296 residents), Hispanic (745 residents), and Black alone (1,452 residents). 95.9% of Edwardsville residents speak English at home. 3.1% of Edwardsville, IL residents are foreign-born (1.6% born in Asia, 0.7% born in Africa, 0.5% born in Latin America), which is 359.0% less than the foreign-born rate of 14.0% across the entire state of Illinois.
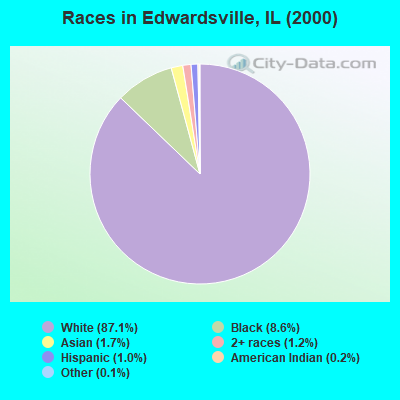
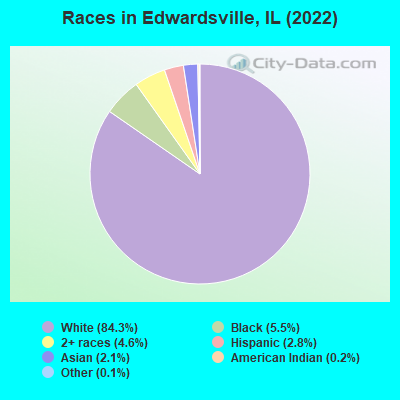
Race distribution in Edwardsville
2000 2022
8,424,140 67.8% White alone 1,856,152 14.9% Black alone 1,530,262 12.3% Hispanic 419,916 3.4% Asian alone 153,996 1.2% Two or more races 13,479 0.1% Other race alone 18,232 0.1% American Indian alone 3,116 0.03% Native Hawaiian and Other
7,356,301 58.5% White alone 2,299,726 18.3% Hispanic 1,660,423 13.2% Black alone 747,296 5.9% Asian alone 458,599 3.6% Two or more races 45,386 0.4% Other race alone 10,405 0.08% American Indian alone 3,896 0.03% Native Hawaiian and Other
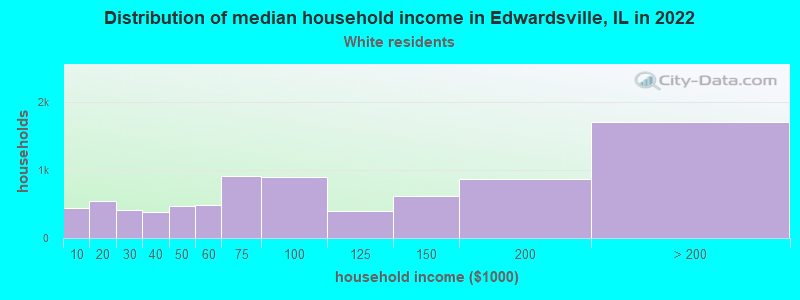
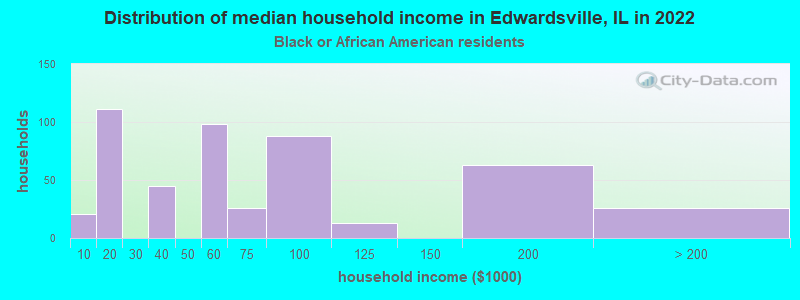
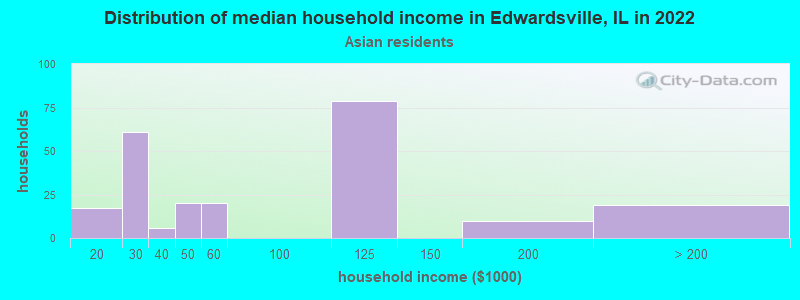
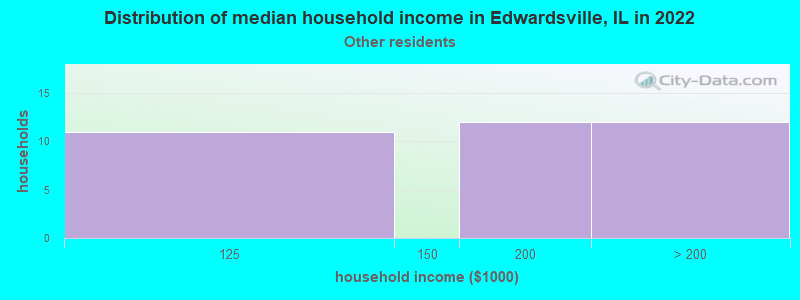
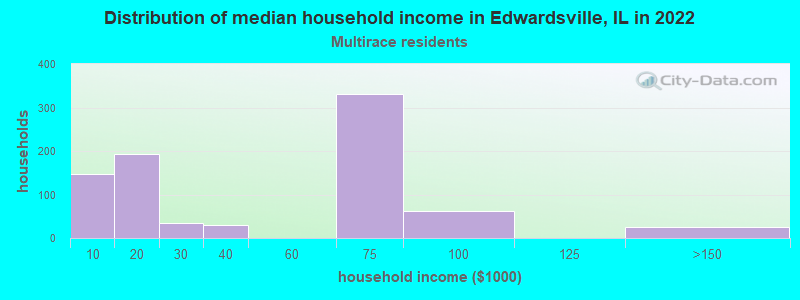
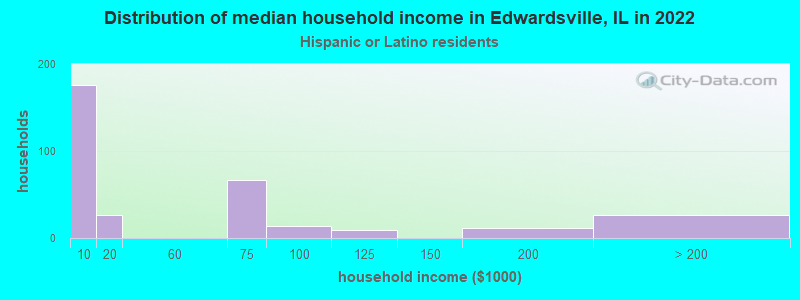
Income and house value in Edwardsville Median household income in 2022 $85,635 White non-Hispanic householders$60,816 Black householdersover $200,000 Some other race householdersMedian 2022 house value $295,992 White Non-Hispanic householders$274,616 Black or African American householders$408,214 American Indian or Alaska Native householders $543,295 Asian householders$282,038 Native Hawaiian and other Pacific Islander householders$163,285 Some other race householders$252,350 Two or more races householders$198,317 Hispanic or Latino householders
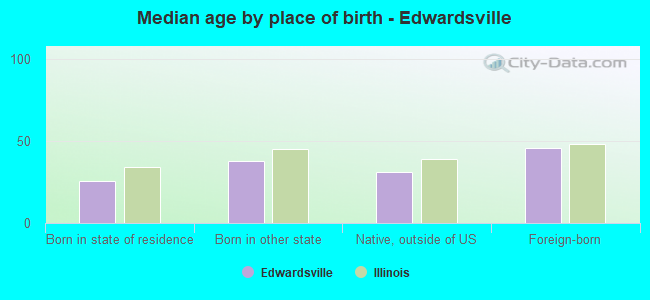
Median age by race in Edwardsville
32.0 Median age for White residents32.9 32.0 22.7 Median age for Black or African American residents28.8 22.9 33.2 Median age for American Indian / Alaska Native residents56.5 -741,617,356.3 29.5 Median age for Asian residents22.5 30.8 -593,236,714.4 Median age for Native Hawaiian / Pacific Islander residents-666,666,666.0 -666,666,666.0 26.2 Median age for Other race residents27.2 17.2 29.4 Median age for Two or more races residents25.3 33.9 32.0 Median age for White alone residents33.1 32.1 26.7 Median age for Hispanic or Latino residents23.9 27.6
Owner/renter occupied households by race in Edwardsville
House owners and renters - White residents 5,570 67.8% Owner occupied2,649 32.2% Renter occupiedHouse owners and renters - Black or African American residents 175 50.1% Owner occupied174 49.9% Renter occupiedHouse owners and renters - American Indian / Alaska Native residents 29 100.0% Renter occupiedHouse owners and renters - Asian residents 43 12.8% Owner occupied293 87.2% Renter occupiedHouse owners and renters - Other race residents 14 41.1% Owner occupied20 58.9% Renter occupiedHouse owners and renters - Two or more races residents 250 24.0% Owner occupied791 76.0% Renter occupiedHouse owners and renters - White alone residents 5,611 68.0% Owner occupied2,642 32.0% Renter occupiedHouse owners and renters - Hispanic or Latino residents 118 46.0% Owner occupied138 54.0% Renter occupied
Language usage in Edwardsville
English speakers - Total 95.9% of residents of Edwardsville speak English at home.
0.9% of residents speak Spanish at home 174 78.7% Speak English very well47 21.3% Speak English less than very well3.3% of residents speak other language at home 506 60.5% Speak English very well330 39.5% Speak English less than very well
English speakers - Born in the United States 97.9% of residents of Edwardsville speak English at home.
0.9% of residents speak Spanish at home 68 100.0% Speak English very well0.6% of residents speak other language at home 43 100.0% Speak English very well
All residents speak only English at home
English speakers - Foreign-born 22.9% of residents of Edwardsville speak English at home.
11.4% of residents speak Spanish at home 55 59.8% Speak English very well37 40.2% Speak English less than very well69.6% of residents speak other language at home 283 50.5% Speak English very well277 49.5% Speak English less than very well
White (Caucasian) - Speak only English Native:
99.3% (20,825)Foreign-born:
36.7% (69)
White (Caucasian) - Speak another language Native:
0.8% (160)Foreign-born:
63.3% (120)
Black or African American - Speak only English Native:
90.0% (1,390)Foreign-born:
20.3% (31)
Black or African American - Speak another language Native:
9.9% (153)Foreign-born:
77.8% (117)
Asian - Speak only English Native:
25.6% (49)Foreign-born:
30.7% (112)
Asian - Speak another language Native:
87.8% (169)Foreign-born:
79.0% (289)
Other race - Speak another language Native:
11.4% (15)Foreign-born:
99.9% (26)
Two or more races - Speak another language Native:
0.3% (5)Foreign-born:
100.0% (81)
White alone - Speak only English Native:
99.1% (20,747)Foreign-born:
44.7% (89)
White alone - Speak another language Native:
0.9% (193)Foreign-born:
51.6% (103)
Hispanic or Latino - Speak only English Native:
100.0% (597)Foreign-born:
10.2% (12)
Hispanic or Latino - Speak another language Native:
7.9% (47)Foreign-born:
90.1% (103)
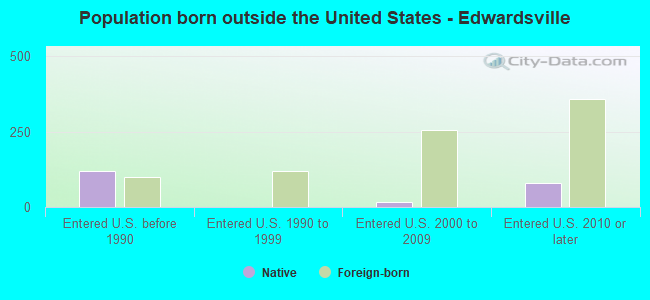
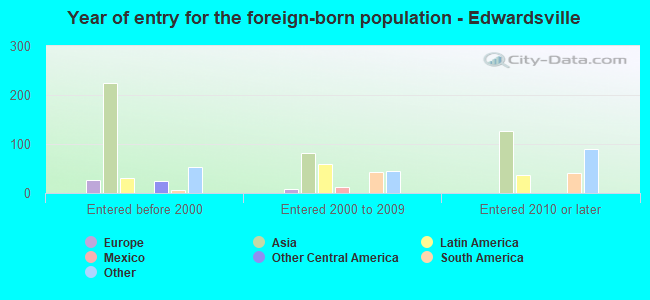
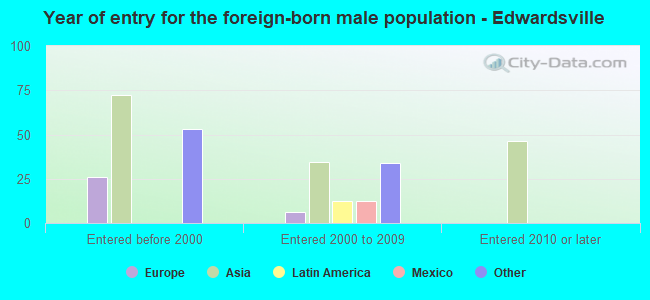
Foreign-born residents in Edwardsville 807 residents are foreign born (1.6% Asia , 0.7% Africa , 0.5% Latin America ).
This city:
3.1%Illinois:
14.1%
Marital status for residents in Edwardsville Marital status - White (Caucasian) population 15 years and over
Males 41.8% Never married48.6% Now married0.6% Separated2.1% Widowed7.0% DivorcedFemales 40.5% Never married44.3% Now married0.4% Separated4.5% Widowed10.3% DivorcedWomen who gave birth in the past 12 months Now married:
83.8% (224)Unmarried:
16.2% (43)
Women who did not give birth in the past 12 months Now married:
34.2% (2,120)Unmarried:
65.8% (4,080)
Marital status - Black or African American population 15 years and over
Males 44.4% Never married33.6% Now married0.0% Separated0.0% Widowed22.0% DivorcedFemales 78.0% Never married13.2% Now married0.0% Separated3.3% Widowed5.5% DivorcedWomen who gave birth in the past 12 months Now married:
94.6% (29)Unmarried:
5.4% (2)
Women who did not give birth in the past 12 months Now married:
10.8% (72)Unmarried:
89.2% (600)
Marital status - American Indian / Alaska Native population 15 years and over
Males 0.0% Never married18.8% Now married0.0% Separated0.0% Widowed81.2% DivorcedFemales 0.0% Never married100.0% Now married0.0% Separated0.0% Widowed0.0% DivorcedWomen who did not give birth in the past 12 months Now married:
100.0% (38)Unmarried:
0.0% (0)
Marital status - Asian population 15 years and over
Males 55.3% Never married33.2% Now married0.0% Separated0.0% Widowed11.5% DivorcedFemales 54.8% Never married41.5% Now married0.0% Separated3.0% Widowed0.7% DivorcedWomen who did not give birth in the past 12 months Now married:
27.2% (57)Unmarried:
72.8% (151)
Marital status - Other race population 15 years and over
Males 49.1% Never married50.9% Now married0.0% Separated0.0% Widowed0.0% DivorcedFemales 69.2% Never married15.4% Now married0.0% Separated0.0% Widowed15.4% DivorcedWomen who did not give birth in the past 12 months Now married:
18.2% (9)Unmarried:
81.8% (42)
Marital status - Two or more races population 15 years and over
Males 83.1% Never married14.3% Now married0.0% Separated0.0% Widowed2.6% DivorcedFemales 48.7% Never married10.2% Now married25.7% Separated0.0% Widowed15.5% DivorcedWomen who did not give birth in the past 12 months Now married:
11.3% (41)Unmarried:
88.7% (326)
Marital status - White alone, not Hispanic / Latino population 15 years and over
Males 41.8% Never married48.6% Now married0.6% Separated2.1% Widowed7.0% DivorcedFemales 39.9% Never married44.7% Now married0.5% Separated4.5% Widowed10.5% DivorcedWomen who gave birth in the past 12 months Now married:
83.8% (227)Unmarried:
16.2% (44)
Women who did not give birth in the past 12 months Now married:
34.8% (2,142)Unmarried:
65.2% (4,021)
Marital status - Hispanic or Latino population 15 years and over
Males 63.3% Never married31.8% Now married0.0% Separated0.0% Widowed4.9% DivorcedFemales 53.8% Never married15.3% Now married22.1% Separated0.0% Widowed8.8% DivorcedWomen who did not give birth in the past 12 months Now married:
17.0% (40)Unmarried:
83.0% (193)
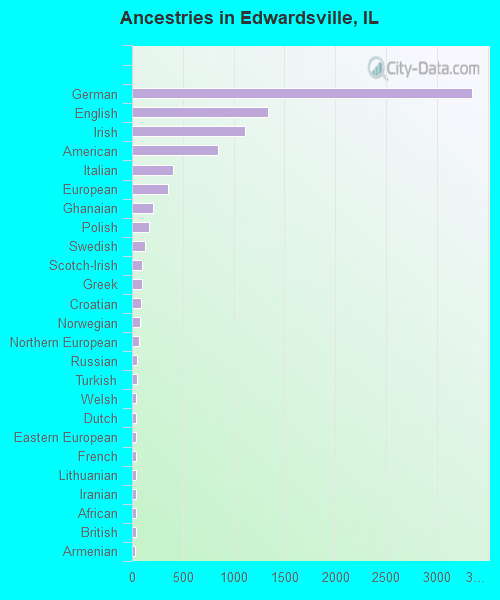
Ancestries in Edwardsville
3,347 29.1% German1,339 11.6% English1,108 9.6% Irish846 7.3% American400 3.5% Italian352 3.1% European209 1.8% Ghanaian172 1.5% Polish129 1.1% Swedish102 0.9% Scotch-Irish98 0.9% Greek92 0.8% Croatian79 0.7% Norwegian65 0.6% Northern European46 0.4% Russian45 0.4% Turkish42 0.4% Welsh40 0.3% Dutch40 0.3% Eastern European39 0.3% French39 0.3% Lithuanian36 0.3% Iranian36 0.3% African35 0.3% British34 0.3% Armenian34 0.3% Danish27 0.2% Czechoslovakian24 0.2% Scandinavian19 0.2% Nigerian16 0.1% French Canadian15 0.1% Belgian15 0.1% Pennsylvania German13 0.1% Slovak12 0.1% Ukrainian7 0.06% Romanian5 0.04% Hungarian
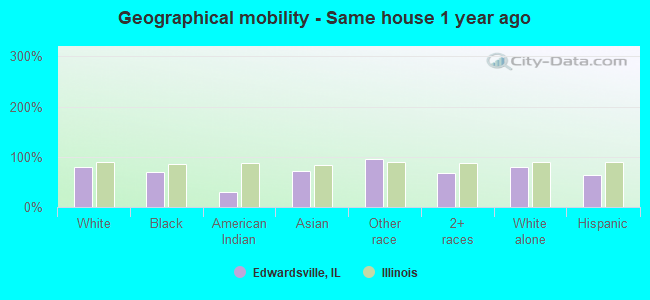
Geographical mobility in Edwardsville Same house 1 year ago 17,553 79.4% White (Caucasian)999 70.2% Black or African American25 29.0% American Indian / Alaska Native445 72.4% Asian148 95.3% Other race1,277 67.7% Two or more races17,628 79.7% White alone, not Hispanic / Latino476 63.4% Hispanic or LatinoMoved within same county 1,839 8.3% White / Caucasian146 10.3% Black or African American25 29.7% American Indian / Alaska Native56 9.1% Asian303 16.1% Two or more races1,854 8.4% White alone, not Hispanic / Latino96 12.7% Hispanic or LatinoMoved within same state 1,258 5.7% White / Caucasian212 14.9% Black or African American52 8.4% Asian10 6.2% Other race28 1.5% Two or more races1,216 5.5% White alone, not Hispanic / Latino64 8.5% Hispanic or LatinoMoved from different state 706 3.2% White / Caucasian117 8.2% Black or African American35 41.1% American Indian / Alaska Native58 9.4% Asian59 3.1% Two or more races648 2.9% White alone, not Hispanic / Latino99 13.2% Hispanic or LatinoMoved from abroad 29 0.1% White10 1.7% Asian23 0.1% White alone, not Hispanic / Latino21 2.8% Hispanic or Latino
Children Nativity (place of birth) in Edwardsville
Children under 6 years - Living with two parents Both parents native 1,204 100.0% NativeBoth parents foreign-born 79 100.0% NativeOne native, one foreign-born parent 19 100.0% NativeChildren under 6 years - Living with one parent Native parent 261 100.0% NativeChildren 6 to 17 years - Living with two parents Both parents native 2,477 99.7% Native6 0.3% Foreign-bornBoth parents foreign-born 170 100.0% NativeOne native, one foreign-born parent 99 100.0% NativeChildren 6 to 17 years - Living with one parent Native parent 449 100.0% NativeForeign-born parent 30 49.8% Native30 50.2% Foreign-born
Grandparents responsible for own grandchildren in Edwardsville
Grandparents (30 to 59 years) White / Caucasian 52 100.0% Not responsible for grandchildrenBlack or African American 31 100.0% Responsible for grandchildrenWhite alone, not Hispanic / Latino 40 100.0% Not responsible for grandchildrenHispanic or Latino 25 100.0% Not responsible for grandchildrenGrandparents (60 years and over) White / Caucasian 24 17.2% Responsible for grandchildren115 82.8% Not responsible for grandchildrenWhite alone, not Hispanic / Latino 24 17.2% Responsible for grandchildren115 82.8% Not responsible for grandchildren