Races in Egremont, Massachusetts (MA) Detailed Stats
Ancestries, Foreign-born residents, place of birth
4.8% of Egremont, MA residents are foreign-born (4.2% born in Europe), which is 272.5% less than the foreign-born rate of 18.0% across the entire state of Massachusetts.
Race distribution in Egremont

- 1,31097.4%White alone
- 141.0%Hispanic
- 120.9%Two or more races
- 40.3%Asian alone
- 40.3%Other race alone
- 10.07%Black alone
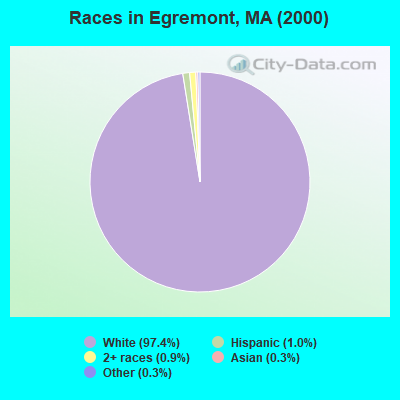
2000
2022
-
- 5,198,35981.9%White alone
- 428,7296.8%Hispanic
- 318,3295.0%Black alone
- 236,7863.7%Asian alone
- 110,3381.7%Two or more races
- 43,5860.7%Other race alone
- 11,2640.2%American Indian alone
- 1,7060.03%Native Hawaiian and Other
Pacific Islander alone

-
- 4,676,62767.0%White alone
- 911,03813.0%Hispanic
- 501,4637.2%Asian alone
- 459,7406.6%Black alone
- 341,8894.9%Two or more races
- 84,4031.2%Other race alone
- 5,8380.08%American Indian alone
- 9760.01%Native Hawaiian and Other
Pacific Islander alone

Income and house value in Egremont
- Median household income in 2022
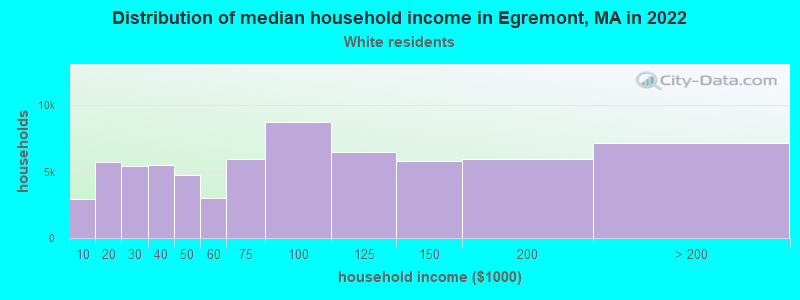
- $98,773White non-Hispanic householders
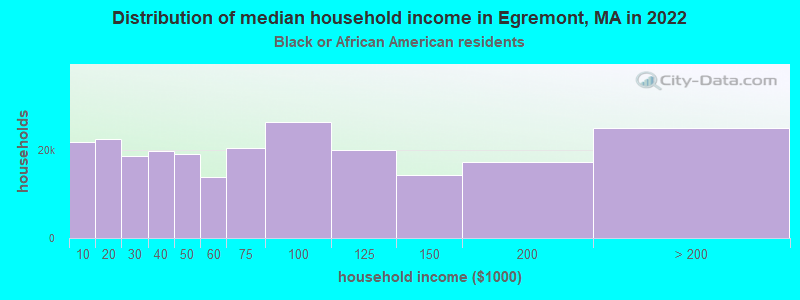
- $66,279Black householders
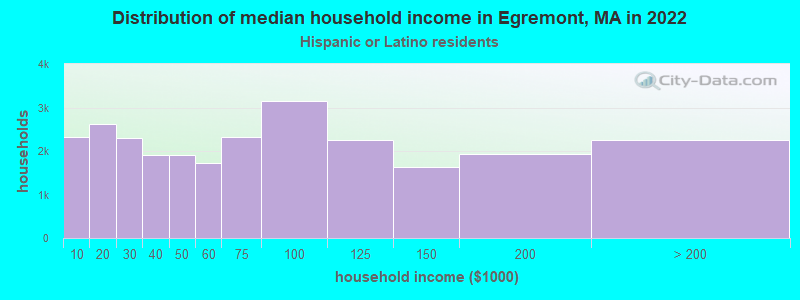
- $4,233Hispanic or Latino race householders
- Median 2022 house value
- $518,794White Non-Hispanic householders
- $300,847Black or African American householders
Household income for White non-Hispanic householders
Household income for Black householders
Household income for Hispanic or Latino race householders
Foreign-born residents in Egremont
65 residents are foreign born (4.2% Europe).
| This city: | 4.8% |
| Massachusetts: | 12.2% |
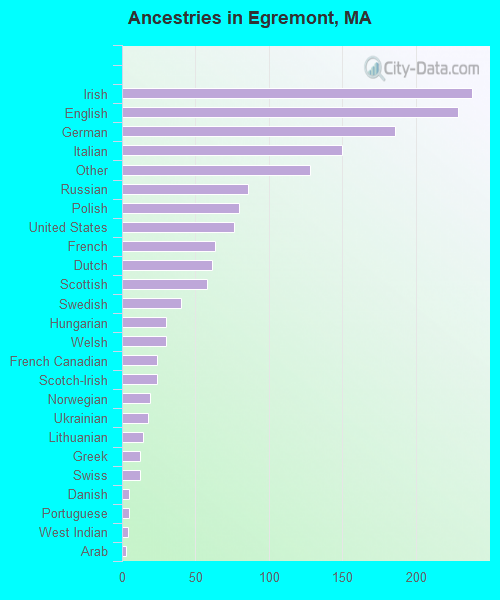
Ancestries in Egremont

- 23814.9%Irish
- 22914.3%English
- 18611.6%German
- 1509.4%Italian
- 1288.0%Other
- 865.4%Russian
- 805.0%Polish
- 764.8%United States
- 633.9%French
- 613.8%Dutch
- 583.6%Scottish
- 402.5%Swedish
- 301.9%Hungarian
- 301.9%Welsh
- 241.5%French Canadian
- 241.5%Scotch-Irish
- 191.2%Norwegian
- 181.1%Ukrainian
- 140.9%Lithuanian
- 120.8%Greek
- 120.8%Swiss
- 50.3%Danish
- 50.3%Portuguese
- 40.2%West Indian
- 30.2%Arab
- 30.2%Czech
- 20.1%Slovak
Zip codes: 01230.