Races in Essex, Vermont (VT) Detailed Stats
Ancestries, Foreign-born residents, place of birth
5.9% of Essex, VT residents are foreign-born (2.1% born in Europe, 1.8% born in North America, 1.8% born in Asia), which is 32.6% greater than the foreign-born rate of 4.0% across the entire state of Vermont.
Race distribution in Essex

- 17,65194.8%White alone
- 4172.2%Asian alone
- 1811.0%Two or more races
- 1630.9%Black alone
- 1580.8%Hispanic
- 360.2%American Indian alone
- 190.1%Other race alone
- 10.01%Native Hawaiian and Other
Pacific Islander alone
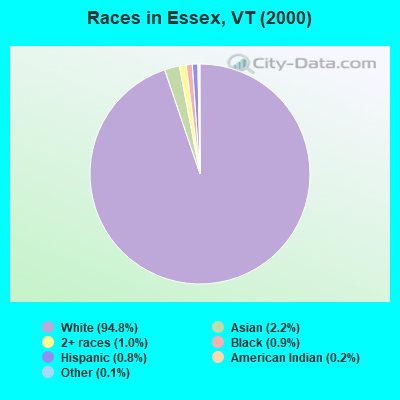
2000
2022
-
- 585,43196.2%White alone
- 6,8091.1%Two or more races
- 5,5040.9%Hispanic
- 5,1600.8%Asian alone
- 2,9210.5%Black alone
- 2,3250.4%American Indian alone
- 5570.09%Other race alone
- 1200.02%Native Hawaiian and Other
Pacific Islander alone

-
- 583,54690.2%White alone
- 27,3404.2%Two or more races
- 14,7702.3%Hispanic
- 11,5121.8%Asian alone
- 6,2641.0%Black alone
- 2,5210.4%Other race alone
- 1,0520.2%American Indian alone
- 590.01%Native Hawaiian and Other
Pacific Islander alone

Income and house value in Essex
- Median household income in 2022
- $106,459White non-Hispanic householders
- $39,726Black householders
- $108,482Asian householders
- $93,259Some other race householders
- $158,330Two or more races householders
- $160,477Hispanic or Latino race householders
- Median 2022 house value
- $441,694White Non-Hispanic householders
- $348,461Black or African American householders
- $464,615American Indian or Alaska Native householders
- $461,208Asian householders
- $278,769Some other race householders
- $411,339Two or more races householders
- $420,322Hispanic or Latino householders
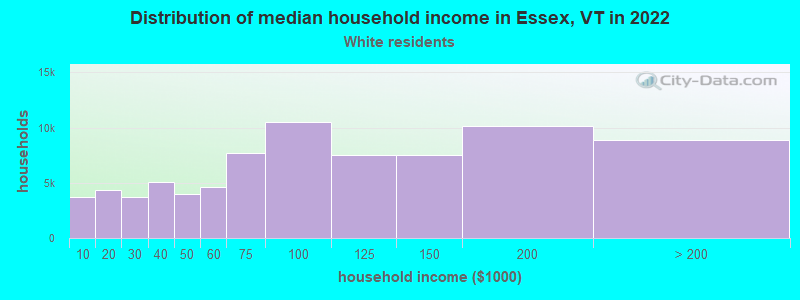
Household income for White non-Hispanic householders
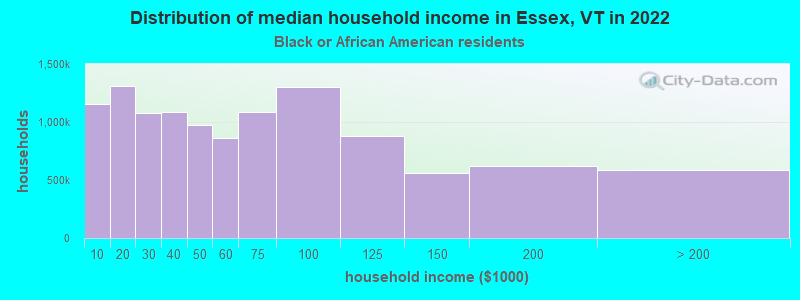
Household income for Black householders
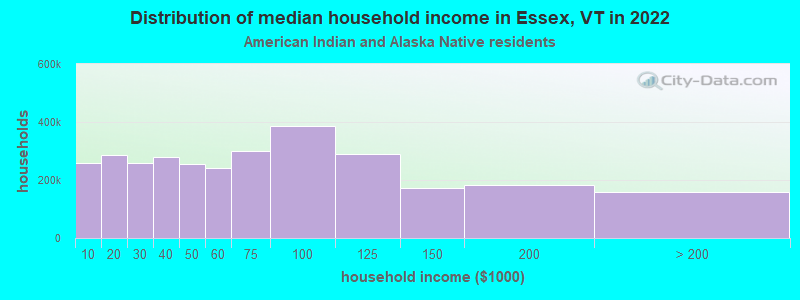
Household income for American Indian and Alaska Native householders
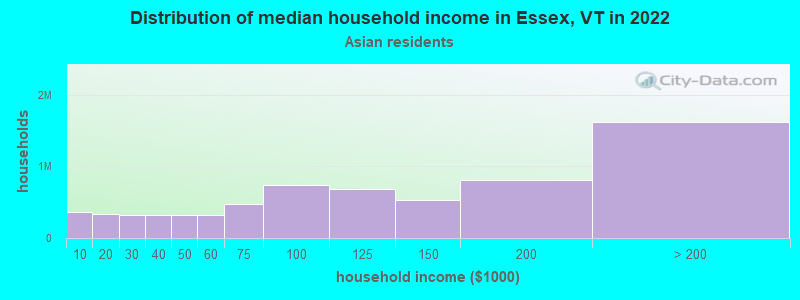
Household income for Asian householders
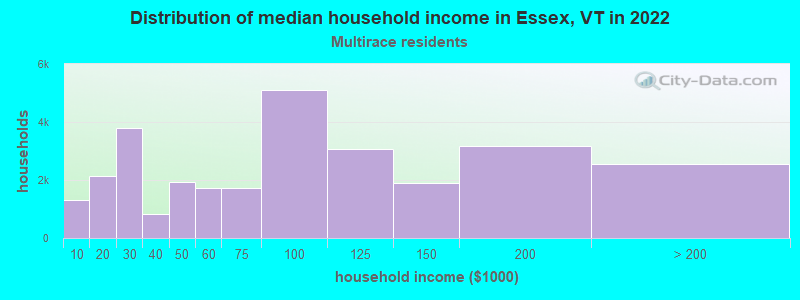
Household income for Two or more races householders
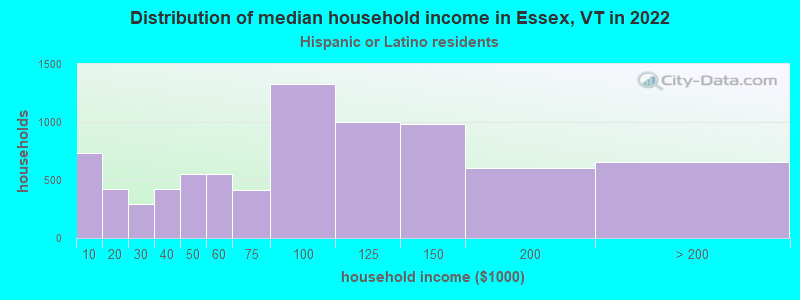
Household income for Hispanic or Latino race householders
Foreign-born residents in Essex
1,105 residents are foreign born (2.1% Europe, 1.8% North America, 1.8% Asia).
| This city: | 5.9% |
| Vermont: | 3.8% |
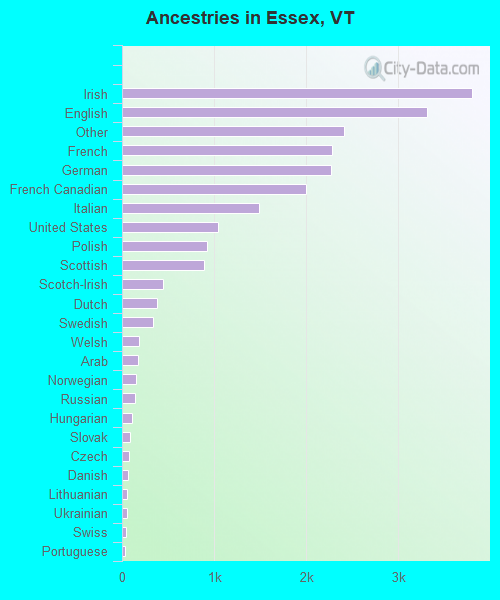
Ancestries in Essex

- 3,79316.6%Irish
- 3,31014.5%English
- 2,41110.6%Other
- 2,28210.0%French
- 2,27010.0%German
- 1,9968.8%French Canadian
- 1,4886.5%Italian
- 1,0424.6%United States
- 9224.0%Polish
- 8853.9%Scottish
- 4411.9%Scotch-Irish
- 3811.7%Dutch
- 3371.5%Swedish
- 1880.8%Welsh
- 1710.8%Arab
- 1500.7%Norwegian
- 1440.6%Russian
- 1080.5%Hungarian
- 860.4%Slovak
- 770.3%Czech
- 660.3%Danish
- 560.2%Lithuanian
- 500.2%Ukrainian
- 400.2%Swiss
- 370.2%Portuguese
- 270.1%Greek
- 190.08%West Indian
- 100.04%Subsaharan African
Zip codes: 05452.