Races in Ewa Gentry, Hawaii (HI) Detailed Stats
Data:
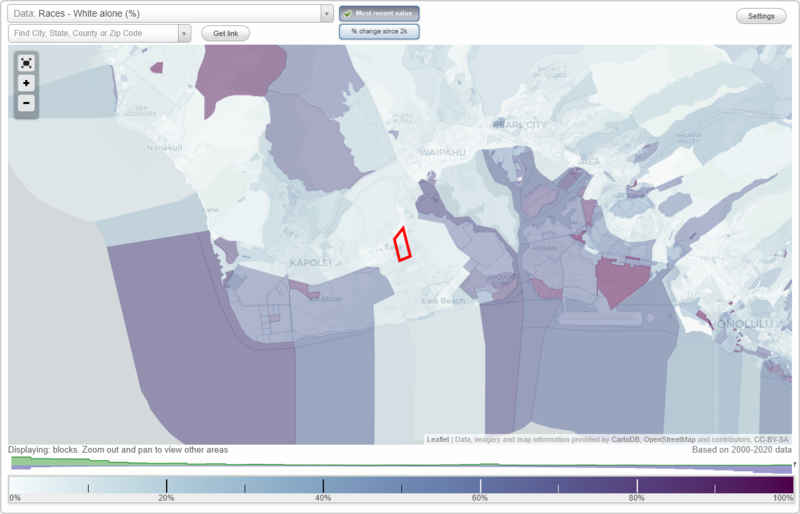
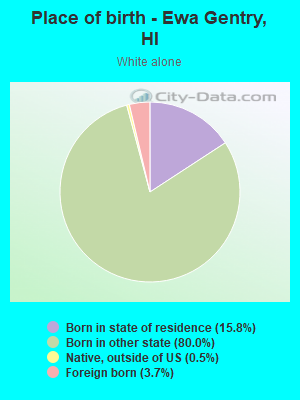
Races - White alone (%)
Races - White alone (% change since 2000)
Races - Black alone (%)
Races - Black alone (% change since 2000)
Races - American Indian alone (%)
Races - American Indian alone (% change since 2000)
Races - Asian alone (%)
Races - Asian alone (% change since 2000)
Races - Hispanic (%)
Races - Hispanic (% change since 2000)
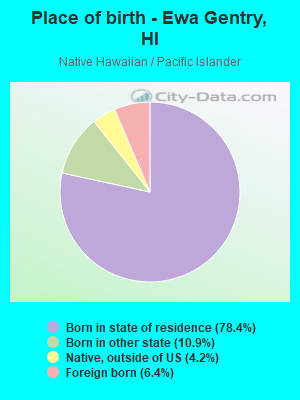
Races - Native Hawaiian and Other Pacific Islander alone (%)
Races - Native Hawaiian and Other Pacific Islander alone (% change since 2000)
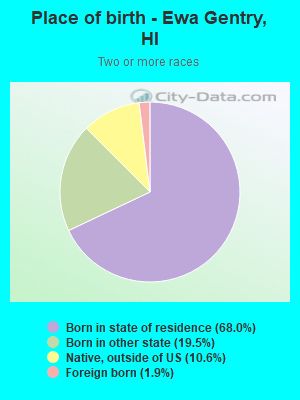
Races - Two or more races(%)
Races - Two or more races(% change since 2000)
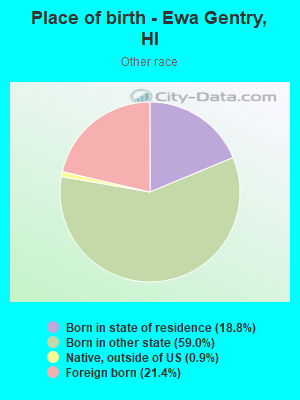
Races - Other race alone (%)
Races - Other race alone (% change since 2000)
Racial diversity
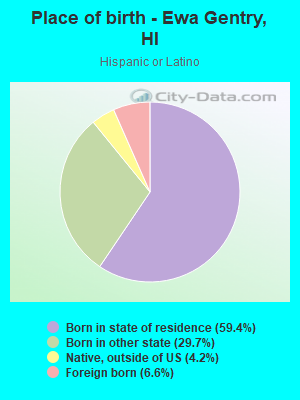
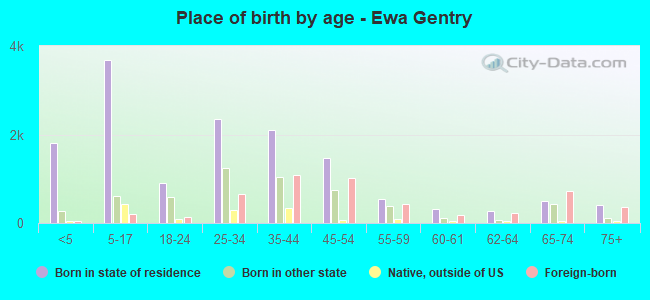
Place of birth - Born in state of residence (%)
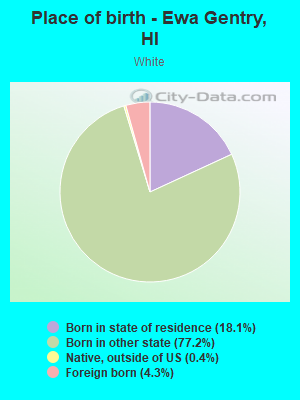
Place of birth - Born in state of residence (%) - White
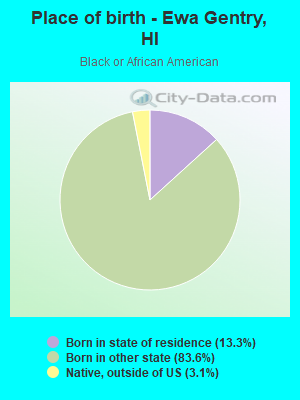
Place of birth - Born in state of residence (%) - Black or African American
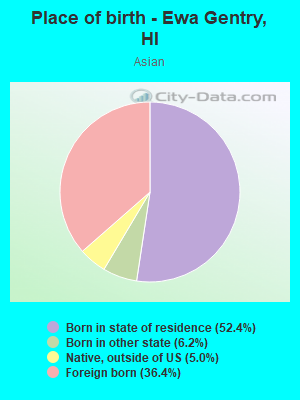
Place of birth - Born in state of residence (%) - Asian
Place of birth - Born in state of residence (%) - Hispanic or Latino
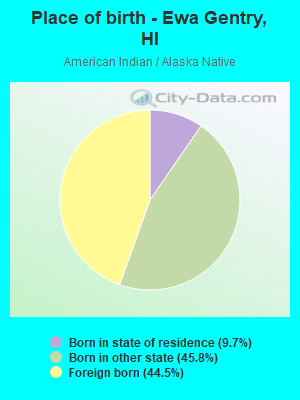
Place of birth - Born in state of residence (%) - American Indian and Alaska Native
Place of birth - Born in state of residence (%) - Multirace
Place of birth - Born in state of residence (%) - Other Race
Place of birth - Born in other state (%)
Place of birth - Born in other state (%) - White
Place of birth - Born in other state (%) - Black or African American
Place of birth - Born in other state (%) - Asian
Place of birth - Born in other state (%) - Hispanic or Latino
Place of birth - Born in other state (%) - American Indian and Alaska Native
Place of birth - Born in other state (%) - Multirace
Place of birth - Born in other state (%) - Other Race
Place of birth - Native, outside of US (%)
Place of birth - Native, outside of US (%) - White
Place of birth - Native, outside of US (%) - Black or African American
Place of birth - Native, outside of US (%) - Asian
Place of birth - Native, outside of US (%) - Hispanic or Latino
Place of birth - Native, outside of US (%) - American Indian and Alaska Native
Place of birth - Native, outside of US (%) - Multirace
Place of birth - Native, outside of US (%) - Other Race
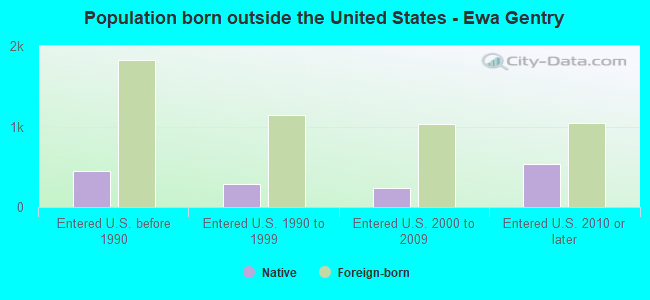
Place of birth - Foreign born (%)
Place of birth - Foreign born (%) - White
Place of birth - Foreign born (%) - Black or African American
Place of birth - Foreign born (%) - Asian
Place of birth - Foreign born (%) - Hispanic or Latino
Place of birth - Foreign born (%) - American Indian and Alaska Native
Place of birth - Foreign born (%) - Multirace
Place of birth - Foreign born (%) - Other Race
Residents speaking English at home (%)
Residents speaking English at home - Born in the United States (%)
Residents speaking English at home - Native, born elsewhere (%)
Residents speaking English at home - Foreign born (%)
Residents speaking Spanish at home (%)
Residents speaking Spanish at home - Born in the United States (%)
Residents speaking Spanish at home - Native, born elsewhere (%)
Residents speaking Spanish at home - Foreign born (%)
Residents speaking other language at home (%)
Residents speaking other language at home - Born in the United States (%)
Residents speaking other language at home - Native, born elsewhere (%)
Residents speaking other language at home - Foreign born (%)
Marital status - Never married (%)
Marital status - Now married (%)
Marital status - Separated (%)
Marital status - Widowed (%)
Marital status - Divorced (%)
Ancestries Reported - Arab (%)
Ancestries Reported - Czech (%)
Ancestries Reported - Danish (%)
Ancestries Reported - Dutch (%)
Ancestries Reported - English (%)
Ancestries Reported - French (%)
Ancestries Reported - French Canadian (%)
Ancestries Reported - German (%)
Ancestries Reported - Greek (%)
Ancestries Reported - Hungarian (%)
Ancestries Reported - Irish (%)
Ancestries Reported - Italian (%)
Ancestries Reported - Lithuanian (%)
Ancestries Reported - Norwegian (%)
Ancestries Reported - Polish (%)
Ancestries Reported - Portuguese (%)
Ancestries Reported - Russian (%)
Ancestries Reported - Scotch-Irish (%)
Ancestries Reported - Scottish (%)
Ancestries Reported - Slovak (%)
Ancestries Reported - Subsaharan African (%)
Ancestries Reported - Swedish (%)
Ancestries Reported - Swiss (%)
Ancestries Reported - Ukrainian (%)
Ancestries Reported - United States (%)
Ancestries Reported - Welsh (%)
Ancestries Reported - West Indian (%)
Ancestries Reported - Other (%)
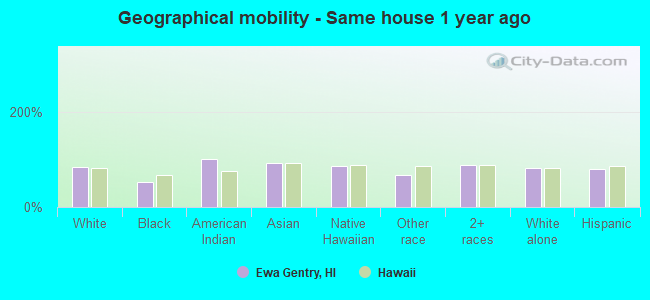
Geographical mobility - Same house 1 year ago (%)
Geographical mobility - Same house 1 year ago (%) - White
Geographical mobility - Same house 1 year ago (%) - Black or African American
Geographical mobility - Same house 1 year ago (%) - Asian
Geographical mobility - Same house 1 year ago (%) - Hispanic or Latino
Geographical mobility - Same house 1 year ago (%) - American Indian and Alaska Native
Geographical mobility - Same house 1 year ago (%) - Multirace
Geographical mobility - Same house 1 year ago (%) - Other Race
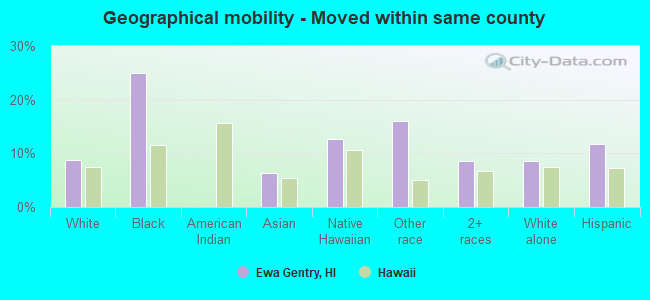
Geographical mobility - Moved within same county (%)
Geographical mobility - Moved within same county (%) - White
Geographical mobility - Moved within same county (%) - Black or African American
Geographical mobility - Moved within same county (%) - Asian
Geographical mobility - Moved within same county (%) - Hispanic or Latino
Geographical mobility - Moved within same county (%) - American Indian and Alaska Native
Geographical mobility - Moved within same county (%) - Multirace
Geographical mobility - Moved within same county (%) - Other Race
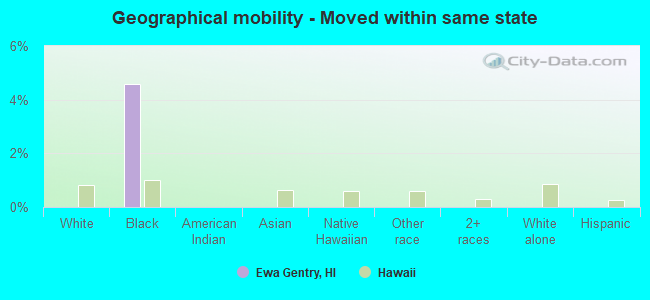
Geographical mobility - Moved from different county within same state (%)
Geographical mobility - Moved from different county within same state (%) - White
Geographical mobility - Moved from different county within same state (%) - Black or African American
Geographical mobility - Moved from different county within same state (%) - Asian
Geographical mobility - Moved from different county within same state (%) - Hispanic or Latino
Geographical mobility - Moved from different county within same state (%) - American Indian and Alaska Native
Geographical mobility - Moved from different county within same state (%) - Multirace
Geographical mobility - Moved from different county within same state (%) - Other Race
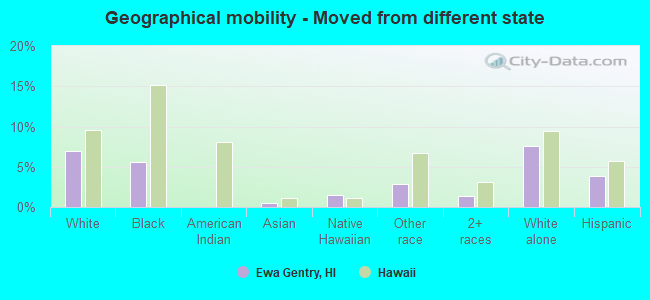
Geographical mobility - Moved from different state (%)
Geographical mobility - Moved from different state (%) - White
Geographical mobility - Moved from different state (%) - Black or African American
Geographical mobility - Moved from different state (%) - Asian
Geographical mobility - Moved from different state (%) - Hispanic or Latino
Geographical mobility - Moved from different state (%) - American Indian and Alaska Native
Geographical mobility - Moved from different state (%) - Multirace
Geographical mobility - Moved from different state (%) - Other Race
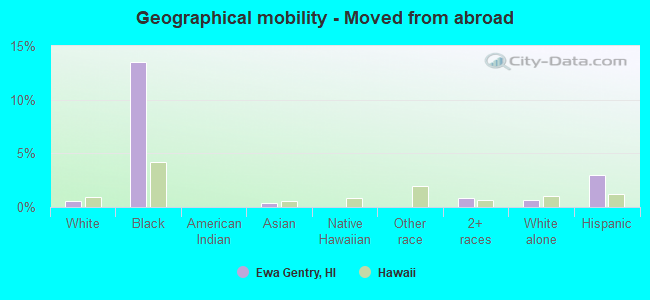
Geographical mobility - Moved from abroad (%)
Geographical mobility - Moved from abroad (%) - White
Geographical mobility - Moved from abroad (%) - Black or African American
Geographical mobility - Moved from abroad (%) - Asian
Geographical mobility - Moved from abroad (%) - Hispanic or Latino
Geographical mobility - Moved from abroad (%) - American Indian and Alaska Native
Geographical mobility - Moved from abroad (%) - Multirace
Geographical mobility - Moved from abroad (%) - Other Race
Place of birth for the foreign-born population - Ireland (%)
Place of birth for the foreign-born population - Denmark (%)
Place of birth for the foreign-born population - Norway (%)
Place of birth for the foreign-born population - Sweden (%)
Place of birth for the foreign-born population - United Kingdom (%)
Place of birth for the foreign-born population - England (%)
Place of birth for the foreign-born population - Scotland (%)
Place of birth for the foreign-born population - Other Northern Europe (%)
Place of birth for the foreign-born population - Austria (%)
Place of birth for the foreign-born population - Belgium (%)
Place of birth for the foreign-born population - France (%)
Place of birth for the foreign-born population - Germany (%)
Place of birth for the foreign-born population - Netherlands (%)
Place of birth for the foreign-born population - Switzerland (%)
Place of birth for the foreign-born population - Other Western Europe (%)
Place of birth for the foreign-born population - Greece (%)
Place of birth for the foreign-born population - Italy (%)
Place of birth for the foreign-born population - Portugal (%)
Place of birth for the foreign-born population - Spain (%)
Place of birth for the foreign-born population - Other Southern Europe (%)
Place of birth for the foreign-born population - Albania (%)
Place of birth for the foreign-born population - Belarus (%)
Place of birth for the foreign-born population - Bosnia and Herzegovina (%)
Place of birth for the foreign-born population - Bulgaria (%)
Place of birth for the foreign-born population - Croatia (%)
Place of birth for the foreign-born population - Czechoslovakia (%)
Place of birth for the foreign-born population - Hungary (%)
Place of birth for the foreign-born population - Latvia (%)
Place of birth for the foreign-born population - Lithuania (%)
Place of birth for the foreign-born population - North Macedonia (Macedonia) (%)
Place of birth for the foreign-born population - Moldova (%)
Place of birth for the foreign-born population - Poland (%)
Place of birth for the foreign-born population - Romania (%)
Place of birth for the foreign-born population - Russia (%)
Place of birth for the foreign-born population - Serbia (%)
Place of birth for the foreign-born population - Ukraine (%)
Place of birth for the foreign-born population - Other Eastern Europe (%)
Place of birth for the foreign-born population - China (%)
Place of birth for the foreign-born population - Hong Kong (%)
Place of birth for the foreign-born population - Taiwan (%)
Place of birth for the foreign-born population - Japan (%)
Place of birth for the foreign-born population - Korea (%)
Place of birth for the foreign-born population - Other Eastern Asia (%)
Place of birth for the foreign-born population - Afghanistan (%)
Place of birth for the foreign-born population - Bangladesh (%)
Place of birth for the foreign-born population - India (%)
Place of birth for the foreign-born population - Iran (%)
Place of birth for the foreign-born population - Kazakhstan (%)
Place of birth for the foreign-born population - Nepal (%)
Place of birth for the foreign-born population - Pakistan (%)
Place of birth for the foreign-born population - Sri Lanka (%)
Place of birth for the foreign-born population - Uzbekistan (%)
Place of birth for the foreign-born population - Other South Central Asia (%)
Place of birth for the foreign-born population - Burma (%)
Place of birth for the foreign-born population - Cambodia (%)
Place of birth for the foreign-born population - Indonesia (%)
Place of birth for the foreign-born population - Laos (%)
Place of birth for the foreign-born population - Malaysia (%)
Place of birth for the foreign-born population - Philippines (%)
Place of birth for the foreign-born population - Singapore (%)
Place of birth for the foreign-born population - Thailand (%)
Place of birth for the foreign-born population - Vietnam (%)
Place of birth for the foreign-born population - Other South Eastern Asia (%)
Place of birth for the foreign-born population - Armenia (%)
Place of birth for the foreign-born population - Iraq (%)
Place of birth for the foreign-born population - Israel (%)
Place of birth for the foreign-born population - Jordan (%)
Place of birth for the foreign-born population - Kuwait (%)
Place of birth for the foreign-born population - Lebanon (%)
Place of birth for the foreign-born population - Saudi Arabia (%)
Place of birth for the foreign-born population - Syria (%)
Place of birth for the foreign-born population - Turkey (%)
Place of birth for the foreign-born population - Yemen (%)
Place of birth for the foreign-born population - Other Western Asia (%)
Place of birth for the foreign-born population - Eritrea (%)
Place of birth for the foreign-born population - Ethiopia (%)
Place of birth for the foreign-born population - Kenya (%)
Place of birth for the foreign-born population - Somalia (%)
Place of birth for the foreign-born population - Uganda (%)
Place of birth for the foreign-born population - Zimbabwe (%)
Place of birth for the foreign-born population - Other Eastern Africa (%)
Place of birth for the foreign-born population - Cameroon (%)
Place of birth for the foreign-born population - Congo (%)
Place of birth for the foreign-born population - Democratic Republic of Congo (Zaire) (%)
Place of birth for the foreign-born population - Other Middle Africa (%)
Place of birth for the foreign-born population - Egypt (%)
Place of birth for the foreign-born population - Morocco (%)
Place of birth for the foreign-born population - Sudan (%)
Place of birth for the foreign-born population - Other Northern Africa (%)
Place of birth for the foreign-born population - South Africa (%)
Place of birth for the foreign-born population - Other Southern Africa (%)
Place of birth for the foreign-born population - Cabo Verde (%)
Place of birth for the foreign-born population - Ghana (%)
Place of birth for the foreign-born population - Liberia (%)
Place of birth for the foreign-born population - Nigeria (%)
Place of birth for the foreign-born population - Senegal (%)
Place of birth for the foreign-born population - Sierra Leone (%)
Place of birth for the foreign-born population - Other Western Africa (%)
Place of birth for the foreign-born population - Australia (%)
Place of birth for the foreign-born population - New Zealand (%)
Place of birth for the foreign-born population - Fiji (%)
Place of birth for the foreign-born population - Micronesia (%)
Place of birth for the foreign-born population - Bahamas (%)
Place of birth for the foreign-born population - Barbados (%)
Place of birth for the foreign-born population - Cuba (%)
Place of birth for the foreign-born population - Dominica (%)
Place of birth for the foreign-born population - Dominican Republic (%)
Place of birth for the foreign-born population - Grenada (%)
Place of birth for the foreign-born population - Haiti (%)
Place of birth for the foreign-born population - Jamaica (%)
Place of birth for the foreign-born population - St. Vincent and the Grenadines (%)
Place of birth for the foreign-born population - Trinidad and Tobago (%)
Place of birth for the foreign-born population - West Indies (%)
Place of birth for the foreign-born population - Other Caribbean (%)
Place of birth for the foreign-born population - Belize (%)
Place of birth for the foreign-born population - Costa Rica (%)
Place of birth for the foreign-born population - El Salvador (%)
Place of birth for the foreign-born population - Guatemala (%)
Place of birth for the foreign-born population - Honduras (%)
Place of birth for the foreign-born population - Mexico (%)
Place of birth for the foreign-born population - Nicaragua (%)
Place of birth for the foreign-born population - Panama (%)
Place of birth for the foreign-born population - Other Central America (%)
Place of birth for the foreign-born population - Argentina (%)
Place of birth for the foreign-born population - Bolivia (%)
Place of birth for the foreign-born population - Brazil (%)
Place of birth for the foreign-born population - Chile (%)
Place of birth for the foreign-born population - Colombia (%)
Place of birth for the foreign-born population - Ecuador (%)
Place of birth for the foreign-born population - Guyana (%)
Place of birth for the foreign-born population - Peru (%)
Place of birth for the foreign-born population - Uruguay (%)
Place of birth for the foreign-born population - Venezuela (%)
Place of birth for the foreign-born population - Other South America (%)
Place of birth for the foreign-born population - Canada (%)
Place of birth for the foreign-born population - Other Northern America (%)
Place of birth for the foreign-born population - Other (%)
According to 2022 data, the most numerous races in Ewa Gentry, HI are Asian alone (12,139 residents), Two or more races (6,170 residents), and White alone (2,171 residents). 75.8% of Ewa Gentry residents speak English at home. 20.1% of Ewa Gentry, HI residents are foreign-born (18.3% born in Asia), which is 10.6% greater than the foreign-born rate of 18.0% across the entire state of Hawaii.
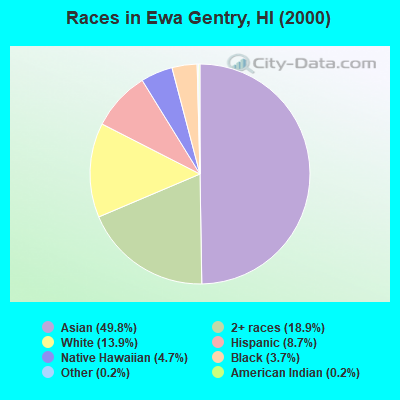
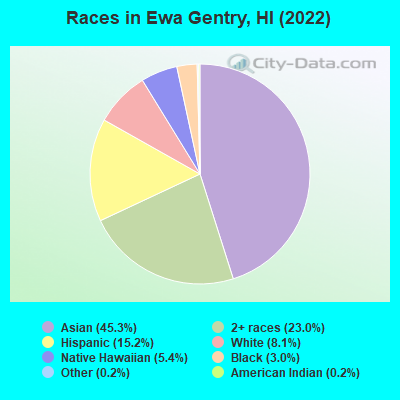
Race distribution in Ewa Gentry
2000 2022
494,149 40.8% Asian alone 277,091 22.9% White alone 218,700 18.1% Two or more races 108,441 9.0% Native Hawaiian and Other 87,699 7.2% Hispanic 20,829 1.7% Black alone 2,089 0.2% Other race alone 2,539 0.2% American Indian alone
498,125 34.6% Asian alone 318,574 22.1% Two or more races 297,937 20.7% White alone 160,103 11.1% Hispanic 134,567 9.3% Native Hawaiian and Other 23,682 1.6% Black alone 5,378 0.4% Other race alone 1,830 0.1% American Indian alone
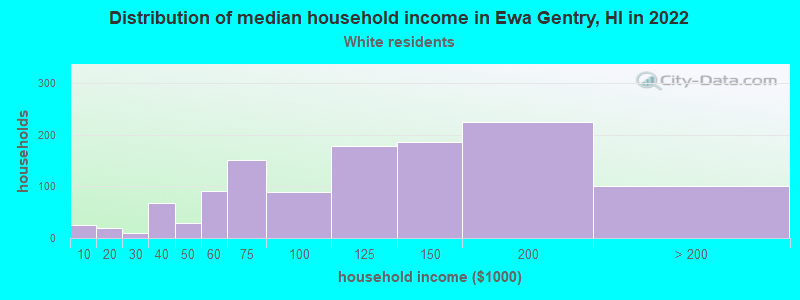
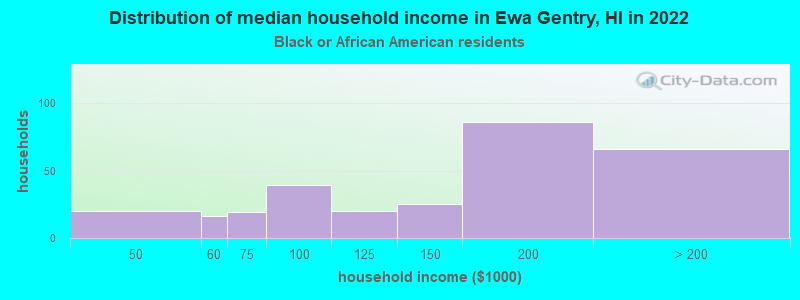
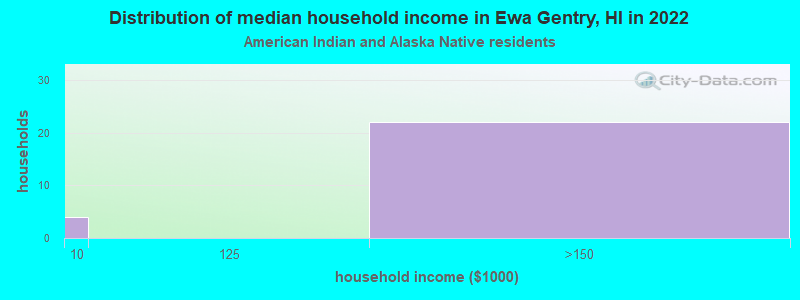
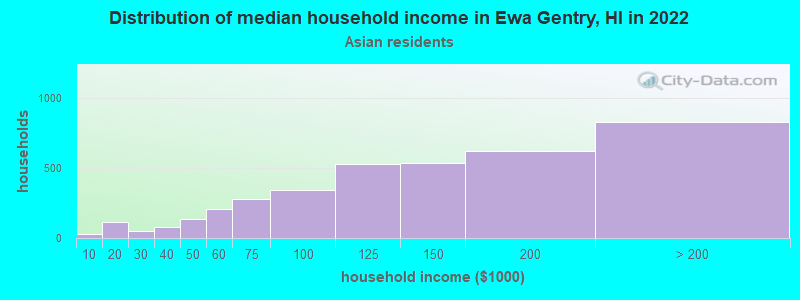
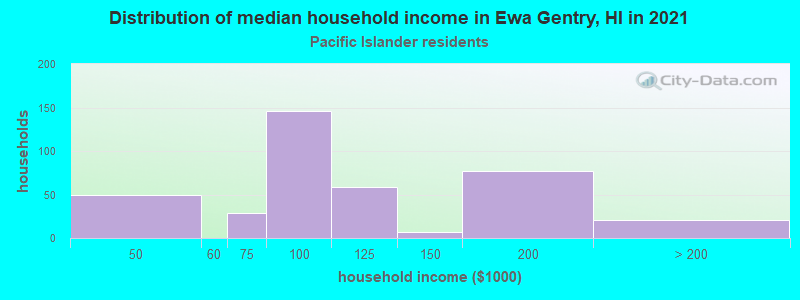
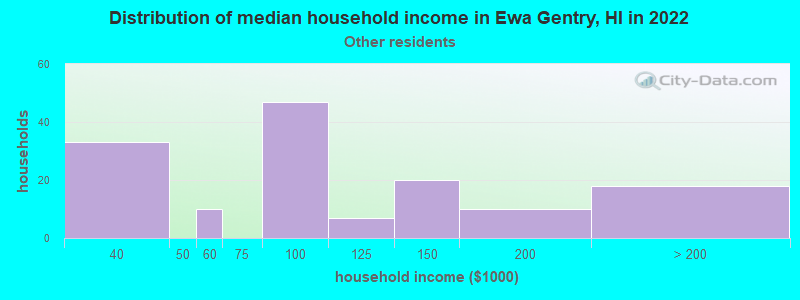
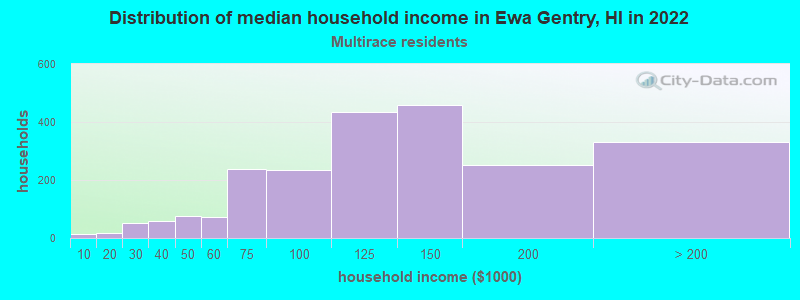
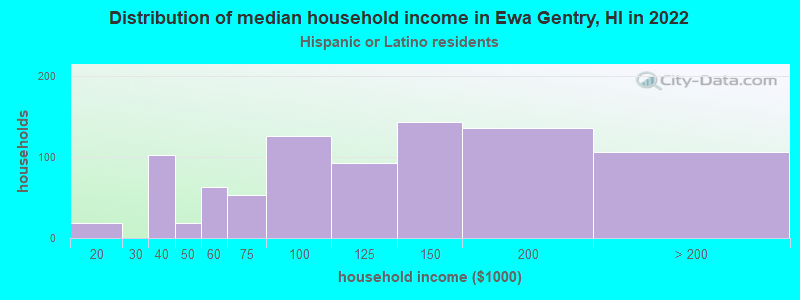
Income and house value in Ewa Gentry Median household income in 2022 $110,122 White non-Hispanic householders$149,548 Black householders$132,525 Asian householders$72,049 Native Hawaiian and other Pacific Islander householders$86,056 Some other race householders$119,197 Two or more races householders$116,767 Hispanic or Latino race householdersMedian 2022 house value $977,924 White Non-Hispanic householdersover $1,000,000 Black or African American householders $993,204 Asian householders$897,594 Native Hawaiian and other Pacific Islander householdersover $1,000,000 Two or more races householdersover $1,000,000 Hispanic or Latino householders
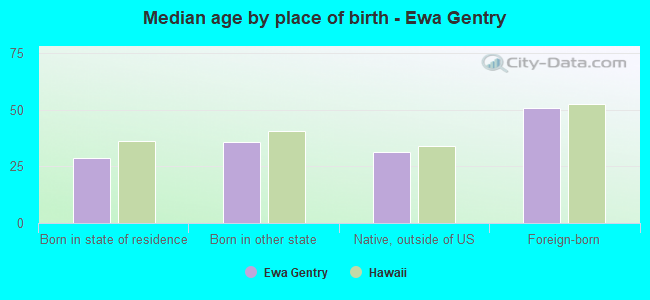
Median age by race in Ewa Gentry
39.0 Median age for White residents38.6 39.4 38.7 Median age for Black or African American residents39.0 41.7 31.9 Median age for American Indian / Alaska Native residents63.8 28.6 38.6 Median age for Asian residents39.2 38.1 28.7 Median age for Native Hawaiian / Pacific Islander residents27.0 30.6 31.8 Median age for Other race residents32.1 35.9 27.0 Median age for Two or more races residents25.5 28.1 42.4 Median age for White alone residents39.0 47.0 23.8 Median age for Hispanic or Latino residents23.6 24.3
Owner/renter occupied households by race in Ewa Gentry
House owners and renters - White residents 882 72.8% Owner occupied330 27.2% Renter occupiedHouse owners and renters - Black or African American residents 257 69.7% Owner occupied112 30.3% Renter occupiedHouse owners and renters - American Indian / Alaska Native residents 21 100.0% Owner occupiedHouse owners and renters - Asian residents 3,261 85.6% Owner occupied547 14.4% Renter occupiedHouse owners and renters - Native Hawaiian / Pacific Islander residents 162 52.4% Owner occupied147 47.6% Renter occupiedHouse owners and renters - Other race residents 92 62.0% Owner occupied56 38.0% Renter occupiedHouse owners and renters - Two or more races residents 1,581 70.4% Owner occupied666 29.6% Renter occupiedHouse owners and renters - White alone residents 748 74.7% Owner occupied253 25.3% Renter occupiedHouse owners and renters - Hispanic or Latino residents 566 65.8% Owner occupied294 34.2% Renter occupied
Language usage in Ewa Gentry
English speakers - Total 75.8% of residents of Ewa Gentry speak English at home.
2.1% of residents speak Spanish at home 471 89.4% Speak English very well56 10.6% Speak English less than very well22.1% of residents speak other language at home 2,931 53.9% Speak English very well2,507 46.1% Speak English less than very well
English speakers - Born in the United States 93.0% of residents of Ewa Gentry speak English at home.
4.5% of residents speak Spanish at home 236 96.7% Speak English very well8 3.3% Speak English less than very well2.9% of residents speak other language at home 155 100.0% Speak English very well
English speakers - Native, born elsewhere 79.6% of residents of Ewa Gentry speak English at home.
0.5% of residents speak Spanish at home 7 100.0% Speak English very well21.9% of residents speak other language at home 224 70.7% Speak English very well93 29.3% Speak English less than very well
English speakers - Foreign-born 16.1% of residents of Ewa Gentry speak English at home.
3.2% of residents speak Spanish at home 121 75.6% Speak English very well39 24.4% Speak English less than very well80.5% of residents speak other language at home 1,718 42.0% Speak English very well2,368 58.0% Speak English less than very well
White (Caucasian) - Speak only English Native:
96.7% (2,153)Foreign-born:
35.2% (37)
White (Caucasian) - Speak another language Native:
3.7% (83)Foreign-born:
62.0% (66)
American Indian / Alaska Native - Speak another language Native:
27.1% (9)Foreign-born:
100.0% (33)
Asian - Speak only English Native:
91.5% (6,492)Foreign-born:
15.3% (689)
Asian - Speak another language Native:
8.8% (627)Foreign-born:
84.7% (3,827)
Native Hawaiian / Pacific Islander - Speak only English Native:
86.9% (1,139)Foreign-born:
15.6% (15)
Native Hawaiian / Pacific Islander - Speak another language Native:
13.8% (181)Foreign-born:
84.2% (83)
Other race - Speak another language Native:
32.3% (182)Foreign-born:
98.0% (163)
Two or more races - Speak only English Native:
90.4% (7,034)Foreign-born:
35.4% (62)
Two or more races - Speak another language Native:
9.5% (743)Foreign-born:
64.7% (113)
White alone - Speak only English Native:
96.6% (1,938)Foreign-born:
47.5% (38)
White alone - Speak another language Native:
3.5% (70)Foreign-born:
52.4% (42)
Hispanic or Latino - Speak only English Native:
84.9% (2,516)Foreign-born:
4.4% (12)
Hispanic or Latino - Speak another language Native:
15.2% (449)Foreign-born:
92.2% (244)
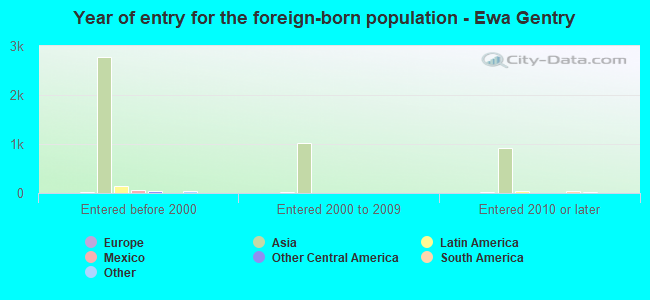
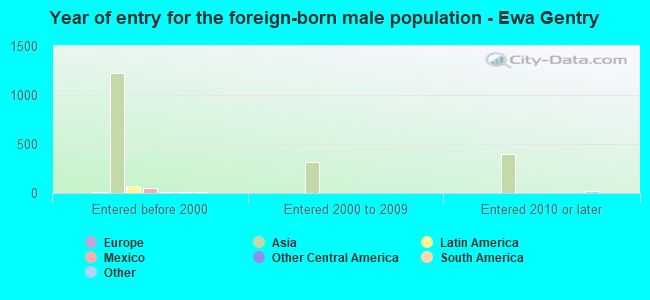
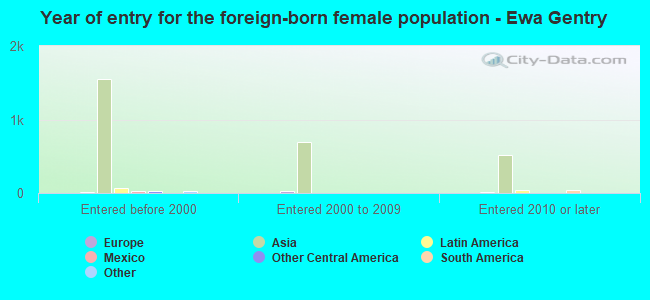
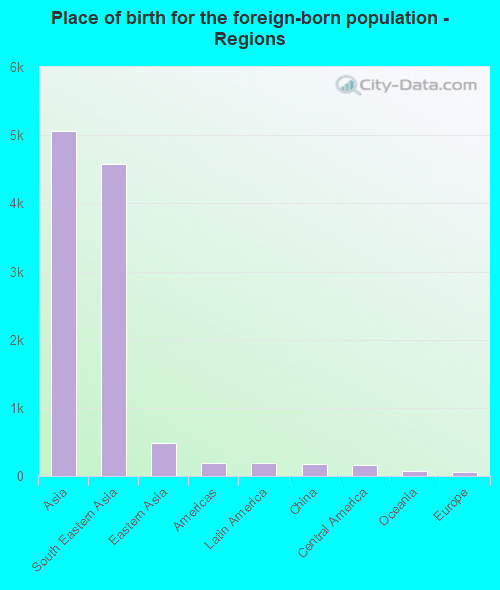
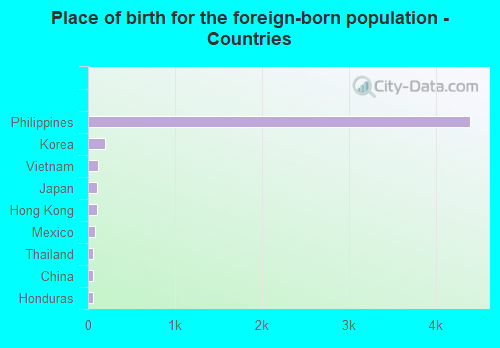
Foreign-born residents in Ewa Gentry 5,400 residents are foreign born (18.3% Asia ).
This city:
20.1%Hawaii:
18.0%
Marital status for residents in Ewa Gentry Marital status - White (Caucasian) population 15 years and over
Males 27.1% Never married60.6% Now married1.2% Separated2.0% Widowed9.2% DivorcedFemales 21.7% Never married51.5% Now married3.9% Separated6.5% Widowed16.5% DivorcedWomen who gave birth in the past 12 months Now married:
100.0% (27)Unmarried:
0.0% (0)
Women who did not give birth in the past 12 months Now married:
61.2% (365)Unmarried:
38.8% (231)
Marital status - Black or African American population 15 years and over
Males 5.4% Never married89.1% Now married0.0% Separated0.0% Widowed5.4% DivorcedFemales 37.7% Never married56.7% Now married0.0% Separated0.0% Widowed5.6% DivorcedWomen who gave birth in the past 12 months Now married:
0.0% (0)Unmarried:
100.0% (10)
Women who did not give birth in the past 12 months Now married:
38.5% (88)Unmarried:
61.5% (141)
Marital status - American Indian / Alaska Native population 15 years and over
Males 14.3% Never married85.7% Now married0.0% Separated0.0% Widowed0.0% DivorcedFemales 100.0% Never married0.0% Now married0.0% Separated0.0% Widowed0.0% DivorcedWomen who did not give birth in the past 12 months Now married:
0.0% (0)Unmarried:
100.0% (25)
Marital status - Asian population 15 years and over
Males 33.9% Never married54.8% Now married0.6% Separated1.1% Widowed9.6% DivorcedFemales 27.5% Never married53.0% Now married2.9% Separated7.9% Widowed8.6% DivorcedWomen who gave birth in the past 12 months Now married:
68.1% (104)Unmarried:
31.9% (48)
Women who did not give birth in the past 12 months Now married:
52.3% (1,690)Unmarried:
47.7% (1,543)
Marital status - Native Hawaiian / Pacific Islander population 15 years and over
Males 40.6% Never married49.8% Now married2.4% Separated0.0% Widowed7.1% DivorcedFemales 33.8% Never married49.3% Now married13.2% Separated3.7% Widowed0.0% DivorcedWomen who did not give birth in the past 12 months Now married:
58.2% (202)Unmarried:
41.8% (145)
Marital status - Other race population 15 years and over
Males 16.5% Never married38.0% Now married8.2% Separated0.0% Widowed37.2% DivorcedFemales 22.7% Never married77.3% Now married0.0% Separated0.0% Widowed0.0% DivorcedWomen who gave birth in the past 12 months Now married:
100.0% (71)Unmarried:
0.0% (0)
Women who did not give birth in the past 12 months Now married:
91.2% (116)Unmarried:
8.8% (11)
Marital status - Two or more races population 15 years and over
Males 41.6% Never married45.1% Now married0.0% Separated2.7% Widowed10.6% DivorcedFemales 43.2% Never married39.6% Now married1.3% Separated2.6% Widowed13.3% DivorcedWomen who gave birth in the past 12 months Now married:
65.7% (122)Unmarried:
34.3% (64)
Women who did not give birth in the past 12 months Now married:
34.7% (706)Unmarried:
65.3% (1,328)
Marital status - White alone, not Hispanic / Latino population 15 years and over
Males 25.3% Never married61.6% Now married0.0% Separated2.4% Widowed10.8% DivorcedFemales 22.7% Never married47.8% Now married4.3% Separated7.1% Widowed18.0% DivorcedWomen who gave birth in the past 12 months Now married:
100.0% (28)Unmarried:
0.0% (0)
Women who did not give birth in the past 12 months Now married:
55.6% (285)Unmarried:
44.4% (227)
Marital status - Hispanic or Latino population 15 years and over
Males 44.4% Never married40.1% Now married3.0% Separated1.6% Widowed10.9% DivorcedFemales 38.7% Never married55.6% Now married1.4% Separated1.1% Widowed3.3% DivorcedWomen who gave birth in the past 12 months Now married:
84.7% (127)Unmarried:
15.3% (23)
Women who did not give birth in the past 12 months Now married:
48.0% (368)Unmarried:
52.0% (399)
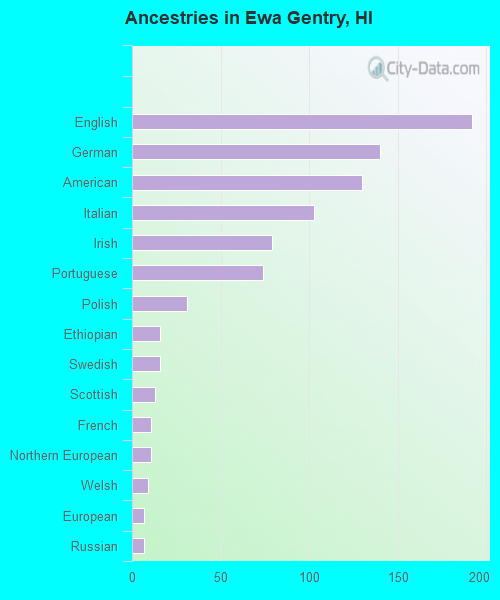
Ancestries in Ewa Gentry
192 1.6% English140 1.2% German130 1.1% American103 0.8% Italian79 0.7% Irish74 0.6% Portuguese31 0.3% Polish16 0.1% Ethiopian16 0.1% Swedish13 0.1% Scottish11 0.09% French11 0.09% Northern European9 0.07% Welsh7 0.06% European7 0.06% Russian
Geographical mobility in Ewa Gentry Same house 1 year ago 2,005 83.0% White (Caucasian)461 53.4% Black or African American54 100.0% American Indian / Alaska Native11,352 92.6% Asian1,335 85.8% Native Hawaiian / Pacific Islander486 67.3% Other race7,772 88.9% Two or more races1,762 82.5% White alone, not Hispanic / Latino2,994 79.8% Hispanic or LatinoMoved within same county 211 8.7% White / Caucasian215 24.9% Black or African American788 6.4% Asian197 12.6% Native Hawaiian / Pacific Islander116 16.0% Other race750 8.6% Two or more races184 8.6% White alone, not Hispanic / Latino438 11.7% Hispanic or LatinoMoved within same state 39 4.6% Black or African American2 0.0% AsianMoved from different state 168 7.0% White / Caucasian49 5.6% Black or African American60 0.5% Asian24 1.5% Native Hawaiian / Pacific Islander21 2.9% Other race115 1.3% Two or more races161 7.5% White alone, not Hispanic / Latino143 3.8% Hispanic or LatinoMoved from abroad 13 0.5% White117 13.5% Black or African American43 0.4% Asian74 0.8% Two or more races13 0.6% White alone, not Hispanic / Latino112 3.0% Hispanic or Latino
Children Nativity (place of birth) in Ewa Gentry
Children under 6 years - Living with two parents Both parents native 893 100.0% NativeBoth parents foreign-born 257 100.0% NativeOne native, one foreign-born parent 269 100.0% NativeChildren under 6 years - Living with one parent Native parent 651 100.0% NativeForeign-born parent 154 100.0% NativeChildren 6 to 17 years - Living with two parents Both parents native 1,679 100.0% NativeBoth parents foreign-born 403 66.7% Native201 33.3% Foreign-bornOne native, one foreign-born parent 436 98.5% Native7 1.5% Foreign-bornChildren 6 to 17 years - Living with one parent Native parent 1,091 100.0% NativeForeign-born parent 366 49.2% Native378 50.8% Foreign-born
Grandparents responsible for own grandchildren in Ewa Gentry
Grandparents (30 to 59 years) White / Caucasian 27 100.0% Responsible for grandchildrenAsian 15 7.9% Responsible for grandchildren171 92.1% Not responsible for grandchildrenTwo or more races 30 27.7% Responsible for grandchildren79 72.3% Not responsible for grandchildrenWhite alone, not Hispanic / Latino 19 100.0% Responsible for grandchildrenHispanic or Latino 16 45.5% Responsible for grandchildren19 54.5% Not responsible for grandchildrenGrandparents (60 years and over) White / Caucasian 37 100.0% Not responsible for grandchildrenAsian 53 10.4% Responsible for grandchildren453 89.6% Not responsible for grandchildrenTwo or more races 38 100.0% Not responsible for grandchildrenWhite alone, not Hispanic / Latino 36 100.0% Not responsible for grandchildrenHispanic or Latino 39 100.0% Not responsible for grandchildren