Races in Fairview, New Jersey (NJ) Detailed Stats
Data:
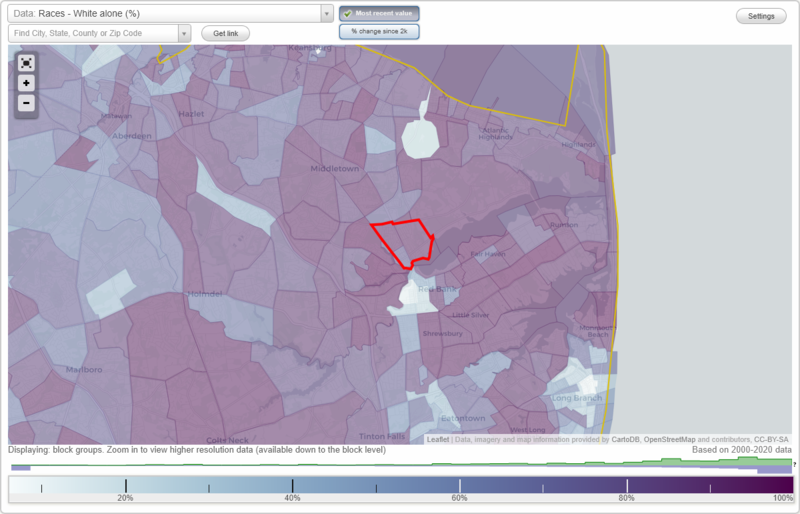
Races - White alone (%)
Races - White alone (% change since 2000)
Races - Black alone (%)
Races - Black alone (% change since 2000)
Races - American Indian alone (%)
Races - American Indian alone (% change since 2000)
Races - Asian alone (%)
Races - Asian alone (% change since 2000)
Races - Hispanic (%)
Races - Hispanic (% change since 2000)
Races - Native Hawaiian and Other Pacific Islander alone (%)
Races - Native Hawaiian and Other Pacific Islander alone (% change since 2000)
Races - Two or more races(%)
Races - Two or more races(% change since 2000)
Races - Other race alone (%)
Races - Other race alone (% change since 2000)
Racial diversity
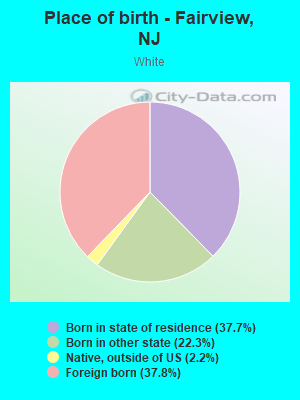
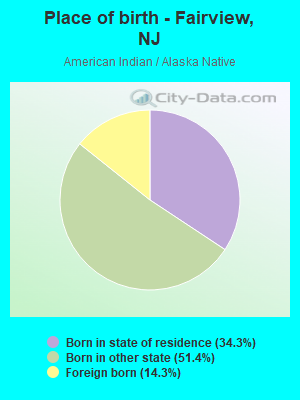
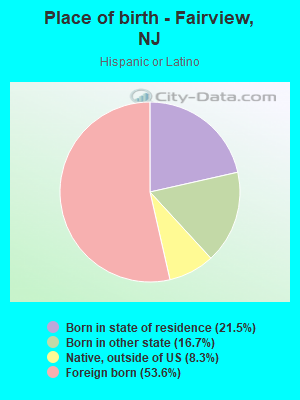
Place of birth - Born in state of residence (%)
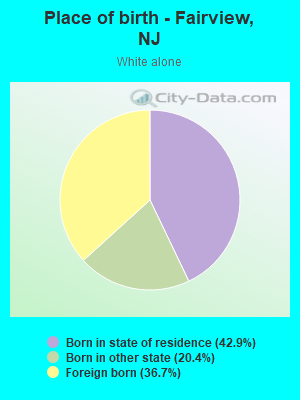
Place of birth - Born in state of residence (%) - White
Place of birth - Born in state of residence (%) - Black or African American
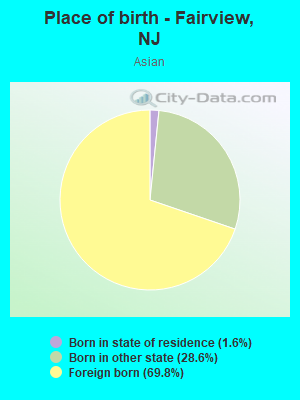
Place of birth - Born in state of residence (%) - Asian
Place of birth - Born in state of residence (%) - Hispanic or Latino
Place of birth - Born in state of residence (%) - American Indian and Alaska Native
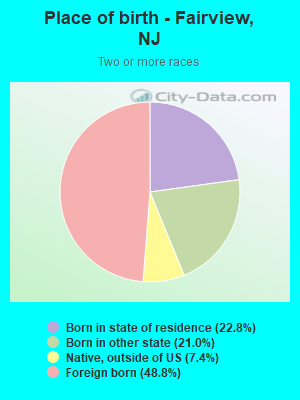
Place of birth - Born in state of residence (%) - Multirace
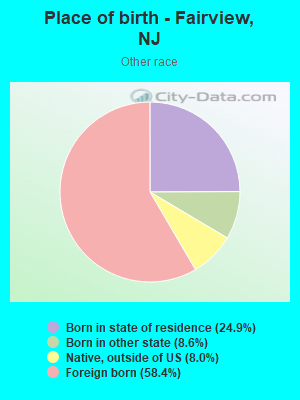
Place of birth - Born in state of residence (%) - Other Race
Place of birth - Born in other state (%)
Place of birth - Born in other state (%) - White
Place of birth - Born in other state (%) - Black or African American
Place of birth - Born in other state (%) - Asian
Place of birth - Born in other state (%) - Hispanic or Latino
Place of birth - Born in other state (%) - American Indian and Alaska Native
Place of birth - Born in other state (%) - Multirace
Place of birth - Born in other state (%) - Other Race
Place of birth - Native, outside of US (%)
Place of birth - Native, outside of US (%) - White
Place of birth - Native, outside of US (%) - Black or African American
Place of birth - Native, outside of US (%) - Asian
Place of birth - Native, outside of US (%) - Hispanic or Latino
Place of birth - Native, outside of US (%) - American Indian and Alaska Native
Place of birth - Native, outside of US (%) - Multirace
Place of birth - Native, outside of US (%) - Other Race
Place of birth - Foreign born (%)
Place of birth - Foreign born (%) - White
Place of birth - Foreign born (%) - Black or African American
Place of birth - Foreign born (%) - Asian
Place of birth - Foreign born (%) - Hispanic or Latino
Place of birth - Foreign born (%) - American Indian and Alaska Native
Place of birth - Foreign born (%) - Multirace
Place of birth - Foreign born (%) - Other Race
Residents speaking English at home (%)
Residents speaking English at home - Born in the United States (%)
Residents speaking English at home - Native, born elsewhere (%)
Residents speaking English at home - Foreign born (%)
Residents speaking Spanish at home (%)
Residents speaking Spanish at home - Born in the United States (%)
Residents speaking Spanish at home - Native, born elsewhere (%)
Residents speaking Spanish at home - Foreign born (%)
Residents speaking other language at home (%)
Residents speaking other language at home - Born in the United States (%)
Residents speaking other language at home - Native, born elsewhere (%)
Residents speaking other language at home - Foreign born (%)
Marital status - Never married (%)
Marital status - Now married (%)
Marital status - Separated (%)
Marital status - Widowed (%)
Marital status - Divorced (%)
Ancestries Reported - Arab (%)
Ancestries Reported - Czech (%)
Ancestries Reported - Danish (%)
Ancestries Reported - Dutch (%)
Ancestries Reported - English (%)
Ancestries Reported - French (%)
Ancestries Reported - French Canadian (%)
Ancestries Reported - German (%)
Ancestries Reported - Greek (%)
Ancestries Reported - Hungarian (%)
Ancestries Reported - Irish (%)
Ancestries Reported - Italian (%)
Ancestries Reported - Lithuanian (%)
Ancestries Reported - Norwegian (%)
Ancestries Reported - Polish (%)
Ancestries Reported - Portuguese (%)
Ancestries Reported - Russian (%)
Ancestries Reported - Scotch-Irish (%)
Ancestries Reported - Scottish (%)
Ancestries Reported - Slovak (%)
Ancestries Reported - Subsaharan African (%)
Ancestries Reported - Swedish (%)
Ancestries Reported - Swiss (%)
Ancestries Reported - Ukrainian (%)
Ancestries Reported - United States (%)
Ancestries Reported - Welsh (%)
Ancestries Reported - West Indian (%)
Ancestries Reported - Other (%)
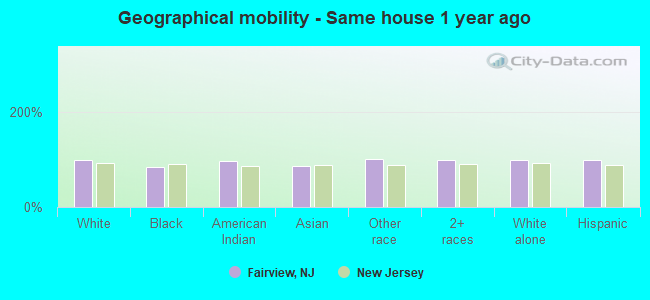
Geographical mobility - Same house 1 year ago (%)
Geographical mobility - Same house 1 year ago (%) - White
Geographical mobility - Same house 1 year ago (%) - Black or African American
Geographical mobility - Same house 1 year ago (%) - Asian
Geographical mobility - Same house 1 year ago (%) - Hispanic or Latino
Geographical mobility - Same house 1 year ago (%) - American Indian and Alaska Native
Geographical mobility - Same house 1 year ago (%) - Multirace
Geographical mobility - Same house 1 year ago (%) - Other Race
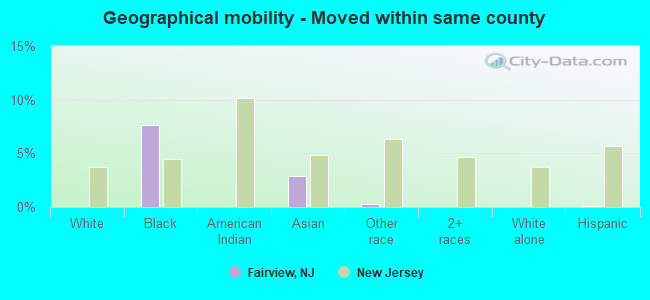
Geographical mobility - Moved within same county (%)
Geographical mobility - Moved within same county (%) - White
Geographical mobility - Moved within same county (%) - Black or African American
Geographical mobility - Moved within same county (%) - Asian
Geographical mobility - Moved within same county (%) - Hispanic or Latino
Geographical mobility - Moved within same county (%) - American Indian and Alaska Native
Geographical mobility - Moved within same county (%) - Multirace
Geographical mobility - Moved within same county (%) - Other Race
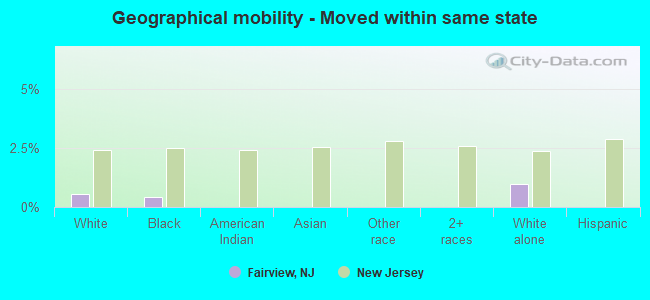
Geographical mobility - Moved from different county within same state (%)
Geographical mobility - Moved from different county within same state (%) - White
Geographical mobility - Moved from different county within same state (%) - Black or African American
Geographical mobility - Moved from different county within same state (%) - Asian
Geographical mobility - Moved from different county within same state (%) - Hispanic or Latino
Geographical mobility - Moved from different county within same state (%) - American Indian and Alaska Native
Geographical mobility - Moved from different county within same state (%) - Multirace
Geographical mobility - Moved from different county within same state (%) - Other Race
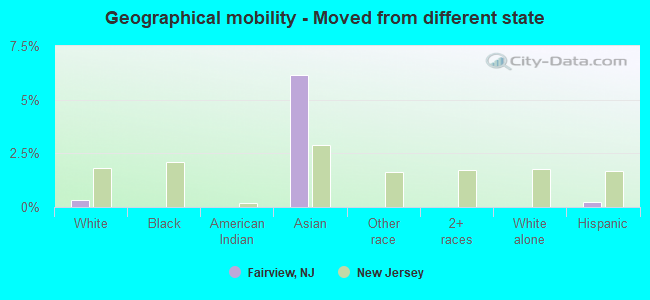
Geographical mobility - Moved from different state (%)
Geographical mobility - Moved from different state (%) - White
Geographical mobility - Moved from different state (%) - Black or African American
Geographical mobility - Moved from different state (%) - Asian
Geographical mobility - Moved from different state (%) - Hispanic or Latino
Geographical mobility - Moved from different state (%) - American Indian and Alaska Native
Geographical mobility - Moved from different state (%) - Multirace
Geographical mobility - Moved from different state (%) - Other Race
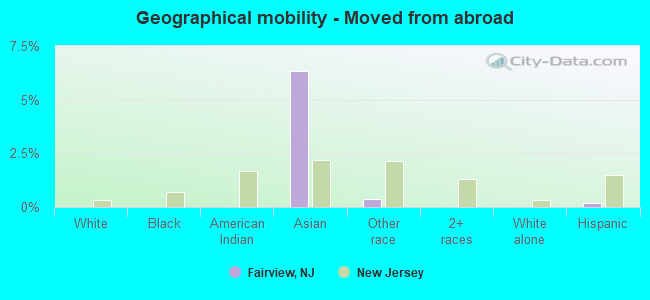
Geographical mobility - Moved from abroad (%)
Geographical mobility - Moved from abroad (%) - White
Geographical mobility - Moved from abroad (%) - Black or African American
Geographical mobility - Moved from abroad (%) - Asian
Geographical mobility - Moved from abroad (%) - Hispanic or Latino
Geographical mobility - Moved from abroad (%) - American Indian and Alaska Native
Geographical mobility - Moved from abroad (%) - Multirace
Geographical mobility - Moved from abroad (%) - Other Race
Place of birth for the foreign-born population - Ireland (%)
Place of birth for the foreign-born population - Denmark (%)
Place of birth for the foreign-born population - Norway (%)
Place of birth for the foreign-born population - Sweden (%)
Place of birth for the foreign-born population - United Kingdom (%)
Place of birth for the foreign-born population - England (%)
Place of birth for the foreign-born population - Scotland (%)
Place of birth for the foreign-born population - Other Northern Europe (%)
Place of birth for the foreign-born population - Austria (%)
Place of birth for the foreign-born population - Belgium (%)
Place of birth for the foreign-born population - France (%)
Place of birth for the foreign-born population - Germany (%)
Place of birth for the foreign-born population - Netherlands (%)
Place of birth for the foreign-born population - Switzerland (%)
Place of birth for the foreign-born population - Other Western Europe (%)
Place of birth for the foreign-born population - Greece (%)
Place of birth for the foreign-born population - Italy (%)
Place of birth for the foreign-born population - Portugal (%)
Place of birth for the foreign-born population - Spain (%)
Place of birth for the foreign-born population - Other Southern Europe (%)
Place of birth for the foreign-born population - Albania (%)
Place of birth for the foreign-born population - Belarus (%)
Place of birth for the foreign-born population - Bosnia and Herzegovina (%)
Place of birth for the foreign-born population - Bulgaria (%)
Place of birth for the foreign-born population - Croatia (%)
Place of birth for the foreign-born population - Czechoslovakia (%)
Place of birth for the foreign-born population - Hungary (%)
Place of birth for the foreign-born population - Latvia (%)
Place of birth for the foreign-born population - Lithuania (%)
Place of birth for the foreign-born population - North Macedonia (Macedonia) (%)
Place of birth for the foreign-born population - Moldova (%)
Place of birth for the foreign-born population - Poland (%)
Place of birth for the foreign-born population - Romania (%)
Place of birth for the foreign-born population - Russia (%)
Place of birth for the foreign-born population - Serbia (%)
Place of birth for the foreign-born population - Ukraine (%)
Place of birth for the foreign-born population - Other Eastern Europe (%)
Place of birth for the foreign-born population - China (%)
Place of birth for the foreign-born population - Hong Kong (%)
Place of birth for the foreign-born population - Taiwan (%)
Place of birth for the foreign-born population - Japan (%)
Place of birth for the foreign-born population - Korea (%)
Place of birth for the foreign-born population - Other Eastern Asia (%)
Place of birth for the foreign-born population - Afghanistan (%)
Place of birth for the foreign-born population - Bangladesh (%)
Place of birth for the foreign-born population - India (%)
Place of birth for the foreign-born population - Iran (%)
Place of birth for the foreign-born population - Kazakhstan (%)
Place of birth for the foreign-born population - Nepal (%)
Place of birth for the foreign-born population - Pakistan (%)
Place of birth for the foreign-born population - Sri Lanka (%)
Place of birth for the foreign-born population - Uzbekistan (%)
Place of birth for the foreign-born population - Other South Central Asia (%)
Place of birth for the foreign-born population - Burma (%)
Place of birth for the foreign-born population - Cambodia (%)
Place of birth for the foreign-born population - Indonesia (%)
Place of birth for the foreign-born population - Laos (%)
Place of birth for the foreign-born population - Malaysia (%)
Place of birth for the foreign-born population - Philippines (%)
Place of birth for the foreign-born population - Singapore (%)
Place of birth for the foreign-born population - Thailand (%)
Place of birth for the foreign-born population - Vietnam (%)
Place of birth for the foreign-born population - Other South Eastern Asia (%)
Place of birth for the foreign-born population - Armenia (%)
Place of birth for the foreign-born population - Iraq (%)
Place of birth for the foreign-born population - Israel (%)
Place of birth for the foreign-born population - Jordan (%)
Place of birth for the foreign-born population - Kuwait (%)
Place of birth for the foreign-born population - Lebanon (%)
Place of birth for the foreign-born population - Saudi Arabia (%)
Place of birth for the foreign-born population - Syria (%)
Place of birth for the foreign-born population - Turkey (%)
Place of birth for the foreign-born population - Yemen (%)
Place of birth for the foreign-born population - Other Western Asia (%)
Place of birth for the foreign-born population - Eritrea (%)
Place of birth for the foreign-born population - Ethiopia (%)
Place of birth for the foreign-born population - Kenya (%)
Place of birth for the foreign-born population - Somalia (%)
Place of birth for the foreign-born population - Uganda (%)
Place of birth for the foreign-born population - Zimbabwe (%)
Place of birth for the foreign-born population - Other Eastern Africa (%)
Place of birth for the foreign-born population - Cameroon (%)
Place of birth for the foreign-born population - Congo (%)
Place of birth for the foreign-born population - Democratic Republic of Congo (Zaire) (%)
Place of birth for the foreign-born population - Other Middle Africa (%)
Place of birth for the foreign-born population - Egypt (%)
Place of birth for the foreign-born population - Morocco (%)
Place of birth for the foreign-born population - Sudan (%)
Place of birth for the foreign-born population - Other Northern Africa (%)
Place of birth for the foreign-born population - South Africa (%)
Place of birth for the foreign-born population - Other Southern Africa (%)
Place of birth for the foreign-born population - Cabo Verde (%)
Place of birth for the foreign-born population - Ghana (%)
Place of birth for the foreign-born population - Liberia (%)
Place of birth for the foreign-born population - Nigeria (%)
Place of birth for the foreign-born population - Senegal (%)
Place of birth for the foreign-born population - Sierra Leone (%)
Place of birth for the foreign-born population - Other Western Africa (%)
Place of birth for the foreign-born population - Australia (%)
Place of birth for the foreign-born population - New Zealand (%)
Place of birth for the foreign-born population - Fiji (%)
Place of birth for the foreign-born population - Micronesia (%)
Place of birth for the foreign-born population - Bahamas (%)
Place of birth for the foreign-born population - Barbados (%)
Place of birth for the foreign-born population - Cuba (%)
Place of birth for the foreign-born population - Dominica (%)
Place of birth for the foreign-born population - Dominican Republic (%)
Place of birth for the foreign-born population - Grenada (%)
Place of birth for the foreign-born population - Haiti (%)
Place of birth for the foreign-born population - Jamaica (%)
Place of birth for the foreign-born population - St. Vincent and the Grenadines (%)
Place of birth for the foreign-born population - Trinidad and Tobago (%)
Place of birth for the foreign-born population - West Indies (%)
Place of birth for the foreign-born population - Other Caribbean (%)
Place of birth for the foreign-born population - Belize (%)
Place of birth for the foreign-born population - Costa Rica (%)
Place of birth for the foreign-born population - El Salvador (%)
Place of birth for the foreign-born population - Guatemala (%)
Place of birth for the foreign-born population - Honduras (%)
Place of birth for the foreign-born population - Mexico (%)
Place of birth for the foreign-born population - Nicaragua (%)
Place of birth for the foreign-born population - Panama (%)
Place of birth for the foreign-born population - Other Central America (%)
Place of birth for the foreign-born population - Argentina (%)
Place of birth for the foreign-born population - Bolivia (%)
Place of birth for the foreign-born population - Brazil (%)
Place of birth for the foreign-born population - Chile (%)
Place of birth for the foreign-born population - Colombia (%)
Place of birth for the foreign-born population - Ecuador (%)
Place of birth for the foreign-born population - Guyana (%)
Place of birth for the foreign-born population - Peru (%)
Place of birth for the foreign-born population - Uruguay (%)
Place of birth for the foreign-born population - Venezuela (%)
Place of birth for the foreign-born population - Other South America (%)
Place of birth for the foreign-born population - Canada (%)
Place of birth for the foreign-born population - Other Northern America (%)
Place of birth for the foreign-born population - Other (%)
Latest news about races in Fairview, NJ collected exclusively by city-data.com from local newspapers, TV, and radio stations
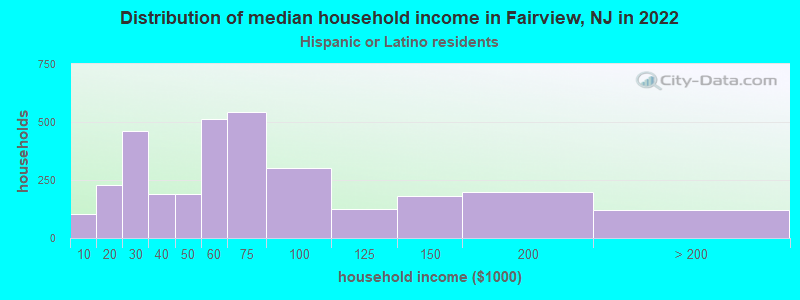
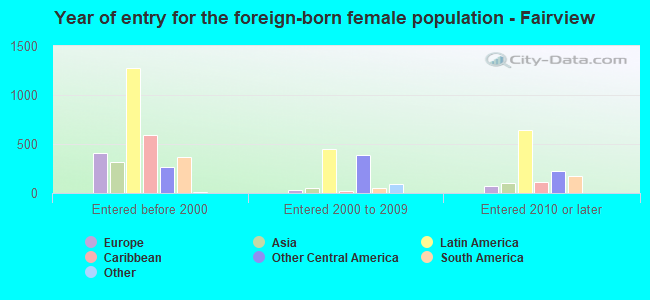
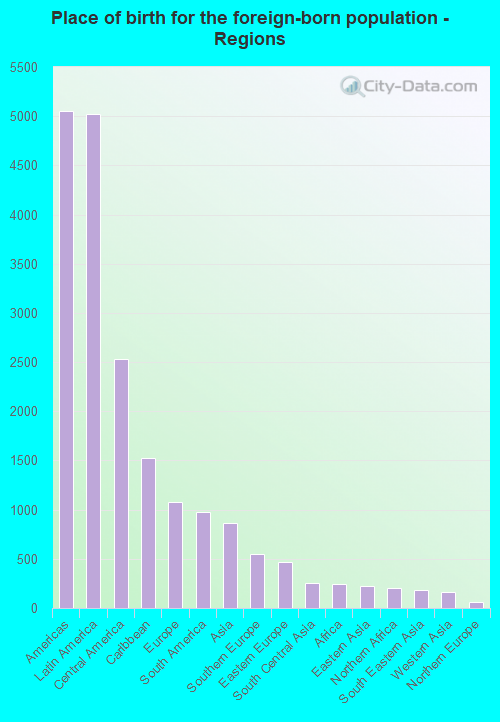
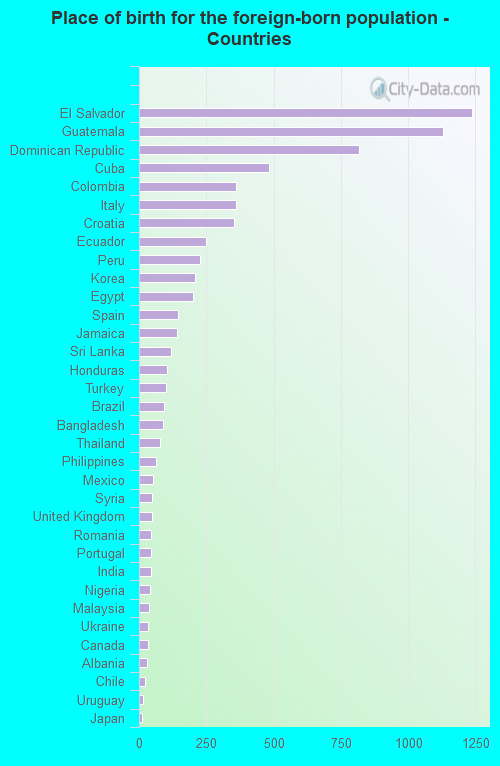
According to 2022 data, the most numerous races in Fairview, NJ are White alone (4,780 residents), Hispanic (8,638 residents), and Black alone (333 residents). 32.4% of Fairview residents speak English at home. 48.5% of Fairview, NJ residents are foreign-born (32.8% born in Latin America, 7.0% born in Europe, 5.6% born in Asia), which is 52.6% greater than the foreign-born rate of 23.0% across the entire state of New Jersey.
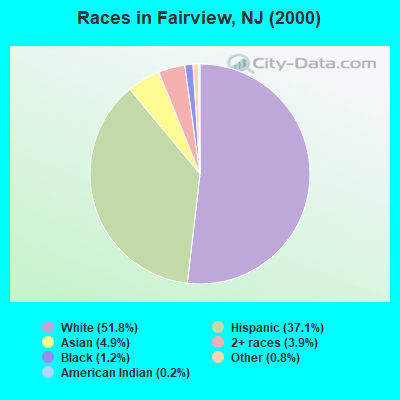
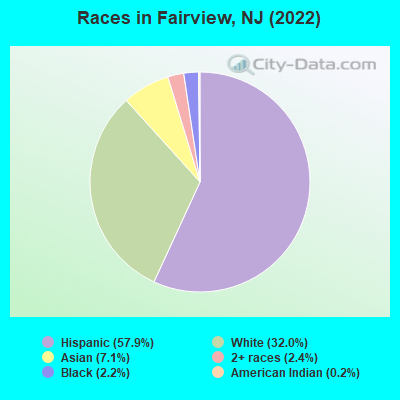
Race distribution in Fairview
2000 2022
5,557,209 66.0% White alone 1,117,191 13.3% Hispanic 1,096,171 13.0% Black alone 477,012 5.7% Asian alone 133,689 1.6% Two or more races 19,565 0.2% Other race alone 11,338 0.1% American Indian alone 2,175 0.03% Native Hawaiian and Other
4,766,476 51.5% White alone 2,028,470 21.9% Hispanic 1,111,632 12.0% Black alone 923,546 10.0% Asian alone 332,237 3.6% Two or more races 89,847 1.0% Other race alone 8,557 0.09% American Indian alone 934 0.01% Native Hawaiian and Other
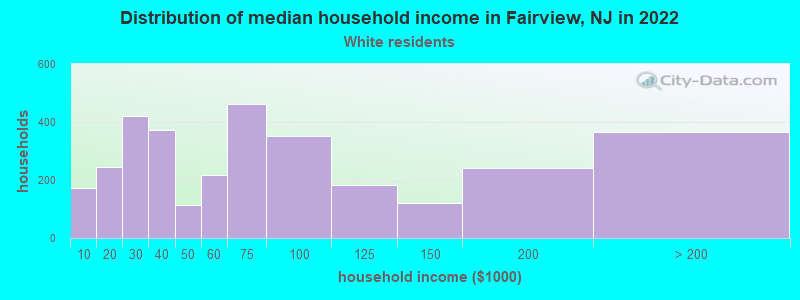
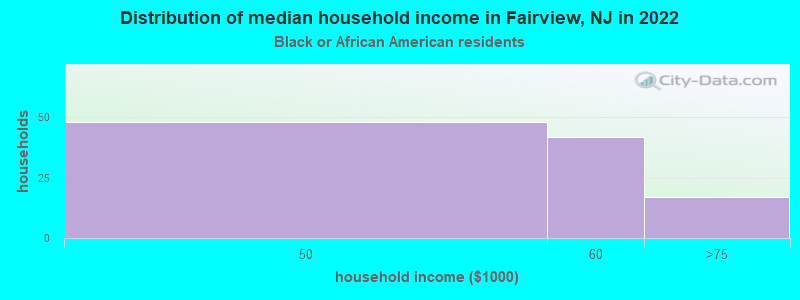
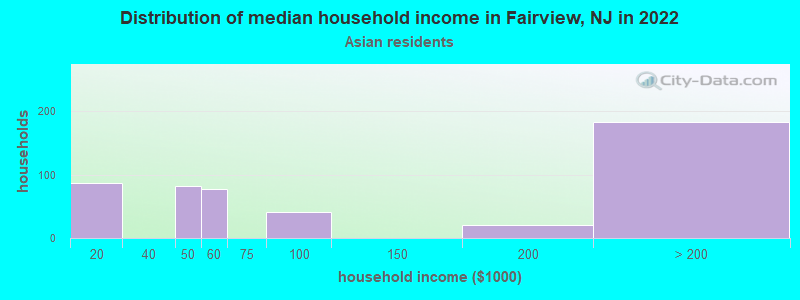
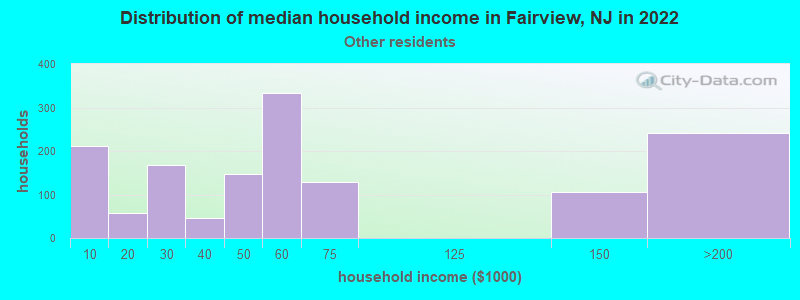
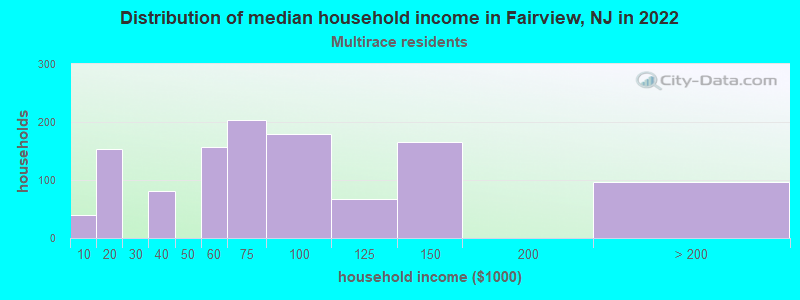
Income and house value in Fairview Median household income in 2022 $63,762 White non-Hispanic householders$64,059 Black householders$44,565 Some other race householders$60,872 Two or more races householders$56,091 Hispanic or Latino race householdersMedian 2022 house value $460,663 White Non-Hispanic householders$419,371 Black or African American householders $498,858 Asian householders$580,668 Some other race householders$500,148 Two or more races householders$475,889 Hispanic or Latino householders
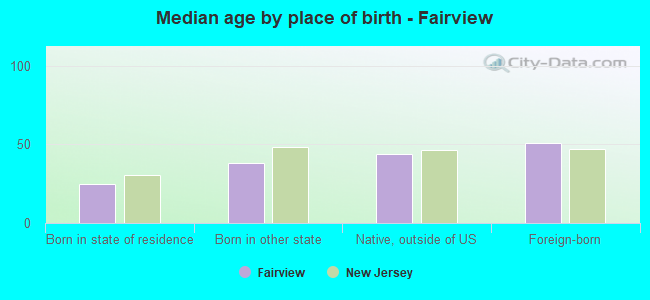
Median age by race in Fairview
40.9 Median age for White residents40.9 40.5 23.8 Median age for Black or African American residents18.8 23.6 20.1 Median age for American Indian / Alaska Native residents-686,322,685.6 19.7 50.0 Median age for Asian residents38.0 50.9 -510,460,250.5 Median age for Native Hawaiian / Pacific Islander residents-514,767,932.0 -713,070,378.3 40.8 Median age for Other race residents42.9 36.3 48.3 Median age for Two or more races residents46.8 55.1 44.0 Median age for White alone residents41.6 49.6 40.3 Median age for Hispanic or Latino residents41.0 39.7
Owner/renter occupied households by race in Fairview
House owners and renters - White residents 988 32.4% Owner occupied2,059 67.6% Renter occupiedHouse owners and renters - Black or African American residents 26 27.5% Owner occupied67 72.5% Renter occupiedHouse owners and renters - American Indian / Alaska Native residents 17 100.0% Owner occupiedHouse owners and renters - Asian residents 372 76.0% Owner occupied117 24.0% Renter occupiedHouse owners and renters - Other race residents 277 17.6% Owner occupied1,302 82.4% Renter occupiedHouse owners and renters - Two or more races residents 423 36.2% Owner occupied746 63.8% Renter occupiedHouse owners and renters - White alone residents 789 36.3% Owner occupied1,384 63.7% Renter occupiedHouse owners and renters - Hispanic or Latino residents 763 24.6% Owner occupied2,343 75.4% Renter occupied
Language usage in Fairview
English speakers - Total 32.4% of residents of Fairview speak English at home.
54.7% of residents speak Spanish at home 3,095 39.8% Speak English very well4,685 60.2% Speak English less than very well17.0% of residents speak other language at home 1,600 66.4% Speak English very well809 33.6% Speak English less than very well
English speakers - Born in the United States 59.0% of residents of Fairview speak English at home.
35.5% of residents speak Spanish at home 760 77.1% Speak English very well226 22.9% Speak English less than very well10.7% of residents speak other language at home 273 91.6% Speak English very well25 8.4% Speak English less than very well
English speakers - Native, born elsewhere 12.7% of residents of Fairview speak English at home.
102.9% of residents speak Spanish at home 160 23.5% Speak English very well522 76.5% Speak English less than very well
English speakers - Foreign-born 13.5% of residents of Fairview speak English at home.
65.7% of residents speak Spanish at home 1,080 23.2% Speak English very well3,580 76.8% Speak English less than very well24.0% of residents speak other language at home 964 56.6% Speak English very well738 43.4% Speak English less than very well
White (Caucasian) - Speak only English Native:
58.4% (2,438)Foreign-born:
16.9% (440)
White (Caucasian) - Speak another language Native:
34.0% (1,418)Foreign-born:
82.0% (2,136)
Black or African American - Speak only English Native:
73.6% (148)Foreign-born:
30.1% (36)
Black or African American - Speak another language Native:
26.6% (53)Foreign-born:
62.4% (76)
American Indian / Alaska Native - Speak another language Native:
100.0% (77)Foreign-born:
100.0% (13)
Asian - Speak only English Native:
73.5% (195)Foreign-born:
40.7% (318)
Asian - Speak another language Native:
27.8% (74)Foreign-born:
58.2% (455)
Other race - Speak only English Native:
12.9% (237)Foreign-born:
2.0% (57)
Other race - Speak another language Native:
91.0% (1,669)Foreign-born:
100.0% (2,876)
Two or more races - Speak only English Native:
57.5% (756)Foreign-born:
8.3% (102)
Two or more races - Speak another language Native:
42.6% (560)Foreign-born:
92.3% (1,134)
White alone - Speak only English Native:
77.2% (2,238)Foreign-born:
20.7% (365)
White alone - Speak another language Native:
21.9% (636)Foreign-born:
79.4% (1,401)
Hispanic or Latino - Speak only English Native:
25.1% (896)Foreign-born:
6.1% (273)
Hispanic or Latino - Speak another language Native:
77.7% (2,770)Foreign-born:
93.5% (4,211)
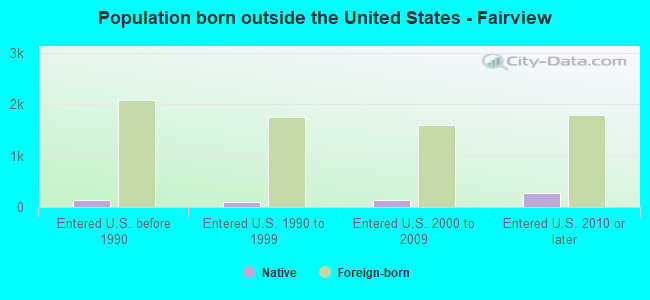
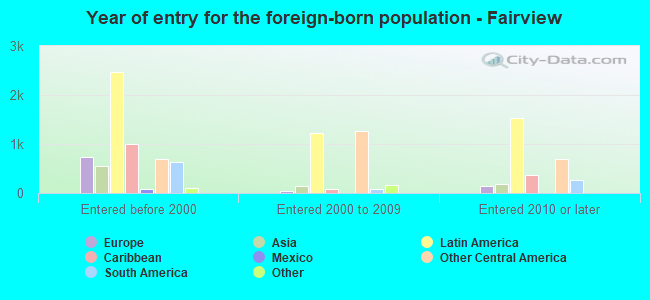
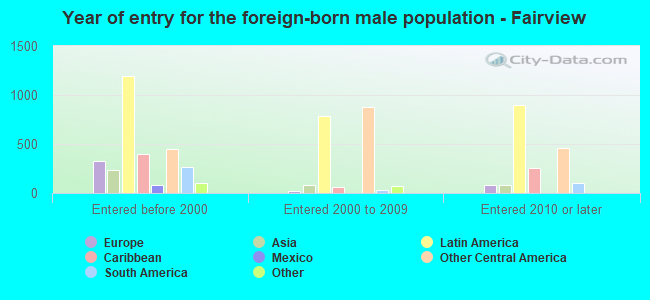
Foreign-born residents in Fairview 7,238 residents are foreign born (32.8% Latin America , 7.0% Europe , 5.6% Asia ).
This city:
48.5%New Jersey:
23.2%
Marital status for residents in Fairview Marital status - White (Caucasian) population 15 years and over
Males 44.4% Never married41.8% Now married2.8% Separated4.1% Widowed7.0% DivorcedFemales 40.3% Never married35.8% Now married0.4% Separated14.5% Widowed8.9% DivorcedWomen who gave birth in the past 12 months Now married:
100.0% (125)Unmarried:
0.0% (0)
Women who did not give birth in the past 12 months Now married:
36.2% (547)Unmarried:
63.8% (964)
Marital status - Black or African American population 15 years and over
Males 83.6% Never married16.4% Now married0.0% Separated0.0% Widowed0.0% DivorcedFemales 87.5% Never married12.5% Now married0.0% Separated0.0% Widowed0.0% DivorcedWomen who did not give birth in the past 12 months Now married:
12.5% (20)Unmarried:
87.5% (137)
Marital status - American Indian / Alaska Native population 15 years and over
Males 0.0% Never married100.0% Now married0.0% Separated0.0% Widowed0.0% DivorcedFemales 54.3% Never married45.7% Now married0.0% Separated0.0% Widowed0.0% DivorcedWomen who did not give birth in the past 12 months Now married:
0.0% (0)Unmarried:
100.0% (39)
Marital status - Asian population 15 years and over
Males 47.6% Never married44.4% Now married0.0% Separated0.0% Widowed8.0% DivorcedFemales 22.8% Never married45.9% Now married0.0% Separated14.1% Widowed17.2% DivorcedWomen who did not give birth in the past 12 months Now married:
55.2% (225)Unmarried:
44.8% (183)
Marital status - Other race population 15 years and over
Males 43.3% Never married51.3% Now married0.7% Separated0.0% Widowed4.7% DivorcedFemales 31.6% Never married55.8% Now married8.1% Separated2.5% Widowed2.1% DivorcedWomen who did not give birth in the past 12 months Now married:
54.6% (624)Unmarried:
45.4% (518)
Marital status - Two or more races population 15 years and over
Males 39.9% Never married32.4% Now married5.9% Separated0.0% Widowed21.9% DivorcedFemales 31.0% Never married26.9% Now married12.3% Separated12.3% Widowed17.4% DivorcedWomen who gave birth in the past 12 months Now married:
0.0% (0)Unmarried:
100.0% (22)
Women who did not give birth in the past 12 months Now married:
44.0% (225)Unmarried:
56.0% (286)
Marital status - White alone, not Hispanic / Latino population 15 years and over
Males 47.9% Never married37.3% Now married4.3% Separated3.1% Widowed7.4% DivorcedFemales 43.6% Never married26.5% Now married0.7% Separated18.5% Widowed10.8% DivorcedWomen who did not give birth in the past 12 months Now married:
26.9% (257)Unmarried:
73.1% (699)
Marital status - Hispanic or Latino population 15 years and over
Males 39.9% Never married47.5% Now married1.5% Separated2.2% Widowed8.8% DivorcedFemales 31.8% Never married47.1% Now married5.8% Separated7.6% Widowed7.6% DivorcedWomen who gave birth in the past 12 months Now married:
91.0% (159)Unmarried:
9.0% (16)
Women who did not give birth in the past 12 months Now married:
50.4% (901)Unmarried:
49.6% (888)
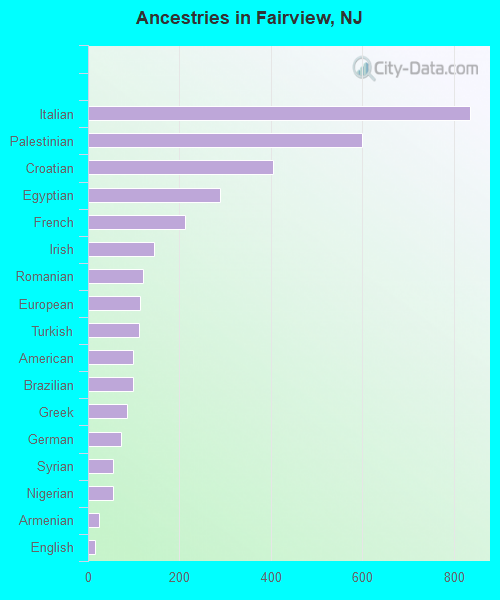
Ancestries in Fairview
835 8.1% Italian600 5.8% Palestinian404 3.9% Croatian289 2.8% Egyptian213 2.1% French144 1.4% Irish121 1.2% Romanian114 1.1% European112 1.1% Turkish98 0.9% American98 0.9% Brazilian86 0.8% Greek72 0.7% German55 0.5% Syrian55 0.5% Nigerian25 0.2% Armenian16 0.2% English
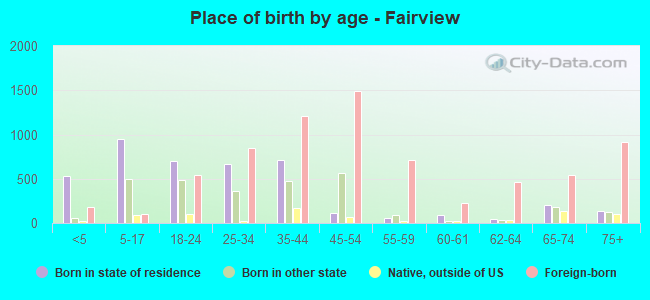
Children Nativity (place of birth) in Fairview
Children under 6 years - Living with two parents Both parents native 141 100.0% NativeBoth parents foreign-born 229 60.1% Native152 39.9% Foreign-bornOne native, one foreign-born parent 60 100.0% NativeChildren under 6 years - Living with one parent Foreign-born parent 297 100.0% NativeChildren 6 to 17 years - Living with two parents Both parents native 363 99.7% Native1 0.3% Foreign-bornBoth parents foreign-born 582 97.9% Native12 2.1% Foreign-bornOne native, one foreign-born parent 215 100.0% NativeChildren 6 to 17 years - Living with one parent Native parent 45 100.0% NativeForeign-born parent 265 56.7% Native203 43.3% Foreign-born
Grandparents responsible for own grandchildren in Fairview
Grandparents (30 to 59 years) Other race 51 100.0% Not responsible for grandchildrenHispanic or Latino 21 100.0% Not responsible for grandchildren
Grandparents (60 years and over) Other race 101 100.0% Not responsible for grandchildrenHispanic or Latino 237 100.0% Not responsible for grandchildren