Races in Farmington, Michigan (MI) Detailed Stats
Data:
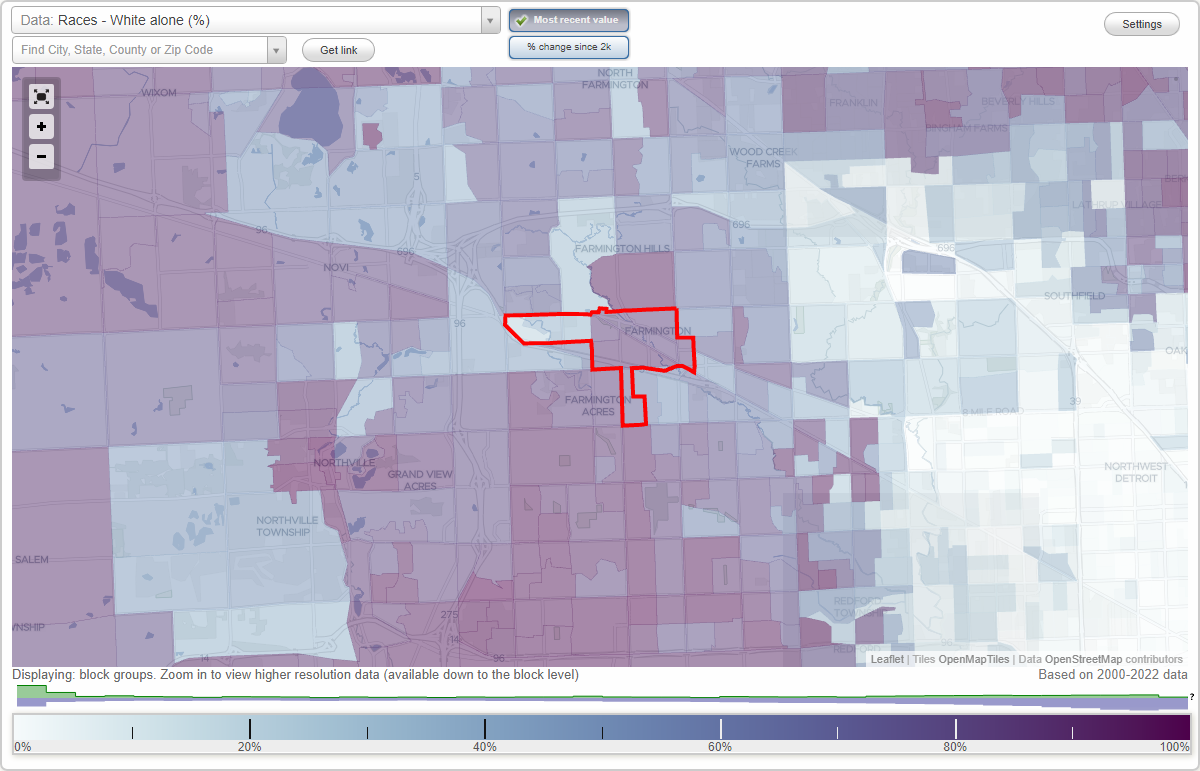
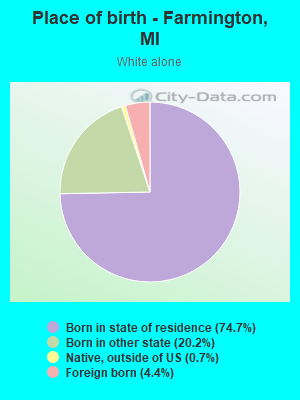
Races - White alone (%)
Races - White alone (% change since 2000)
Races - Black alone (%)
Races - Black alone (% change since 2000)
Races - American Indian alone (%)
Races - American Indian alone (% change since 2000)
Races - Asian alone (%)
Races - Asian alone (% change since 2000)
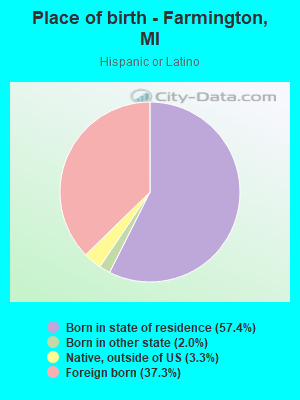
Races - Hispanic (%)
Races - Hispanic (% change since 2000)
Races - Native Hawaiian and Other Pacific Islander alone (%)
Races - Native Hawaiian and Other Pacific Islander alone (% change since 2000)
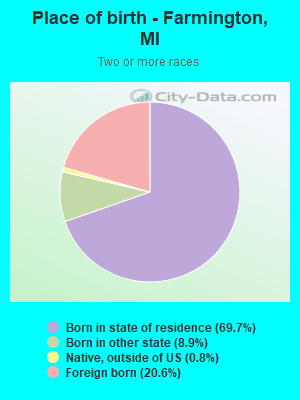
Races - Two or more races(%)
Races - Two or more races(% change since 2000)
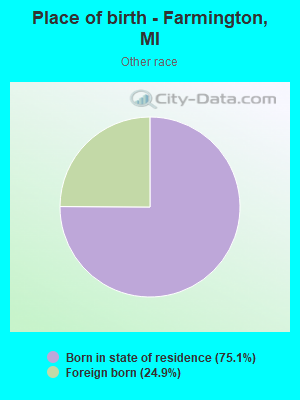
Races - Other race alone (%)
Races - Other race alone (% change since 2000)
Racial diversity
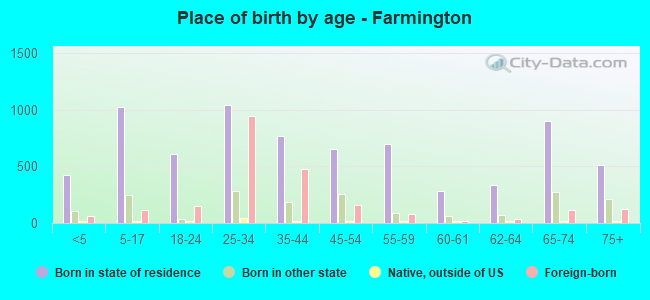
Place of birth - Born in state of residence (%)
Place of birth - Born in state of residence (%) - White
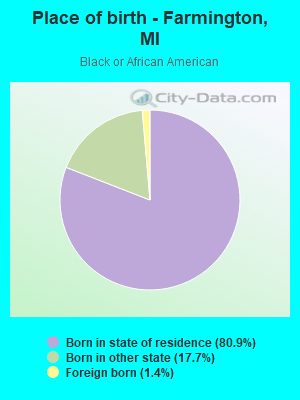
Place of birth - Born in state of residence (%) - Black or African American
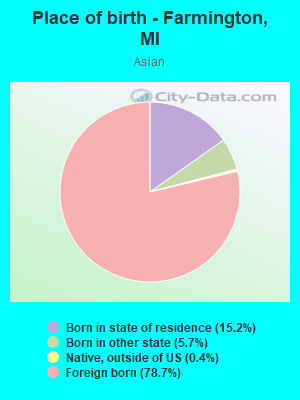
Place of birth - Born in state of residence (%) - Asian
Place of birth - Born in state of residence (%) - Hispanic or Latino
Place of birth - Born in state of residence (%) - American Indian and Alaska Native
Place of birth - Born in state of residence (%) - Multirace
Place of birth - Born in state of residence (%) - Other Race
Place of birth - Born in other state (%)
Place of birth - Born in other state (%) - White
Place of birth - Born in other state (%) - Black or African American
Place of birth - Born in other state (%) - Asian
Place of birth - Born in other state (%) - Hispanic or Latino
Place of birth - Born in other state (%) - American Indian and Alaska Native
Place of birth - Born in other state (%) - Multirace
Place of birth - Born in other state (%) - Other Race
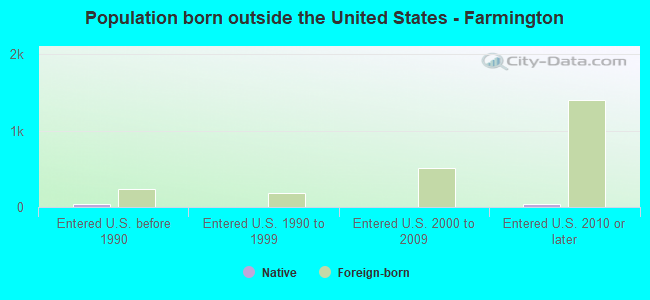
Place of birth - Native, outside of US (%)
Place of birth - Native, outside of US (%) - White
Place of birth - Native, outside of US (%) - Black or African American
Place of birth - Native, outside of US (%) - Asian
Place of birth - Native, outside of US (%) - Hispanic or Latino
Place of birth - Native, outside of US (%) - American Indian and Alaska Native
Place of birth - Native, outside of US (%) - Multirace
Place of birth - Native, outside of US (%) - Other Race
Place of birth - Foreign born (%)
Place of birth - Foreign born (%) - White
Place of birth - Foreign born (%) - Black or African American
Place of birth - Foreign born (%) - Asian
Place of birth - Foreign born (%) - Hispanic or Latino
Place of birth - Foreign born (%) - American Indian and Alaska Native
Place of birth - Foreign born (%) - Multirace
Place of birth - Foreign born (%) - Other Race
Residents speaking English at home (%)
Residents speaking English at home - Born in the United States (%)
Residents speaking English at home - Native, born elsewhere (%)
Residents speaking English at home - Foreign born (%)
Residents speaking Spanish at home (%)
Residents speaking Spanish at home - Born in the United States (%)
Residents speaking Spanish at home - Native, born elsewhere (%)
Residents speaking Spanish at home - Foreign born (%)
Residents speaking other language at home (%)
Residents speaking other language at home - Born in the United States (%)
Residents speaking other language at home - Native, born elsewhere (%)
Residents speaking other language at home - Foreign born (%)
Marital status - Never married (%)
Marital status - Now married (%)
Marital status - Separated (%)
Marital status - Widowed (%)
Marital status - Divorced (%)
Ancestries Reported - Arab (%)
Ancestries Reported - Czech (%)
Ancestries Reported - Danish (%)
Ancestries Reported - Dutch (%)
Ancestries Reported - English (%)
Ancestries Reported - French (%)
Ancestries Reported - French Canadian (%)
Ancestries Reported - German (%)
Ancestries Reported - Greek (%)
Ancestries Reported - Hungarian (%)
Ancestries Reported - Irish (%)
Ancestries Reported - Italian (%)
Ancestries Reported - Lithuanian (%)
Ancestries Reported - Norwegian (%)
Ancestries Reported - Polish (%)
Ancestries Reported - Portuguese (%)
Ancestries Reported - Russian (%)
Ancestries Reported - Scotch-Irish (%)
Ancestries Reported - Scottish (%)
Ancestries Reported - Slovak (%)
Ancestries Reported - Subsaharan African (%)
Ancestries Reported - Swedish (%)
Ancestries Reported - Swiss (%)
Ancestries Reported - Ukrainian (%)
Ancestries Reported - United States (%)
Ancestries Reported - Welsh (%)
Ancestries Reported - West Indian (%)
Ancestries Reported - Other (%)
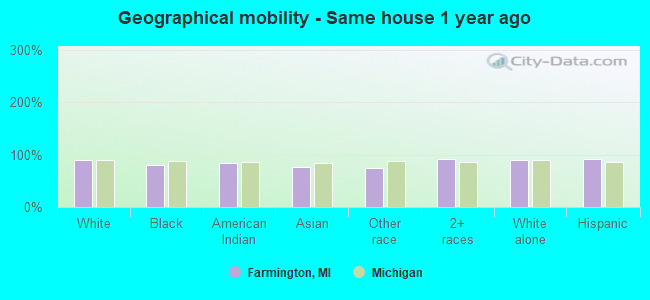
Geographical mobility - Same house 1 year ago (%)
Geographical mobility - Same house 1 year ago (%) - White
Geographical mobility - Same house 1 year ago (%) - Black or African American
Geographical mobility - Same house 1 year ago (%) - Asian
Geographical mobility - Same house 1 year ago (%) - Hispanic or Latino
Geographical mobility - Same house 1 year ago (%) - American Indian and Alaska Native
Geographical mobility - Same house 1 year ago (%) - Multirace
Geographical mobility - Same house 1 year ago (%) - Other Race
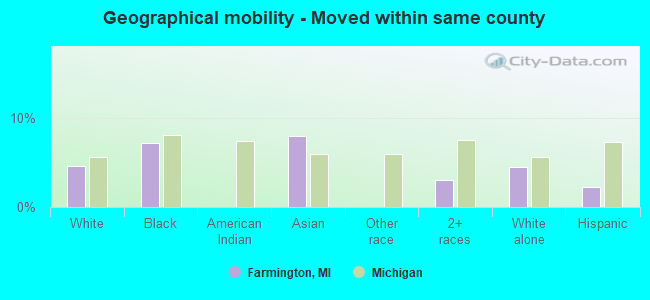
Geographical mobility - Moved within same county (%)
Geographical mobility - Moved within same county (%) - White
Geographical mobility - Moved within same county (%) - Black or African American
Geographical mobility - Moved within same county (%) - Asian
Geographical mobility - Moved within same county (%) - Hispanic or Latino
Geographical mobility - Moved within same county (%) - American Indian and Alaska Native
Geographical mobility - Moved within same county (%) - Multirace
Geographical mobility - Moved within same county (%) - Other Race
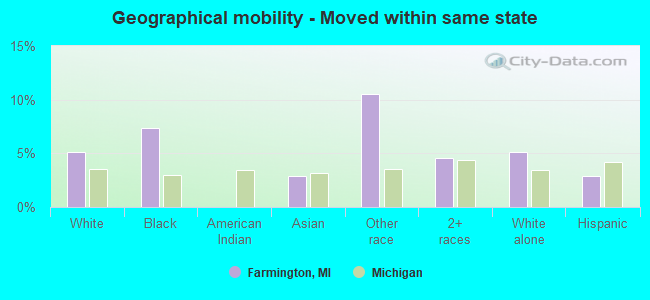
Geographical mobility - Moved from different county within same state (%)
Geographical mobility - Moved from different county within same state (%) - White
Geographical mobility - Moved from different county within same state (%) - Black or African American
Geographical mobility - Moved from different county within same state (%) - Asian
Geographical mobility - Moved from different county within same state (%) - Hispanic or Latino
Geographical mobility - Moved from different county within same state (%) - American Indian and Alaska Native
Geographical mobility - Moved from different county within same state (%) - Multirace
Geographical mobility - Moved from different county within same state (%) - Other Race
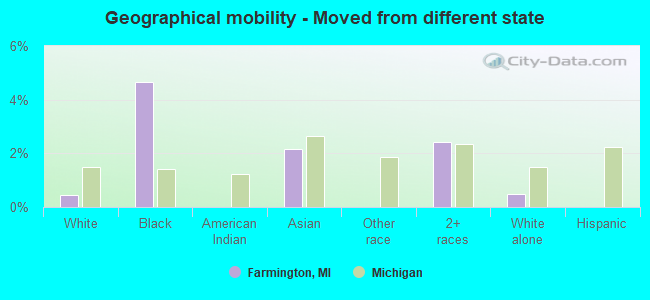
Geographical mobility - Moved from different state (%)
Geographical mobility - Moved from different state (%) - White
Geographical mobility - Moved from different state (%) - Black or African American
Geographical mobility - Moved from different state (%) - Asian
Geographical mobility - Moved from different state (%) - Hispanic or Latino
Geographical mobility - Moved from different state (%) - American Indian and Alaska Native
Geographical mobility - Moved from different state (%) - Multirace
Geographical mobility - Moved from different state (%) - Other Race
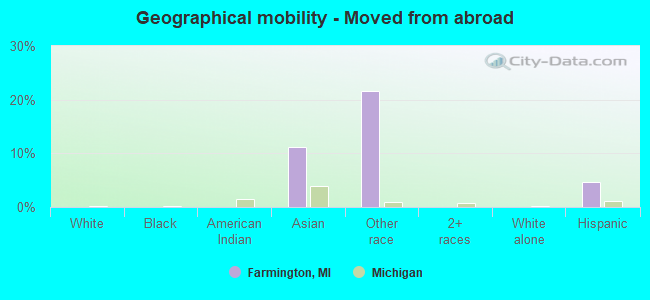
Geographical mobility - Moved from abroad (%)
Geographical mobility - Moved from abroad (%) - White
Geographical mobility - Moved from abroad (%) - Black or African American
Geographical mobility - Moved from abroad (%) - Asian
Geographical mobility - Moved from abroad (%) - Hispanic or Latino
Geographical mobility - Moved from abroad (%) - American Indian and Alaska Native
Geographical mobility - Moved from abroad (%) - Multirace
Geographical mobility - Moved from abroad (%) - Other Race
Place of birth for the foreign-born population - Ireland (%)
Place of birth for the foreign-born population - Denmark (%)
Place of birth for the foreign-born population - Norway (%)
Place of birth for the foreign-born population - Sweden (%)
Place of birth for the foreign-born population - United Kingdom (%)
Place of birth for the foreign-born population - England (%)
Place of birth for the foreign-born population - Scotland (%)
Place of birth for the foreign-born population - Other Northern Europe (%)
Place of birth for the foreign-born population - Austria (%)
Place of birth for the foreign-born population - Belgium (%)
Place of birth for the foreign-born population - France (%)
Place of birth for the foreign-born population - Germany (%)
Place of birth for the foreign-born population - Netherlands (%)
Place of birth for the foreign-born population - Switzerland (%)
Place of birth for the foreign-born population - Other Western Europe (%)
Place of birth for the foreign-born population - Greece (%)
Place of birth for the foreign-born population - Italy (%)
Place of birth for the foreign-born population - Portugal (%)
Place of birth for the foreign-born population - Spain (%)
Place of birth for the foreign-born population - Other Southern Europe (%)
Place of birth for the foreign-born population - Albania (%)
Place of birth for the foreign-born population - Belarus (%)
Place of birth for the foreign-born population - Bosnia and Herzegovina (%)
Place of birth for the foreign-born population - Bulgaria (%)
Place of birth for the foreign-born population - Croatia (%)
Place of birth for the foreign-born population - Czechoslovakia (%)
Place of birth for the foreign-born population - Hungary (%)
Place of birth for the foreign-born population - Latvia (%)
Place of birth for the foreign-born population - Lithuania (%)
Place of birth for the foreign-born population - North Macedonia (Macedonia) (%)
Place of birth for the foreign-born population - Moldova (%)
Place of birth for the foreign-born population - Poland (%)
Place of birth for the foreign-born population - Romania (%)
Place of birth for the foreign-born population - Russia (%)
Place of birth for the foreign-born population - Serbia (%)
Place of birth for the foreign-born population - Ukraine (%)
Place of birth for the foreign-born population - Other Eastern Europe (%)
Place of birth for the foreign-born population - China (%)
Place of birth for the foreign-born population - Hong Kong (%)
Place of birth for the foreign-born population - Taiwan (%)
Place of birth for the foreign-born population - Japan (%)
Place of birth for the foreign-born population - Korea (%)
Place of birth for the foreign-born population - Other Eastern Asia (%)
Place of birth for the foreign-born population - Afghanistan (%)
Place of birth for the foreign-born population - Bangladesh (%)
Place of birth for the foreign-born population - India (%)
Place of birth for the foreign-born population - Iran (%)
Place of birth for the foreign-born population - Kazakhstan (%)
Place of birth for the foreign-born population - Nepal (%)
Place of birth for the foreign-born population - Pakistan (%)
Place of birth for the foreign-born population - Sri Lanka (%)
Place of birth for the foreign-born population - Uzbekistan (%)
Place of birth for the foreign-born population - Other South Central Asia (%)
Place of birth for the foreign-born population - Burma (%)
Place of birth for the foreign-born population - Cambodia (%)
Place of birth for the foreign-born population - Indonesia (%)
Place of birth for the foreign-born population - Laos (%)
Place of birth for the foreign-born population - Malaysia (%)
Place of birth for the foreign-born population - Philippines (%)
Place of birth for the foreign-born population - Singapore (%)
Place of birth for the foreign-born population - Thailand (%)
Place of birth for the foreign-born population - Vietnam (%)
Place of birth for the foreign-born population - Other South Eastern Asia (%)
Place of birth for the foreign-born population - Armenia (%)
Place of birth for the foreign-born population - Iraq (%)
Place of birth for the foreign-born population - Israel (%)
Place of birth for the foreign-born population - Jordan (%)
Place of birth for the foreign-born population - Kuwait (%)
Place of birth for the foreign-born population - Lebanon (%)
Place of birth for the foreign-born population - Saudi Arabia (%)
Place of birth for the foreign-born population - Syria (%)
Place of birth for the foreign-born population - Turkey (%)
Place of birth for the foreign-born population - Yemen (%)
Place of birth for the foreign-born population - Other Western Asia (%)
Place of birth for the foreign-born population - Eritrea (%)
Place of birth for the foreign-born population - Ethiopia (%)
Place of birth for the foreign-born population - Kenya (%)
Place of birth for the foreign-born population - Somalia (%)
Place of birth for the foreign-born population - Uganda (%)
Place of birth for the foreign-born population - Zimbabwe (%)
Place of birth for the foreign-born population - Other Eastern Africa (%)
Place of birth for the foreign-born population - Cameroon (%)
Place of birth for the foreign-born population - Congo (%)
Place of birth for the foreign-born population - Democratic Republic of Congo (Zaire) (%)
Place of birth for the foreign-born population - Other Middle Africa (%)
Place of birth for the foreign-born population - Egypt (%)
Place of birth for the foreign-born population - Morocco (%)
Place of birth for the foreign-born population - Sudan (%)
Place of birth for the foreign-born population - Other Northern Africa (%)
Place of birth for the foreign-born population - South Africa (%)
Place of birth for the foreign-born population - Other Southern Africa (%)
Place of birth for the foreign-born population - Cabo Verde (%)
Place of birth for the foreign-born population - Ghana (%)
Place of birth for the foreign-born population - Liberia (%)
Place of birth for the foreign-born population - Nigeria (%)
Place of birth for the foreign-born population - Senegal (%)
Place of birth for the foreign-born population - Sierra Leone (%)
Place of birth for the foreign-born population - Other Western Africa (%)
Place of birth for the foreign-born population - Australia (%)
Place of birth for the foreign-born population - New Zealand (%)
Place of birth for the foreign-born population - Fiji (%)
Place of birth for the foreign-born population - Micronesia (%)
Place of birth for the foreign-born population - Bahamas (%)
Place of birth for the foreign-born population - Barbados (%)
Place of birth for the foreign-born population - Cuba (%)
Place of birth for the foreign-born population - Dominica (%)
Place of birth for the foreign-born population - Dominican Republic (%)
Place of birth for the foreign-born population - Grenada (%)
Place of birth for the foreign-born population - Haiti (%)
Place of birth for the foreign-born population - Jamaica (%)
Place of birth for the foreign-born population - St. Vincent and the Grenadines (%)
Place of birth for the foreign-born population - Trinidad and Tobago (%)
Place of birth for the foreign-born population - West Indies (%)
Place of birth for the foreign-born population - Other Caribbean (%)
Place of birth for the foreign-born population - Belize (%)
Place of birth for the foreign-born population - Costa Rica (%)
Place of birth for the foreign-born population - El Salvador (%)
Place of birth for the foreign-born population - Guatemala (%)
Place of birth for the foreign-born population - Honduras (%)
Place of birth for the foreign-born population - Mexico (%)
Place of birth for the foreign-born population - Nicaragua (%)
Place of birth for the foreign-born population - Panama (%)
Place of birth for the foreign-born population - Other Central America (%)
Place of birth for the foreign-born population - Argentina (%)
Place of birth for the foreign-born population - Bolivia (%)
Place of birth for the foreign-born population - Brazil (%)
Place of birth for the foreign-born population - Chile (%)
Place of birth for the foreign-born population - Colombia (%)
Place of birth for the foreign-born population - Ecuador (%)
Place of birth for the foreign-born population - Guyana (%)
Place of birth for the foreign-born population - Peru (%)
Place of birth for the foreign-born population - Uruguay (%)
Place of birth for the foreign-born population - Venezuela (%)
Place of birth for the foreign-born population - Other South America (%)
Place of birth for the foreign-born population - Canada (%)
Place of birth for the foreign-born population - Other Northern America (%)
Place of birth for the foreign-born population - Other (%)
Latest news about races in Farmington, MI collected exclusively by city-data.com from local newspapers, TV, and radio stations
According to 2022 data, the most numerous races in Farmington, MI are White alone (7,241 residents), Black alone (903 residents), and Hispanic (484 residents). 77.6% of Farmington residents speak English at home. 19.8% of Farmington, MI residents are foreign-born (14.7% born in Asia, 2.6% born in Europe), which is 69.7% greater than the foreign-born rate of 6.0% across the entire state of Michigan.
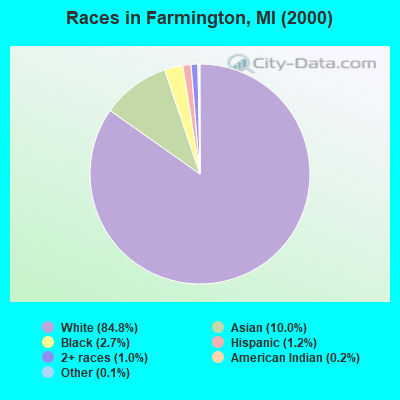
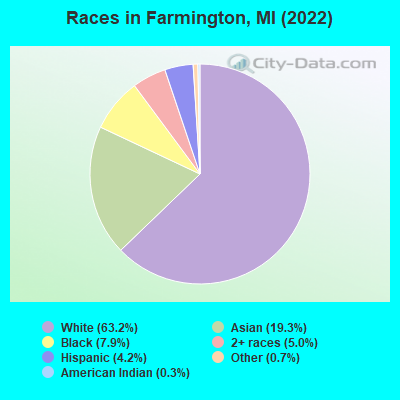
Race distribution in Farmington
2000 2022
7,806,691 78.6% White alone 1,402,047 14.1% Black alone 323,877 3.3% Hispanic 175,311 1.8% Asian alone 163,487 1.6% Two or more races 53,421 0.5% American Indian alone 11,465 0.1% Other race alone 2,145 0.02% Native Hawaiian and Other
7,289,051 72.6% White alone 1,310,464 13.1% Black alone 572,405 5.7% Hispanic 450,031 4.5% Two or more races 335,732 3.3% Asian alone 45,217 0.5% Other race alone 29,011 0.3% American Indian alone 2,207 0.02% Native Hawaiian and Other
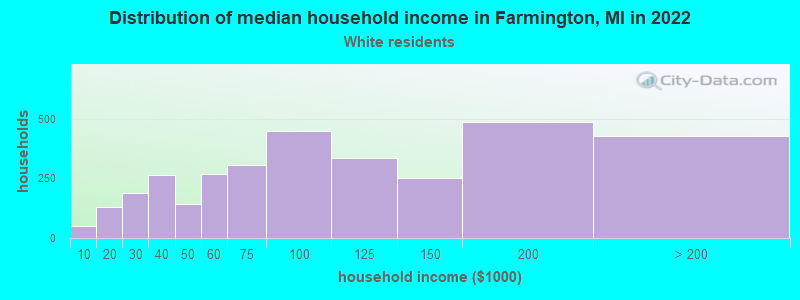
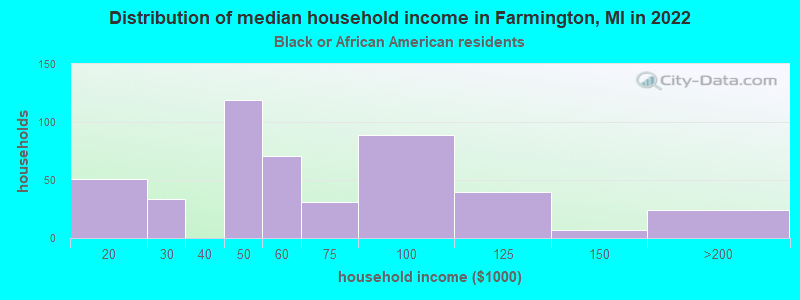
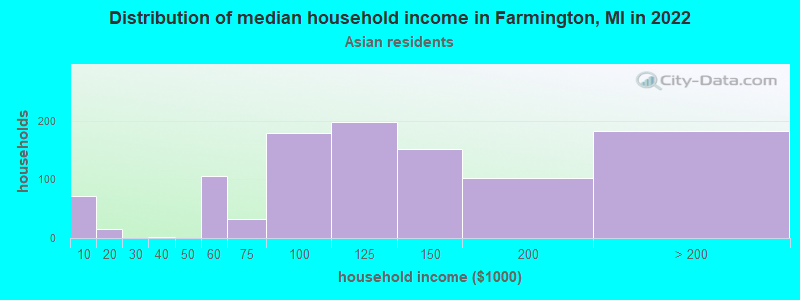
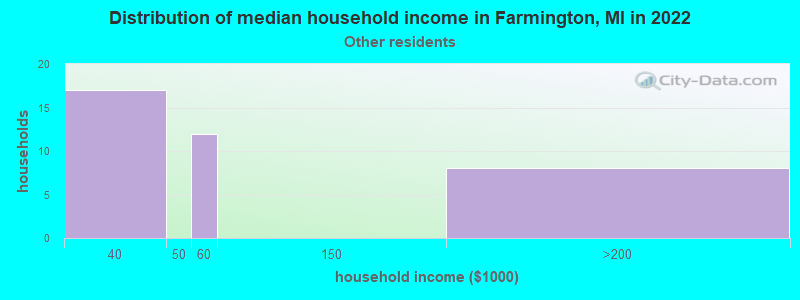
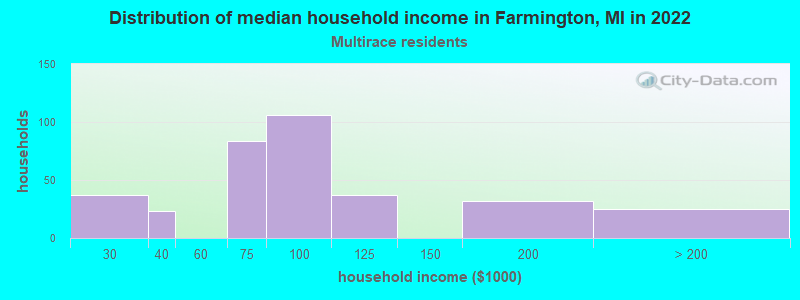
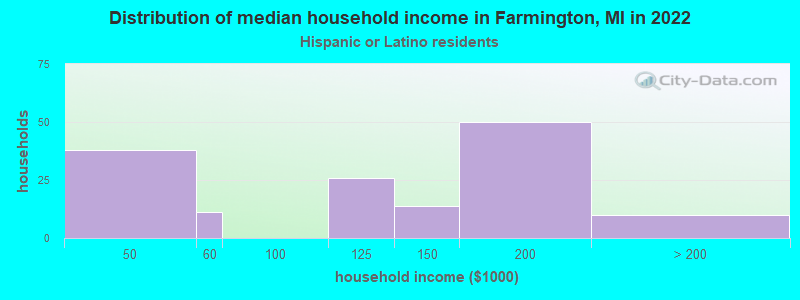
Income and house value in Farmington Median household income in 2022 $91,201 White non-Hispanic householders$56,165 Black householders$121,514 Asian householders$79,227 Two or more races householders$116,579 Hispanic or Latino race householdersMedian 2022 house value $293,958 White Non-Hispanic householders$347,728 Black or African American householders $302,608 Asian householders$318,044 Two or more races householders$320,249 Hispanic or Latino householders
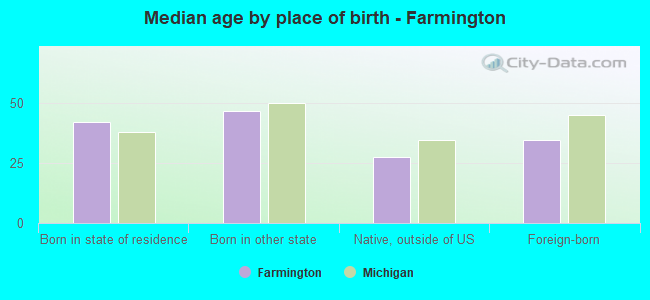
Median age by race in Farmington
47.6 Median age for White residents42.8 51.7 50.8 Median age for Black or African American residents36.8 55.3 15.5 Median age for American Indian / Alaska Native residents-505,050,504.5 -728,395,061.0 33.0 Median age for Asian residents34.2 31.0 -670,531,400.3 Median age for Native Hawaiian / Pacific Islander residents-674,772,035.8 -699,588,476.7 24.7 Median age for Other race residents-685,416,666.0 23.3 37.5 Median age for Two or more races residents24.0 41.7 47.6 Median age for White alone residents43.2 51.8 25.3 Median age for Hispanic or Latino residents15.2 30.9
Owner/renter occupied households by race in Farmington
House owners and renters - White residents 2,735 82.1% Owner occupied597 17.9% Renter occupiedHouse owners and renters - Black or African American residents 119 23.5% Owner occupied389 76.5% Renter occupiedHouse owners and renters - American Indian / Alaska Native residents 8 100.0% Owner occupiedHouse owners and renters - Asian residents 281 26.8% Owner occupied765 73.2% Renter occupiedHouse owners and renters - Other race residents 24 38.1% Owner occupied39 61.9% Renter occupiedHouse owners and renters - Two or more races residents 204 59.6% Owner occupied138 40.4% Renter occupiedHouse owners and renters - White alone residents 2,699 82.7% Owner occupied566 17.3% Renter occupiedHouse owners and renters - Hispanic or Latino residents 94 66.5% Owner occupied48 33.5% Renter occupied
Language usage in Farmington
English speakers - Total 77.6% of residents of Farmington speak English at home.
2.3% of residents speak Spanish at home 142 57.5% Speak English very well105 42.5% Speak English less than very well20.1% of residents speak other language at home 1,734 79.6% Speak English very well444 20.4% Speak English less than very well
English speakers - Born in the United States 86.7% of residents of Farmington speak English at home.
0.8% of residents speak Spanish at home 13 100.0% Speak English less than very well10.8% of residents speak other language at home 185 100.0% Speak English very well
English speakers - Native, born elsewhere 85.5% of residents of Farmington speak English at home.
22.4% of residents speak Spanish at home 17 100.0% Speak English very well
English speakers - Foreign-born 16.2% of residents of Farmington speak English at home.
7.6% of residents speak Spanish at home 101 59.8% Speak English very well68 40.2% Speak English less than very well75.5% of residents speak other language at home 1,257 75.3% Speak English very well413 24.7% Speak English less than very well
White (Caucasian) - Speak only English Native:
94.5% (6,201)Foreign-born:
26.1% (92)
White (Caucasian) - Speak another language Native:
5.4% (355)Foreign-born:
73.4% (258)
Black or African American - Speak only English Native:
100.0% (844)Foreign-born:
69.8% (9)
Asian - Speak only English Native:
66.8% (241)Foreign-born:
13.3% (224)
Asian - Speak another language Native:
34.0% (123)Foreign-born:
86.7% (1,453)
Two or more races - Speak only English Native:
89.1% (690)Foreign-born:
31.4% (66)
Two or more races - Speak another language Native:
10.8% (84)Foreign-born:
65.8% (139)
White alone - Speak only English Native:
94.4% (6,209)Foreign-born:
25.2% (81)
White alone - Speak another language Native:
5.7% (374)Foreign-born:
74.4% (238)
Hispanic or Latino - Speak only English Native:
81.0% (245)Foreign-born:
6.8% (12)
Hispanic or Latino - Speak another language Native:
16.8% (51)Foreign-born:
92.9% (166)
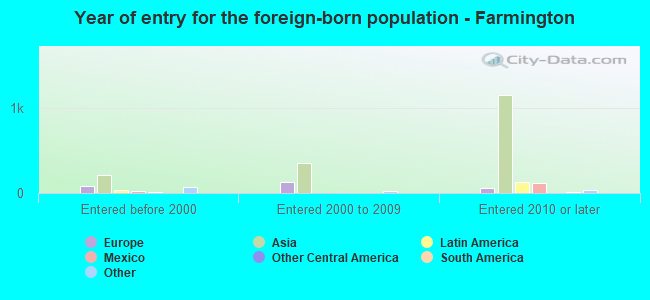
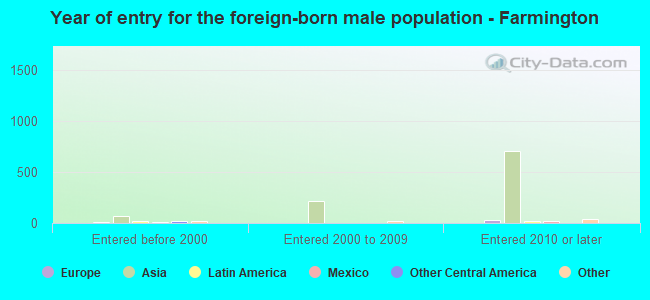
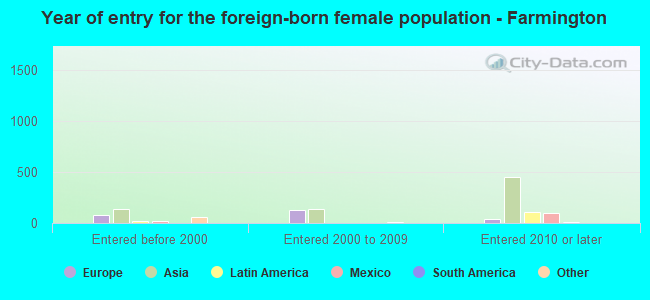
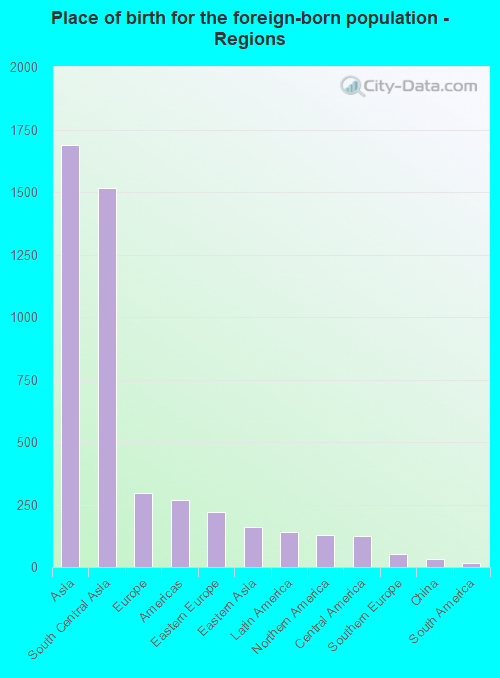
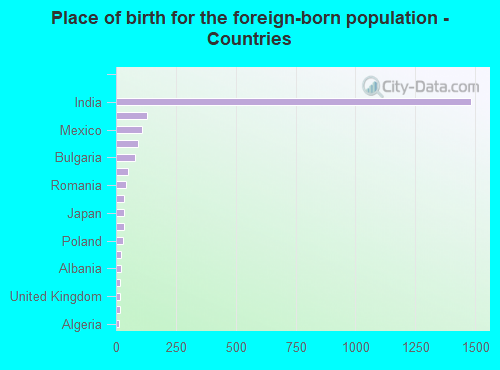
Foreign-born residents in Farmington 2,272 residents are foreign born (14.7% Asia , 2.6% Europe ).
This city:
19.8%Michigan:
6.9%
Marital status for residents in Farmington Marital status - White (Caucasian) population 15 years and over
Males 34.2% Never married56.5% Now married0.6% Separated1.1% Widowed7.6% DivorcedFemales 27.3% Never married50.1% Now married1.0% Separated7.8% Widowed13.9% DivorcedWomen who gave birth in the past 12 months Now married:
100.0% (62)Unmarried:
0.0% (0)
Women who did not give birth in the past 12 months Now married:
47.2% (605)Unmarried:
52.8% (676)
Marital status - Black or African American population 15 years and over
Males 52.9% Never married39.0% Now married0.0% Separated0.0% Widowed8.1% DivorcedFemales 39.4% Never married20.8% Now married0.0% Separated20.2% Widowed19.6% DivorcedWomen who did not give birth in the past 12 months Now married:
40.9% (83)Unmarried:
59.1% (120)
Marital status - Asian population 15 years and over
Males 26.7% Never married70.2% Now married0.0% Separated0.0% Widowed3.1% DivorcedFemales 22.9% Never married66.7% Now married0.0% Separated8.9% Widowed1.6% DivorcedWomen who gave birth in the past 12 months Now married:
100.0% (60)Unmarried:
0.0% (0)
Women who did not give birth in the past 12 months Now married:
66.5% (421)Unmarried:
33.5% (212)
Marital status - Two or more races population 15 years and over
Males 36.2% Never married57.5% Now married0.0% Separated0.0% Widowed6.3% DivorcedFemales 21.2% Never married60.1% Now married0.0% Separated0.3% Widowed18.4% DivorcedWomen who did not give birth in the past 12 months Now married:
58.2% (159)Unmarried:
41.8% (114)
Marital status - White alone, not Hispanic / Latino population 15 years and over
Males 34.2% Never married57.0% Now married0.6% Separated1.1% Widowed7.0% DivorcedFemales 27.7% Never married50.2% Now married1.0% Separated7.9% Widowed13.2% DivorcedWomen who gave birth in the past 12 months Now married:
100.0% (63)Unmarried:
0.0% (0)
Women who did not give birth in the past 12 months Now married:
47.3% (597)Unmarried:
52.7% (665)
Marital status - Hispanic or Latino population 15 years and over
Males 33.3% Never married46.5% Now married0.0% Separated0.0% Widowed20.2% DivorcedFemales 22.2% Never married58.2% Now married0.0% Separated0.0% Widowed19.6% DivorcedWomen who did not give birth in the past 12 months Now married:
59.7% (93)Unmarried:
40.3% (63)
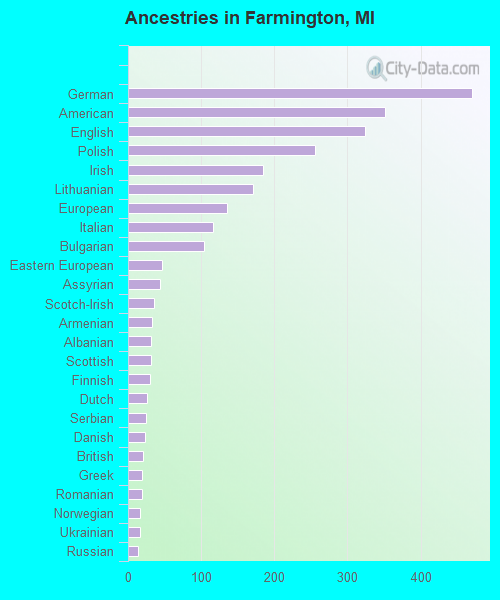
Ancestries in Farmington
470 8.8% German352 6.6% American324 6.0% English255 4.8% Polish184 3.4% Irish171 3.2% Lithuanian135 2.5% European116 2.2% Italian104 1.9% Bulgarian47 0.9% Eastern European44 0.8% Assyrian36 0.7% Scotch-Irish33 0.6% Armenian32 0.6% Albanian32 0.6% Scottish30 0.6% Finnish26 0.5% Dutch25 0.5% Serbian23 0.4% Danish21 0.4% British19 0.4% Greek19 0.4% Romanian16 0.3% Norwegian16 0.3% Ukrainian14 0.3% Russian13 0.2% Scandinavian11 0.2% French Canadian10 0.2% Czech9 0.2% Welsh8 0.1% Slovak7 0.1% Maltese7 0.1% Swedish7 0.1% Canadian7 0.1% Hungarian6 0.1% French4 0.07% Northern European
Children Nativity (place of birth) in Farmington
Children under 6 years - Living with two parents Both parents native 448 99.0% Native5 1.0% Foreign-bornBoth parents foreign-born 92 48.6% Native98 51.4% Foreign-bornOne native, one foreign-born parent 49 100.0% NativeChildren under 6 years - Living with one parent Native parent 64 100.0% NativeChildren 6 to 17 years - Living with two parents Both parents native 774 98.0% Native16 2.0% Foreign-bornBoth parents foreign-born 119 68.9% Native54 31.1% Foreign-bornOne native, one foreign-born parent 15 59.0% Native10 41.0% Foreign-bornChildren 6 to 17 years - Living with one parent Native parent 162 100.0% Native
Grandparents responsible for own grandchildren in Farmington
Grandparents (30 to 59 years) White / Caucasian 15 22.8% Responsible for grandchildren52 77.2% Not responsible for grandchildrenWhite alone, not Hispanic / Latino 16 25.9% Responsible for grandchildren45 74.1% Not responsible for grandchildrenHispanic or Latino 10 100.0% Not responsible for grandchildrenGrandparents (60 years and over) White / Caucasian 26 35.3% Responsible for grandchildren48 64.7% Not responsible for grandchildrenWhite alone, not Hispanic / Latino 27 35.9% Responsible for grandchildren48 64.1% Not responsible for grandchildren