Races in Farmington, Minnesota (MN) Detailed Stats
Data:
Races - White alone (%)
Races - White alone (% change since 2000)
Races - Black alone (%)
Races - Black alone (% change since 2000)
Races - American Indian alone (%)
Races - American Indian alone (% change since 2000)
Races - Asian alone (%)
Races - Asian alone (% change since 2000)
Races - Hispanic (%)
Races - Hispanic (% change since 2000)
Races - Native Hawaiian and Other Pacific Islander alone (%)
Races - Native Hawaiian and Other Pacific Islander alone (% change since 2000)
Races - Two or more races(%)
Races - Two or more races(% change since 2000)
Races - Other race alone (%)
Races - Other race alone (% change since 2000)
Racial diversity
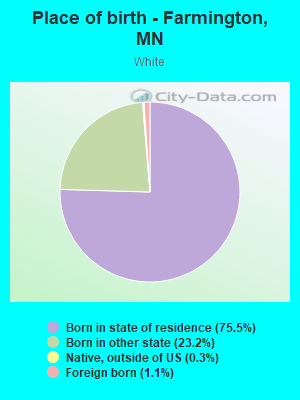
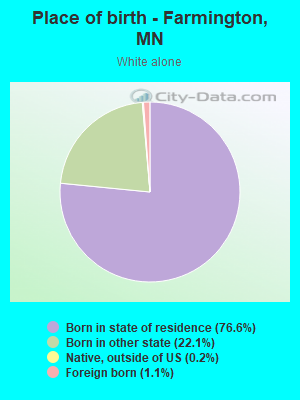
Place of birth - Born in state of residence (%)
Place of birth - Born in state of residence (%) - White
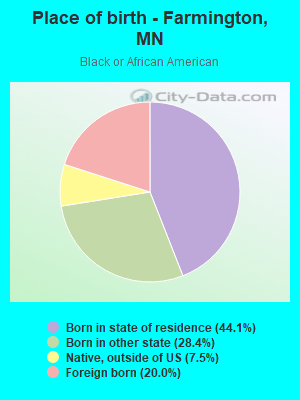
Place of birth - Born in state of residence (%) - Black or African American
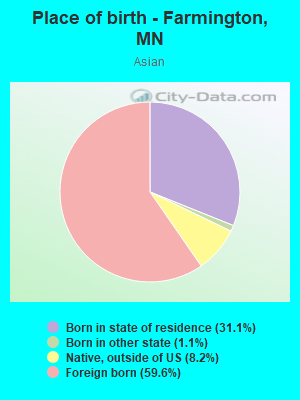
Place of birth - Born in state of residence (%) - Asian
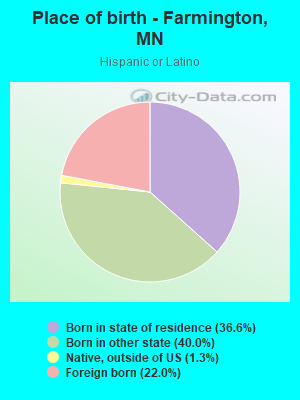
Place of birth - Born in state of residence (%) - Hispanic or Latino
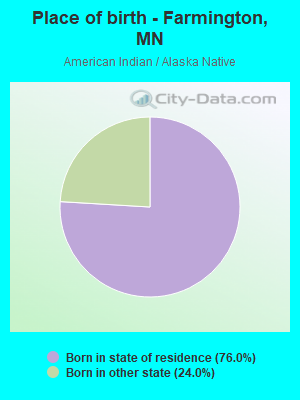
Place of birth - Born in state of residence (%) - American Indian and Alaska Native
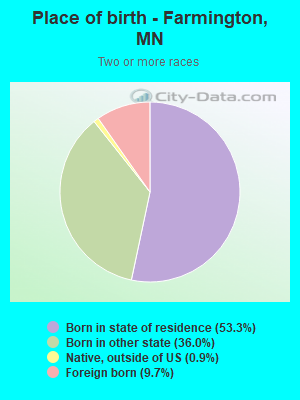
Place of birth - Born in state of residence (%) - Multirace
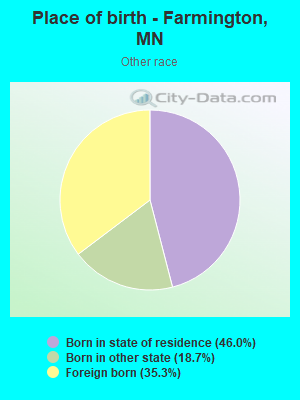
Place of birth - Born in state of residence (%) - Other Race
Place of birth - Born in other state (%)
Place of birth - Born in other state (%) - White
Place of birth - Born in other state (%) - Black or African American
Place of birth - Born in other state (%) - Asian
Place of birth - Born in other state (%) - Hispanic or Latino
Place of birth - Born in other state (%) - American Indian and Alaska Native
Place of birth - Born in other state (%) - Multirace
Place of birth - Born in other state (%) - Other Race
Place of birth - Native, outside of US (%)
Place of birth - Native, outside of US (%) - White
Place of birth - Native, outside of US (%) - Black or African American
Place of birth - Native, outside of US (%) - Asian
Place of birth - Native, outside of US (%) - Hispanic or Latino
Place of birth - Native, outside of US (%) - American Indian and Alaska Native
Place of birth - Native, outside of US (%) - Multirace
Place of birth - Native, outside of US (%) - Other Race
Place of birth - Foreign born (%)
Place of birth - Foreign born (%) - White
Place of birth - Foreign born (%) - Black or African American
Place of birth - Foreign born (%) - Asian
Place of birth - Foreign born (%) - Hispanic or Latino
Place of birth - Foreign born (%) - American Indian and Alaska Native
Place of birth - Foreign born (%) - Multirace
Place of birth - Foreign born (%) - Other Race
Residents speaking English at home (%)
Residents speaking English at home - Born in the United States (%)
Residents speaking English at home - Native, born elsewhere (%)
Residents speaking English at home - Foreign born (%)
Residents speaking Spanish at home (%)
Residents speaking Spanish at home - Born in the United States (%)
Residents speaking Spanish at home - Native, born elsewhere (%)
Residents speaking Spanish at home - Foreign born (%)
Residents speaking other language at home (%)
Residents speaking other language at home - Born in the United States (%)
Residents speaking other language at home - Native, born elsewhere (%)
Residents speaking other language at home - Foreign born (%)
Marital status - Never married (%)
Marital status - Now married (%)
Marital status - Separated (%)
Marital status - Widowed (%)
Marital status - Divorced (%)
Ancestries Reported - Arab (%)
Ancestries Reported - Czech (%)
Ancestries Reported - Danish (%)
Ancestries Reported - Dutch (%)
Ancestries Reported - English (%)
Ancestries Reported - French (%)
Ancestries Reported - French Canadian (%)
Ancestries Reported - German (%)
Ancestries Reported - Greek (%)
Ancestries Reported - Hungarian (%)
Ancestries Reported - Irish (%)
Ancestries Reported - Italian (%)
Ancestries Reported - Lithuanian (%)
Ancestries Reported - Norwegian (%)
Ancestries Reported - Polish (%)
Ancestries Reported - Portuguese (%)
Ancestries Reported - Russian (%)
Ancestries Reported - Scotch-Irish (%)
Ancestries Reported - Scottish (%)
Ancestries Reported - Slovak (%)
Ancestries Reported - Subsaharan African (%)
Ancestries Reported - Swedish (%)
Ancestries Reported - Swiss (%)
Ancestries Reported - Ukrainian (%)
Ancestries Reported - United States (%)
Ancestries Reported - Welsh (%)
Ancestries Reported - West Indian (%)
Ancestries Reported - Other (%)
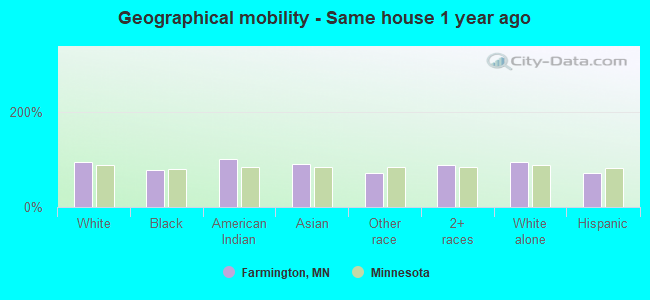
Geographical mobility - Same house 1 year ago (%)
Geographical mobility - Same house 1 year ago (%) - White
Geographical mobility - Same house 1 year ago (%) - Black or African American
Geographical mobility - Same house 1 year ago (%) - Asian
Geographical mobility - Same house 1 year ago (%) - Hispanic or Latino
Geographical mobility - Same house 1 year ago (%) - American Indian and Alaska Native
Geographical mobility - Same house 1 year ago (%) - Multirace
Geographical mobility - Same house 1 year ago (%) - Other Race
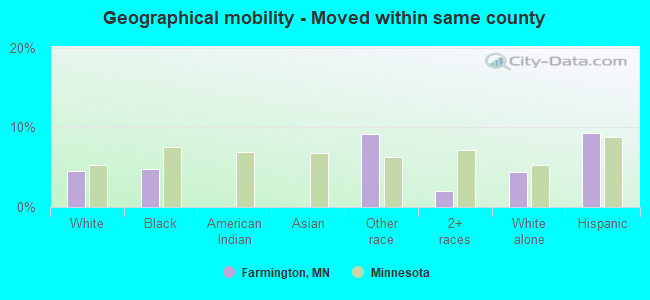
Geographical mobility - Moved within same county (%)
Geographical mobility - Moved within same county (%) - White
Geographical mobility - Moved within same county (%) - Black or African American
Geographical mobility - Moved within same county (%) - Asian
Geographical mobility - Moved within same county (%) - Hispanic or Latino
Geographical mobility - Moved within same county (%) - American Indian and Alaska Native
Geographical mobility - Moved within same county (%) - Multirace
Geographical mobility - Moved within same county (%) - Other Race
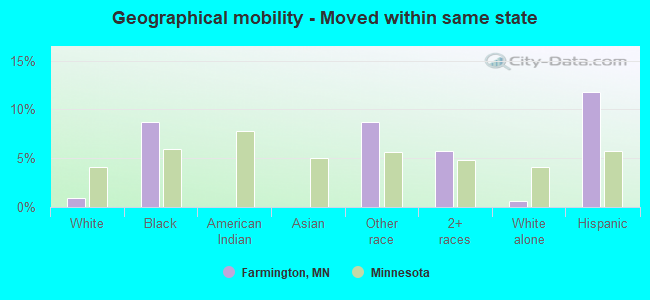
Geographical mobility - Moved from different county within same state (%)
Geographical mobility - Moved from different county within same state (%) - White
Geographical mobility - Moved from different county within same state (%) - Black or African American
Geographical mobility - Moved from different county within same state (%) - Asian
Geographical mobility - Moved from different county within same state (%) - Hispanic or Latino
Geographical mobility - Moved from different county within same state (%) - American Indian and Alaska Native
Geographical mobility - Moved from different county within same state (%) - Multirace
Geographical mobility - Moved from different county within same state (%) - Other Race
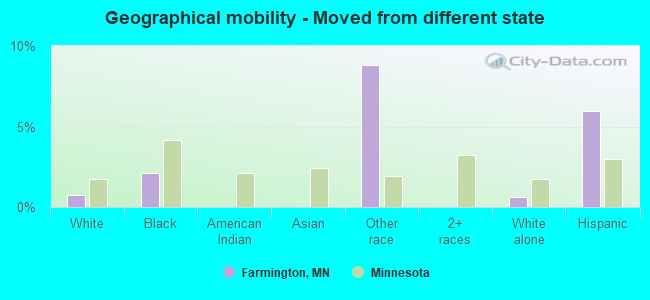
Geographical mobility - Moved from different state (%)
Geographical mobility - Moved from different state (%) - White
Geographical mobility - Moved from different state (%) - Black or African American
Geographical mobility - Moved from different state (%) - Asian
Geographical mobility - Moved from different state (%) - Hispanic or Latino
Geographical mobility - Moved from different state (%) - American Indian and Alaska Native
Geographical mobility - Moved from different state (%) - Multirace
Geographical mobility - Moved from different state (%) - Other Race
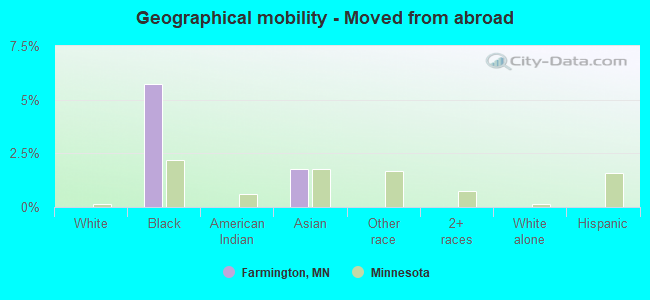
Geographical mobility - Moved from abroad (%)
Geographical mobility - Moved from abroad (%) - White
Geographical mobility - Moved from abroad (%) - Black or African American
Geographical mobility - Moved from abroad (%) - Asian
Geographical mobility - Moved from abroad (%) - Hispanic or Latino
Geographical mobility - Moved from abroad (%) - American Indian and Alaska Native
Geographical mobility - Moved from abroad (%) - Multirace
Geographical mobility - Moved from abroad (%) - Other Race
Place of birth for the foreign-born population - Ireland (%)
Place of birth for the foreign-born population - Denmark (%)
Place of birth for the foreign-born population - Norway (%)
Place of birth for the foreign-born population - Sweden (%)
Place of birth for the foreign-born population - United Kingdom (%)
Place of birth for the foreign-born population - England (%)
Place of birth for the foreign-born population - Scotland (%)
Place of birth for the foreign-born population - Other Northern Europe (%)
Place of birth for the foreign-born population - Austria (%)
Place of birth for the foreign-born population - Belgium (%)
Place of birth for the foreign-born population - France (%)
Place of birth for the foreign-born population - Germany (%)
Place of birth for the foreign-born population - Netherlands (%)
Place of birth for the foreign-born population - Switzerland (%)
Place of birth for the foreign-born population - Other Western Europe (%)
Place of birth for the foreign-born population - Greece (%)
Place of birth for the foreign-born population - Italy (%)
Place of birth for the foreign-born population - Portugal (%)
Place of birth for the foreign-born population - Spain (%)
Place of birth for the foreign-born population - Other Southern Europe (%)
Place of birth for the foreign-born population - Albania (%)
Place of birth for the foreign-born population - Belarus (%)
Place of birth for the foreign-born population - Bosnia and Herzegovina (%)
Place of birth for the foreign-born population - Bulgaria (%)
Place of birth for the foreign-born population - Croatia (%)
Place of birth for the foreign-born population - Czechoslovakia (%)
Place of birth for the foreign-born population - Hungary (%)
Place of birth for the foreign-born population - Latvia (%)
Place of birth for the foreign-born population - Lithuania (%)
Place of birth for the foreign-born population - North Macedonia (Macedonia) (%)
Place of birth for the foreign-born population - Moldova (%)
Place of birth for the foreign-born population - Poland (%)
Place of birth for the foreign-born population - Romania (%)
Place of birth for the foreign-born population - Russia (%)
Place of birth for the foreign-born population - Serbia (%)
Place of birth for the foreign-born population - Ukraine (%)
Place of birth for the foreign-born population - Other Eastern Europe (%)
Place of birth for the foreign-born population - China (%)
Place of birth for the foreign-born population - Hong Kong (%)
Place of birth for the foreign-born population - Taiwan (%)
Place of birth for the foreign-born population - Japan (%)
Place of birth for the foreign-born population - Korea (%)
Place of birth for the foreign-born population - Other Eastern Asia (%)
Place of birth for the foreign-born population - Afghanistan (%)
Place of birth for the foreign-born population - Bangladesh (%)
Place of birth for the foreign-born population - India (%)
Place of birth for the foreign-born population - Iran (%)
Place of birth for the foreign-born population - Kazakhstan (%)
Place of birth for the foreign-born population - Nepal (%)
Place of birth for the foreign-born population - Pakistan (%)
Place of birth for the foreign-born population - Sri Lanka (%)
Place of birth for the foreign-born population - Uzbekistan (%)
Place of birth for the foreign-born population - Other South Central Asia (%)
Place of birth for the foreign-born population - Burma (%)
Place of birth for the foreign-born population - Cambodia (%)
Place of birth for the foreign-born population - Indonesia (%)
Place of birth for the foreign-born population - Laos (%)
Place of birth for the foreign-born population - Malaysia (%)
Place of birth for the foreign-born population - Philippines (%)
Place of birth for the foreign-born population - Singapore (%)
Place of birth for the foreign-born population - Thailand (%)
Place of birth for the foreign-born population - Vietnam (%)
Place of birth for the foreign-born population - Other South Eastern Asia (%)
Place of birth for the foreign-born population - Armenia (%)
Place of birth for the foreign-born population - Iraq (%)
Place of birth for the foreign-born population - Israel (%)
Place of birth for the foreign-born population - Jordan (%)
Place of birth for the foreign-born population - Kuwait (%)
Place of birth for the foreign-born population - Lebanon (%)
Place of birth for the foreign-born population - Saudi Arabia (%)
Place of birth for the foreign-born population - Syria (%)
Place of birth for the foreign-born population - Turkey (%)
Place of birth for the foreign-born population - Yemen (%)
Place of birth for the foreign-born population - Other Western Asia (%)
Place of birth for the foreign-born population - Eritrea (%)
Place of birth for the foreign-born population - Ethiopia (%)
Place of birth for the foreign-born population - Kenya (%)
Place of birth for the foreign-born population - Somalia (%)
Place of birth for the foreign-born population - Uganda (%)
Place of birth for the foreign-born population - Zimbabwe (%)
Place of birth for the foreign-born population - Other Eastern Africa (%)
Place of birth for the foreign-born population - Cameroon (%)
Place of birth for the foreign-born population - Congo (%)
Place of birth for the foreign-born population - Democratic Republic of Congo (Zaire) (%)
Place of birth for the foreign-born population - Other Middle Africa (%)
Place of birth for the foreign-born population - Egypt (%)
Place of birth for the foreign-born population - Morocco (%)
Place of birth for the foreign-born population - Sudan (%)
Place of birth for the foreign-born population - Other Northern Africa (%)
Place of birth for the foreign-born population - South Africa (%)
Place of birth for the foreign-born population - Other Southern Africa (%)
Place of birth for the foreign-born population - Cabo Verde (%)
Place of birth for the foreign-born population - Ghana (%)
Place of birth for the foreign-born population - Liberia (%)
Place of birth for the foreign-born population - Nigeria (%)
Place of birth for the foreign-born population - Senegal (%)
Place of birth for the foreign-born population - Sierra Leone (%)
Place of birth for the foreign-born population - Other Western Africa (%)
Place of birth for the foreign-born population - Australia (%)
Place of birth for the foreign-born population - New Zealand (%)
Place of birth for the foreign-born population - Fiji (%)
Place of birth for the foreign-born population - Micronesia (%)
Place of birth for the foreign-born population - Bahamas (%)
Place of birth for the foreign-born population - Barbados (%)
Place of birth for the foreign-born population - Cuba (%)
Place of birth for the foreign-born population - Dominica (%)
Place of birth for the foreign-born population - Dominican Republic (%)
Place of birth for the foreign-born population - Grenada (%)
Place of birth for the foreign-born population - Haiti (%)
Place of birth for the foreign-born population - Jamaica (%)
Place of birth for the foreign-born population - St. Vincent and the Grenadines (%)
Place of birth for the foreign-born population - Trinidad and Tobago (%)
Place of birth for the foreign-born population - West Indies (%)
Place of birth for the foreign-born population - Other Caribbean (%)
Place of birth for the foreign-born population - Belize (%)
Place of birth for the foreign-born population - Costa Rica (%)
Place of birth for the foreign-born population - El Salvador (%)
Place of birth for the foreign-born population - Guatemala (%)
Place of birth for the foreign-born population - Honduras (%)
Place of birth for the foreign-born population - Mexico (%)
Place of birth for the foreign-born population - Nicaragua (%)
Place of birth for the foreign-born population - Panama (%)
Place of birth for the foreign-born population - Other Central America (%)
Place of birth for the foreign-born population - Argentina (%)
Place of birth for the foreign-born population - Bolivia (%)
Place of birth for the foreign-born population - Brazil (%)
Place of birth for the foreign-born population - Chile (%)
Place of birth for the foreign-born population - Colombia (%)
Place of birth for the foreign-born population - Ecuador (%)
Place of birth for the foreign-born population - Guyana (%)
Place of birth for the foreign-born population - Peru (%)
Place of birth for the foreign-born population - Uruguay (%)
Place of birth for the foreign-born population - Venezuela (%)
Place of birth for the foreign-born population - Other South America (%)
Place of birth for the foreign-born population - Canada (%)
Place of birth for the foreign-born population - Other Northern America (%)
Place of birth for the foreign-born population - Other (%)
Latest news about races in Farmington, MN collected exclusively by city-data.com from local newspapers, TV, and radio stations
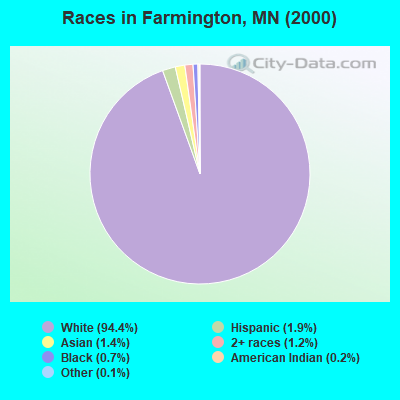
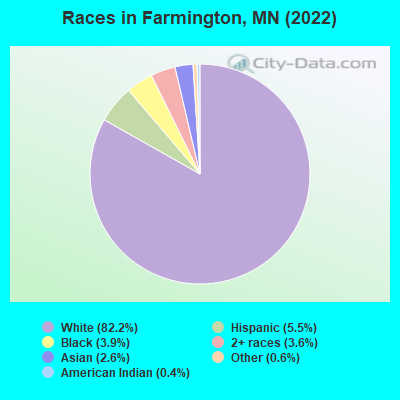
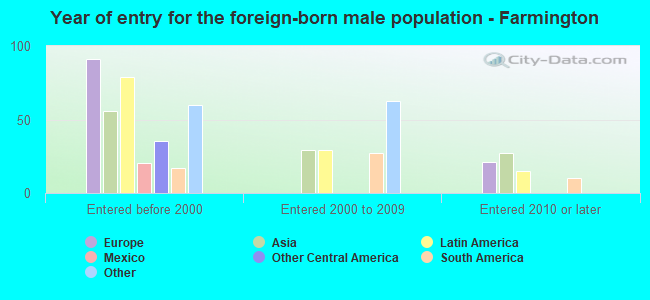
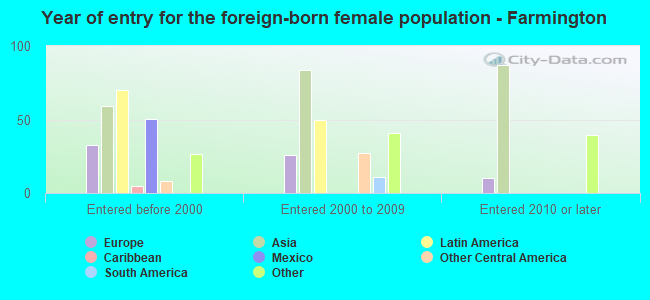
According to 2022 data, the most numerous races in Farmington, MN are White alone (19,496 residents), Black alone (931 residents), and Hispanic (1,302 residents). 92.9% of Farmington residents speak English at home. 4.7% of Farmington, MN residents are foreign-born (1.7% born in Asia, 1.0% born in Latin America, 1.0% born in Africa, 0.8% born in Europe), which is 71.5% less than the foreign-born rate of 8.0% across the entire state of Minnesota.
Race distribution in Farmington
2000 2022
4,337,143 88.2% White alone 168,813 3.4% Black alone 143,382 2.9% Hispanic 141,083 2.9% Asian alone 70,304 1.4% Two or more races 52,009 1.1% American Indian alone 5,031 0.1% Other race alone 1,714 0.03% Native Hawaiian and Other
4,356,347 76.2% White alone 395,179 6.9% Black alone 333,830 5.8% Hispanic 294,800 5.2% Asian alone 259,649 4.5% Two or more races 42,125 0.7% American Indian alone 32,976 0.6% Other race alone 2,278 0.04% Native Hawaiian and Other
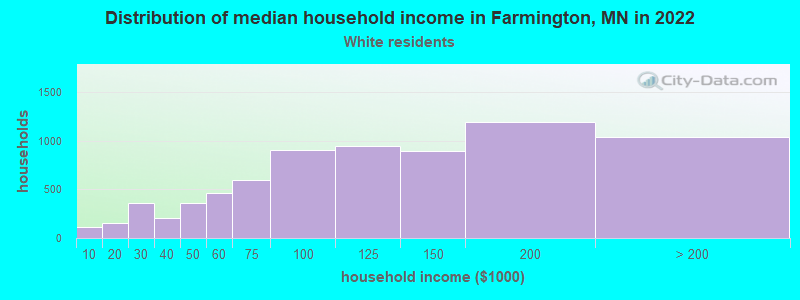
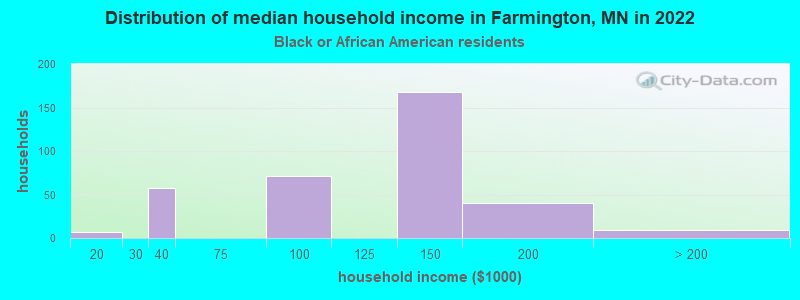
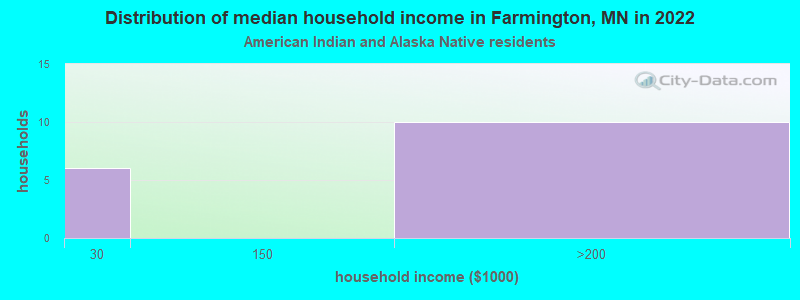
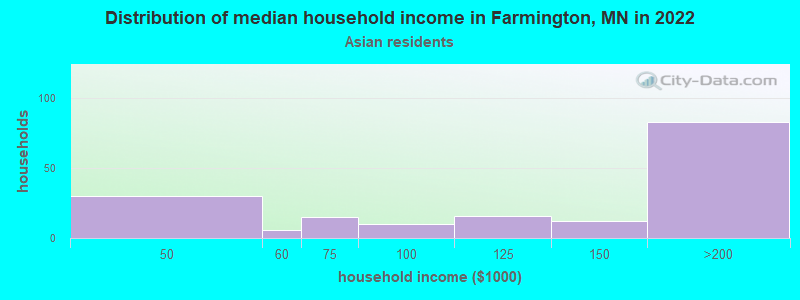
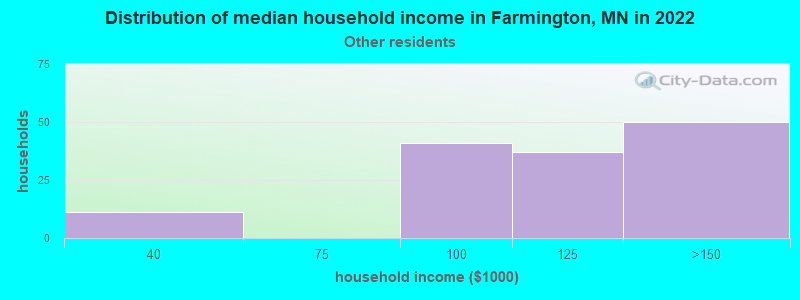
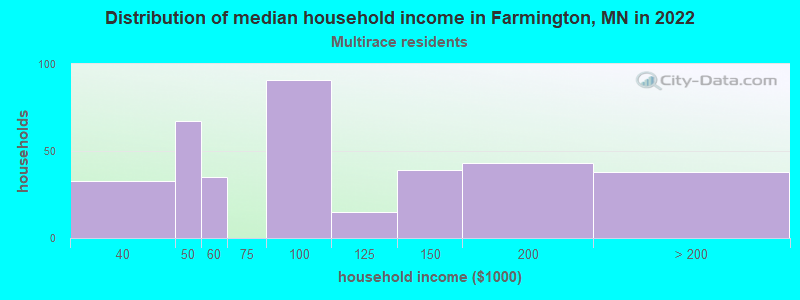
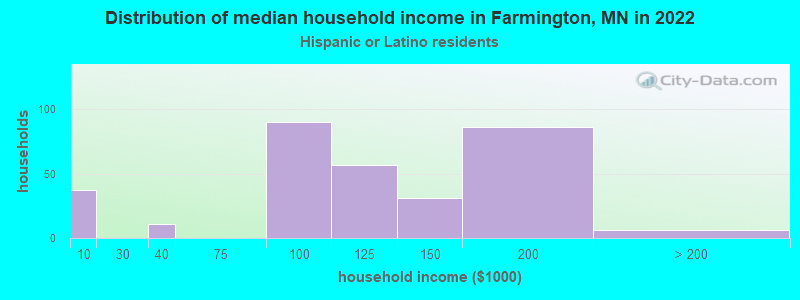
Income and house value in Farmington Median household income in 2022 $109,500 White non-Hispanic householders$144,889 Black householders$113,335 Asian householders$153,856 Some other race householders$97,710 Two or more races householders$121,543 Hispanic or Latino race householdersMedian 2022 house value $346,007 White Non-Hispanic householders$652,173 Black or African American householders $344,347 Asian householders$326,086 Some other race householders$456,047 Two or more races householders$327,509 Hispanic or Latino householders
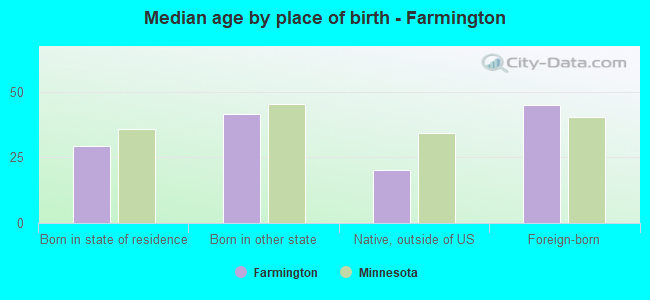
Median age by race in Farmington
36.7 Median age for White residents36.0 37.7 30.7 Median age for Black or African American residents26.1 35.8 29.5 Median age for American Indian / Alaska Native residents-664,429,529.5 -649,253,730.7 37.1 Median age for Asian residents18.5 38.9 -744,336,568.8 Median age for Native Hawaiian / Pacific Islander residents-856,799,036.4 -534,959,349.1 18.7 Median age for Other race residents32.3 7.7 33.7 Median age for Two or more races residents31.3 47.2 36.8 Median age for White alone residents36.2 37.5 27.0 Median age for Hispanic or Latino residents27.7 24.4
Owner/renter occupied households by race in Farmington
House owners and renters - White residents 6,157 84.8% Owner occupied1,102 15.2% Renter occupiedHouse owners and renters - Black or African American residents 253 88.5% Owner occupied33 11.5% Renter occupiedHouse owners and renters - American Indian / Alaska Native residents 13 70.1% Owner occupied6 29.9% Renter occupiedHouse owners and renters - Asian residents 136 86.3% Owner occupied22 13.7% Renter occupiedHouse owners and renters - Other race residents 145 84.0% Owner occupied28 16.0% Renter occupiedHouse owners and renters - Two or more races residents 322 85.8% Owner occupied53 14.2% Renter occupiedHouse owners and renters - White alone residents 6,095 84.5% Owner occupied1,119 15.5% Renter occupiedHouse owners and renters - Hispanic or Latino residents 302 88.0% Owner occupied41 12.0% Renter occupied
Language usage in Farmington
English speakers - Total 92.9% of residents of Farmington speak English at home.
3.2% of residents speak Spanish at home 212 30.6% Speak English very well481 69.4% Speak English less than very well4.0% of residents speak other language at home 665 75.1% Speak English very well221 24.9% Speak English less than very well
English speakers - Born in the United States 96.1% of residents of Farmington speak English at home.
3.5% of residents speak Spanish at home 73 37.8% Speak English very well120 62.2% Speak English less than very well0.3% of residents speak other language at home 18 100.0% Speak English very well
English speakers - Native, born elsewhere 62.3% of residents of Farmington speak English at home.
13.9% of residents speak Spanish at home 21 100.0% Speak English very well29.8% of residents speak other language at home 38 84.4% Speak English very well7 15.6% Speak English less than very well
English speakers - Foreign-born 24.5% of residents of Farmington speak English at home.
20.4% of residents speak Spanish at home 53 22.8% Speak English very well179 77.2% Speak English less than very well53.7% of residents speak other language at home 434 70.9% Speak English very well178 29.1% Speak English less than very well
White (Caucasian) - Speak only English Native:
98.9% (18,025)Foreign-born:
45.2% (95)
White (Caucasian) - Speak another language Native:
1.3% (232)Foreign-born:
55.1% (116)
Black or African American - Speak only English Native:
91.9% (698)Foreign-born:
26.4% (52)
Black or African American - Speak another language Native:
2.9% (22)Foreign-born:
73.2% (145)
Asian - Speak only English Native:
74.6% (135)Foreign-born:
19.1% (71)
Asian - Speak another language Native:
28.8% (52)Foreign-born:
80.9% (301)
Other race - Speak only English Native:
30.5% (89)Foreign-born:
11.7% (26)
Other race - Speak another language Native:
70.3% (205)Foreign-born:
88.0% (194)
Two or more races - Speak only English Native:
97.8% (904)Foreign-born:
26.0% (31)
Two or more races - Speak another language Native:
4.0% (37)Foreign-born:
59.0% (69)
White alone - Speak only English Native:
99.0% (17,833)Foreign-born:
38.9% (87)
White alone - Speak another language Native:
1.0% (189)Foreign-born:
59.8% (134)
Hispanic or Latino - Speak only English Native:
61.7% (470)Foreign-born:
9.9% (26)
Hispanic or Latino - Speak another language Native:
38.1% (290)Foreign-born:
89.2% (236)
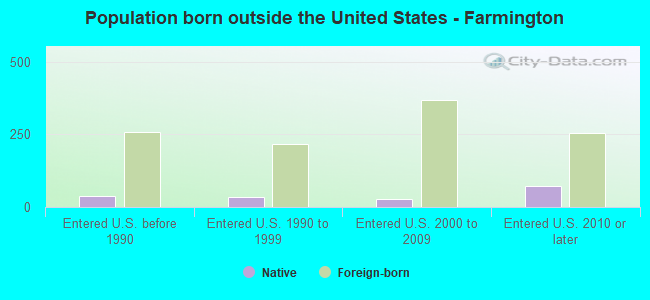
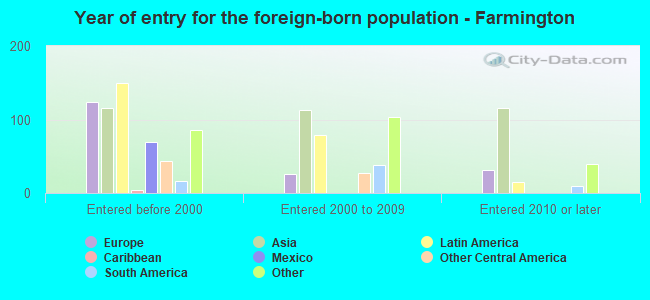
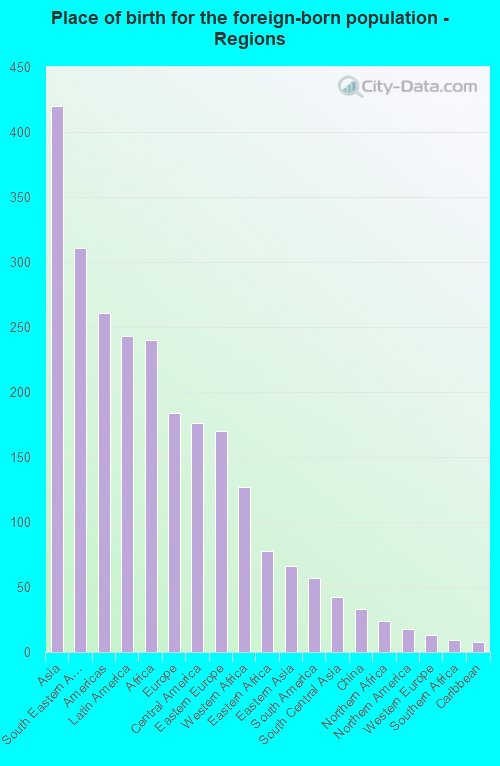
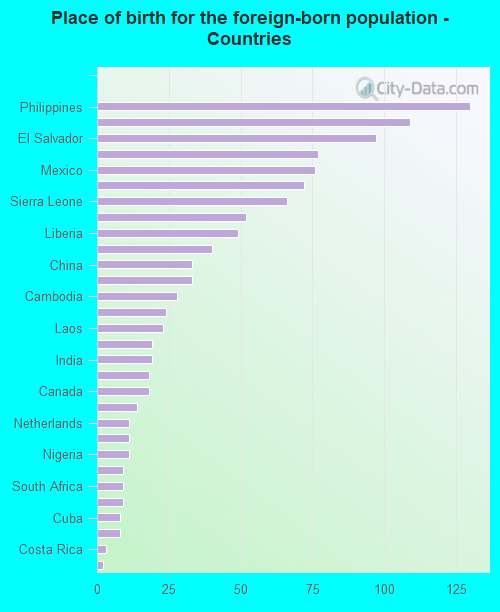
Foreign-born residents in Farmington 1,106 residents are foreign born (1.7% Asia , 1.0% Latin America , 1.0% Africa , 0.8% Europe ).
This city:
4.7%Minnesota:
8.5%
Marital status for residents in Farmington Marital status - White (Caucasian) population 15 years and over
Males 32.9% Never married56.2% Now married0.5% Separated1.7% Widowed8.7% DivorcedFemales 26.2% Never married52.5% Now married0.2% Separated6.6% Widowed14.5% DivorcedWomen who gave birth in the past 12 months Now married:
82.2% (187)Unmarried:
17.8% (40)
Women who did not give birth in the past 12 months Now married:
49.3% (2,134)Unmarried:
50.7% (2,195)
Marital status - Black or African American population 15 years and over
Males 42.6% Never married52.7% Now married0.3% Separated0.0% Widowed4.5% DivorcedFemales 7.1% Never married61.7% Now married0.0% Separated0.0% Widowed31.1% DivorcedWomen who did not give birth in the past 12 months Now married:
72.5% (138)Unmarried:
27.5% (53)
Marital status - American Indian / Alaska Native population 15 years and over
Males 100.0% Never married0.0% Now married0.0% Separated0.0% Widowed0.0% DivorcedFemales 0.0% Never married72.2% Now married0.0% Separated27.8% Widowed0.0% DivorcedMarital status - Asian population 15 years and over
Males 30.3% Never married69.7% Now married0.0% Separated0.0% Widowed0.0% DivorcedFemales 17.9% Never married79.7% Now married2.4% Separated0.0% Widowed0.0% DivorcedWomen who gave birth in the past 12 months Now married:
100.0% (41)Unmarried:
0.0% (0)
Women who did not give birth in the past 12 months Now married:
75.1% (151)Unmarried:
24.9% (50)
Marital status - Other race population 15 years and over
Males 46.5% Never married53.5% Now married0.0% Separated0.0% Widowed0.0% DivorcedFemales 67.2% Never married32.8% Now married0.0% Separated0.0% Widowed0.0% DivorcedWomen who gave birth in the past 12 months Now married:
100.0% (9)Unmarried:
0.0% (0)
Women who did not give birth in the past 12 months Now married:
17.0% (23)Unmarried:
83.0% (113)
Marital status - Two or more races population 15 years and over
Males 36.3% Never married54.6% Now married0.0% Separated1.4% Widowed7.7% DivorcedFemales 12.0% Never married79.4% Now married0.0% Separated0.4% Widowed8.2% DivorcedWomen who gave birth in the past 12 months Now married:
100.0% (26)Unmarried:
0.0% (0)
Women who did not give birth in the past 12 months Now married:
72.8% (162)Unmarried:
27.2% (60)
Marital status - White alone, not Hispanic / Latino population 15 years and over
Males 31.8% Never married56.9% Now married0.5% Separated1.8% Widowed9.0% DivorcedFemales 25.1% Never married53.1% Now married0.2% Separated6.7% Widowed14.8% DivorcedWomen who gave birth in the past 12 months Now married:
82.2% (192)Unmarried:
17.8% (41)
Women who did not give birth in the past 12 months Now married:
49.8% (2,174)Unmarried:
50.2% (2,188)
Marital status - Hispanic or Latino population 15 years and over
Males 60.2% Never married38.2% Now married0.0% Separated0.0% Widowed1.6% DivorcedFemales 58.3% Never married36.8% Now married0.0% Separated0.0% Widowed4.9% DivorcedWomen who gave birth in the past 12 months Now married:
100.0% (6)Unmarried:
0.0% (0)
Women who did not give birth in the past 12 months Now married:
31.8% (67)Unmarried:
68.2% (144)
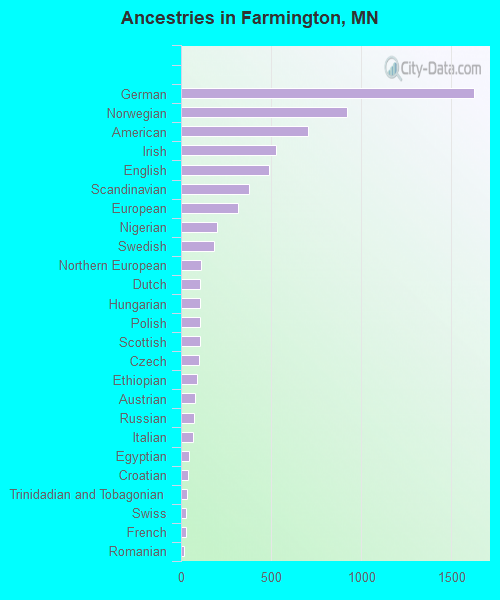
Ancestries in Farmington
1,627 19.3% German921 10.9% Norwegian704 8.4% American529 6.3% Irish489 5.8% English376 4.5% Scandinavian318 3.8% European202 2.4% Nigerian184 2.2% Swedish111 1.3% Northern European108 1.3% Dutch108 1.3% Hungarian106 1.3% Polish104 1.2% Scottish98 1.2% Czech88 1.0% Ethiopian77 0.9% Austrian71 0.8% Russian64 0.8% Italian46 0.5% Egyptian40 0.5% Croatian31 0.4% Trinidadian and Tobagonian28 0.3% Swiss27 0.3% French19 0.2% Romanian17 0.2% Czechoslovakian16 0.2% Finnish14 0.2% Ukrainian11 0.1% Estonian11 0.1% Danish10 0.1% African6 0.07% French Canadian4 0.05% Scotch-Irish4 0.05% Liberian
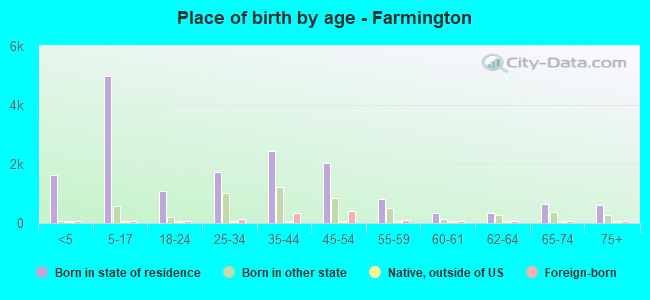
Children Nativity (place of birth) in Farmington
Children under 6 years - Living with two parents Both parents native 1,520 100.0% NativeBoth parents foreign-born 137 100.0% NativeOne native, one foreign-born parent 82 100.0% NativeChildren under 6 years - Living with one parent Native parent 311 100.0% NativeForeign-born parent 46 100.0% NativeChildren 6 to 17 years - Living with two parents Both parents native 2,974 100.0% NativeBoth parents foreign-born 209 100.0% NativeOne native, one foreign-born parent 243 100.0% NativeChildren 6 to 17 years - Living with one parent Native parent 1,418 100.0% NativeForeign-born parent 105 48.3% Native113 51.7% Foreign-born
Grandparents responsible for own grandchildren in Farmington
Grandparents (30 to 59 years) White / Caucasian 14 19.2% Responsible for grandchildren59 80.8% Not responsible for grandchildrenBlack or African American 17 100.0% Responsible for grandchildrenOther race 53 100.0% Not responsible for grandchildrenWhite alone, not Hispanic / Latino 15 18.6% Responsible for grandchildren64 81.4% Not responsible for grandchildrenHispanic or Latino 45 100.0% Not responsible for grandchildrenGrandparents (60 years and over) White / Caucasian 133 56.3% Responsible for grandchildren104 43.7% Not responsible for grandchildrenWhite alone, not Hispanic / Latino 133 55.5% Responsible for grandchildren107 44.5% Not responsible for grandchildren