Races in Federal Heights, Colorado (CO) Detailed Stats
Data:
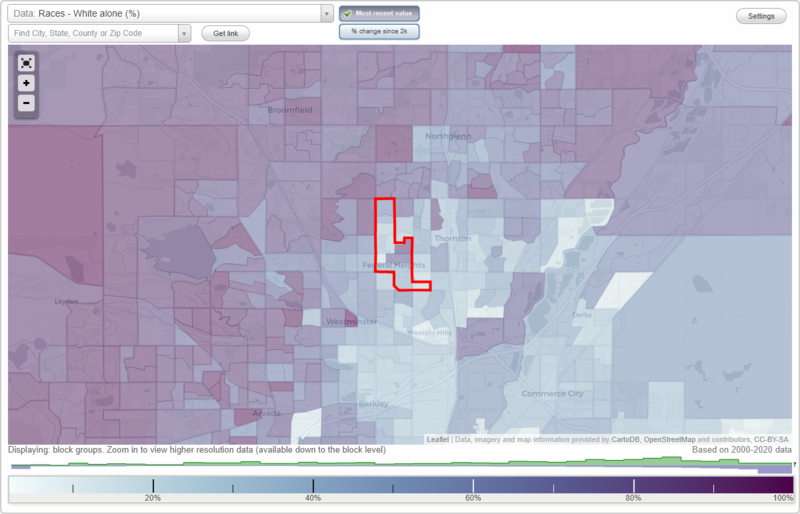
Races - White alone (%)
Races - White alone (% change since 2000)
Races - Black alone (%)
Races - Black alone (% change since 2000)
Races - American Indian alone (%)
Races - American Indian alone (% change since 2000)
Races - Asian alone (%)
Races - Asian alone (% change since 2000)
Races - Hispanic (%)
Races - Hispanic (% change since 2000)
Races - Native Hawaiian and Other Pacific Islander alone (%)
Races - Native Hawaiian and Other Pacific Islander alone (% change since 2000)
Races - Two or more races(%)
Races - Two or more races(% change since 2000)
Races - Other race alone (%)
Races - Other race alone (% change since 2000)
Racial diversity
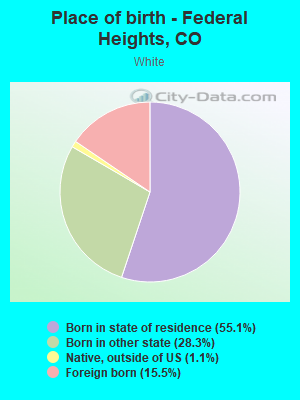
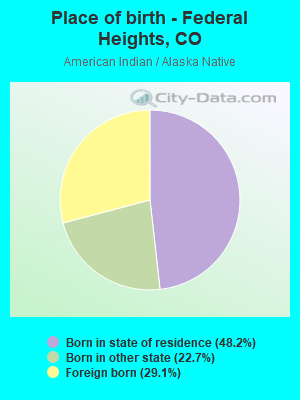
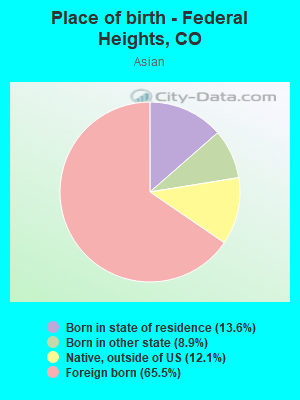
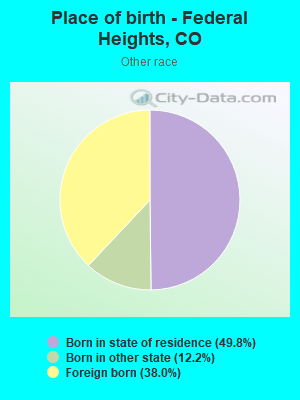
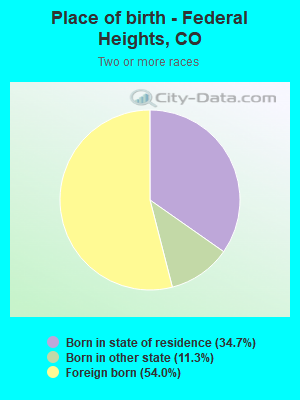
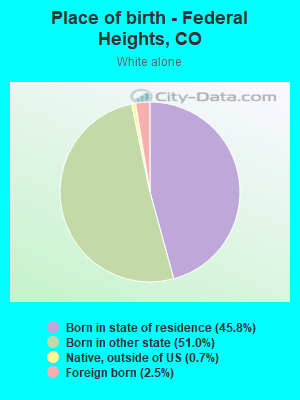
Place of birth - Born in state of residence (%)
Place of birth - Born in state of residence (%) - White
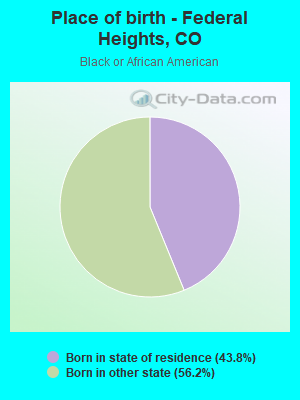
Place of birth - Born in state of residence (%) - Black or African American
Place of birth - Born in state of residence (%) - Asian
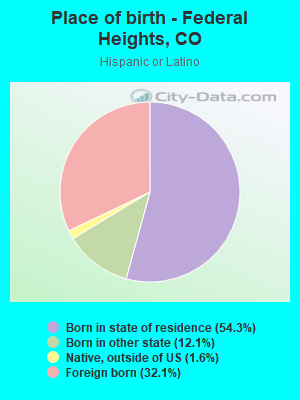
Place of birth - Born in state of residence (%) - Hispanic or Latino
Place of birth - Born in state of residence (%) - American Indian and Alaska Native
Place of birth - Born in state of residence (%) - Multirace
Place of birth - Born in state of residence (%) - Other Race
Place of birth - Born in other state (%)
Place of birth - Born in other state (%) - White
Place of birth - Born in other state (%) - Black or African American
Place of birth - Born in other state (%) - Asian
Place of birth - Born in other state (%) - Hispanic or Latino
Place of birth - Born in other state (%) - American Indian and Alaska Native
Place of birth - Born in other state (%) - Multirace
Place of birth - Born in other state (%) - Other Race
Place of birth - Native, outside of US (%)
Place of birth - Native, outside of US (%) - White
Place of birth - Native, outside of US (%) - Black or African American
Place of birth - Native, outside of US (%) - Asian
Place of birth - Native, outside of US (%) - Hispanic or Latino
Place of birth - Native, outside of US (%) - American Indian and Alaska Native
Place of birth - Native, outside of US (%) - Multirace
Place of birth - Native, outside of US (%) - Other Race
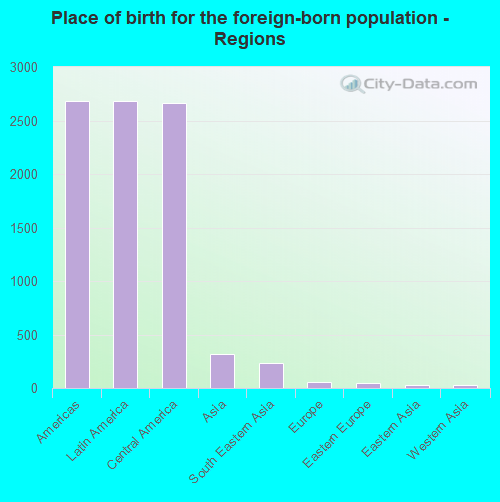
Place of birth - Foreign born (%)
Place of birth - Foreign born (%) - White
Place of birth - Foreign born (%) - Black or African American
Place of birth - Foreign born (%) - Asian
Place of birth - Foreign born (%) - Hispanic or Latino
Place of birth - Foreign born (%) - American Indian and Alaska Native
Place of birth - Foreign born (%) - Multirace
Place of birth - Foreign born (%) - Other Race
Residents speaking English at home (%)
Residents speaking English at home - Born in the United States (%)
Residents speaking English at home - Native, born elsewhere (%)
Residents speaking English at home - Foreign born (%)
Residents speaking Spanish at home (%)
Residents speaking Spanish at home - Born in the United States (%)
Residents speaking Spanish at home - Native, born elsewhere (%)
Residents speaking Spanish at home - Foreign born (%)
Residents speaking other language at home (%)
Residents speaking other language at home - Born in the United States (%)
Residents speaking other language at home - Native, born elsewhere (%)
Residents speaking other language at home - Foreign born (%)
Marital status - Never married (%)
Marital status - Now married (%)
Marital status - Separated (%)
Marital status - Widowed (%)
Marital status - Divorced (%)
Ancestries Reported - Arab (%)
Ancestries Reported - Czech (%)
Ancestries Reported - Danish (%)
Ancestries Reported - Dutch (%)
Ancestries Reported - English (%)
Ancestries Reported - French (%)
Ancestries Reported - French Canadian (%)
Ancestries Reported - German (%)
Ancestries Reported - Greek (%)
Ancestries Reported - Hungarian (%)
Ancestries Reported - Irish (%)
Ancestries Reported - Italian (%)
Ancestries Reported - Lithuanian (%)
Ancestries Reported - Norwegian (%)
Ancestries Reported - Polish (%)
Ancestries Reported - Portuguese (%)
Ancestries Reported - Russian (%)
Ancestries Reported - Scotch-Irish (%)
Ancestries Reported - Scottish (%)
Ancestries Reported - Slovak (%)
Ancestries Reported - Subsaharan African (%)
Ancestries Reported - Swedish (%)
Ancestries Reported - Swiss (%)
Ancestries Reported - Ukrainian (%)
Ancestries Reported - United States (%)
Ancestries Reported - Welsh (%)
Ancestries Reported - West Indian (%)
Ancestries Reported - Other (%)
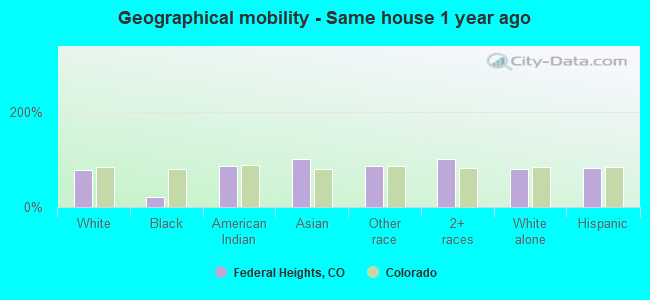
Geographical mobility - Same house 1 year ago (%)
Geographical mobility - Same house 1 year ago (%) - White
Geographical mobility - Same house 1 year ago (%) - Black or African American
Geographical mobility - Same house 1 year ago (%) - Asian
Geographical mobility - Same house 1 year ago (%) - Hispanic or Latino
Geographical mobility - Same house 1 year ago (%) - American Indian and Alaska Native
Geographical mobility - Same house 1 year ago (%) - Multirace
Geographical mobility - Same house 1 year ago (%) - Other Race
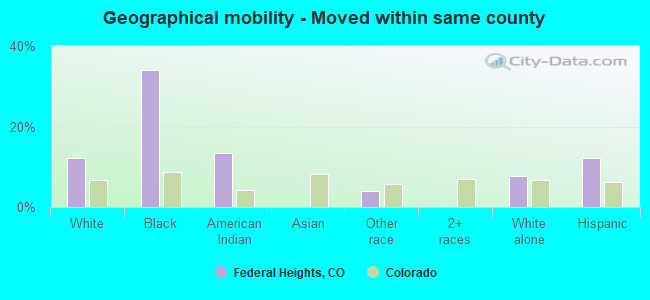
Geographical mobility - Moved within same county (%)
Geographical mobility - Moved within same county (%) - White
Geographical mobility - Moved within same county (%) - Black or African American
Geographical mobility - Moved within same county (%) - Asian
Geographical mobility - Moved within same county (%) - Hispanic or Latino
Geographical mobility - Moved within same county (%) - American Indian and Alaska Native
Geographical mobility - Moved within same county (%) - Multirace
Geographical mobility - Moved within same county (%) - Other Race
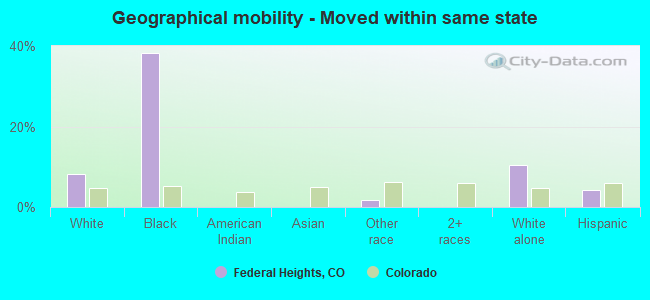
Geographical mobility - Moved from different county within same state (%)
Geographical mobility - Moved from different county within same state (%) - White
Geographical mobility - Moved from different county within same state (%) - Black or African American
Geographical mobility - Moved from different county within same state (%) - Asian
Geographical mobility - Moved from different county within same state (%) - Hispanic or Latino
Geographical mobility - Moved from different county within same state (%) - American Indian and Alaska Native
Geographical mobility - Moved from different county within same state (%) - Multirace
Geographical mobility - Moved from different county within same state (%) - Other Race
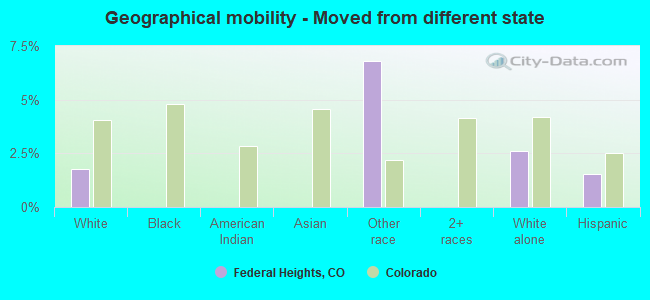
Geographical mobility - Moved from different state (%)
Geographical mobility - Moved from different state (%) - White
Geographical mobility - Moved from different state (%) - Black or African American
Geographical mobility - Moved from different state (%) - Asian
Geographical mobility - Moved from different state (%) - Hispanic or Latino
Geographical mobility - Moved from different state (%) - American Indian and Alaska Native
Geographical mobility - Moved from different state (%) - Multirace
Geographical mobility - Moved from different state (%) - Other Race
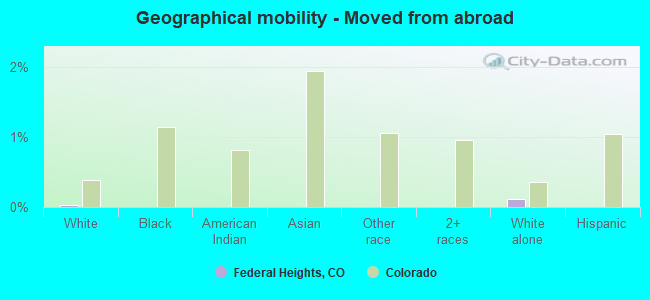
Geographical mobility - Moved from abroad (%)
Geographical mobility - Moved from abroad (%) - White
Geographical mobility - Moved from abroad (%) - Black or African American
Geographical mobility - Moved from abroad (%) - Asian
Geographical mobility - Moved from abroad (%) - Hispanic or Latino
Geographical mobility - Moved from abroad (%) - American Indian and Alaska Native
Geographical mobility - Moved from abroad (%) - Multirace
Geographical mobility - Moved from abroad (%) - Other Race
Place of birth for the foreign-born population - Ireland (%)
Place of birth for the foreign-born population - Denmark (%)
Place of birth for the foreign-born population - Norway (%)
Place of birth for the foreign-born population - Sweden (%)
Place of birth for the foreign-born population - United Kingdom (%)
Place of birth for the foreign-born population - England (%)
Place of birth for the foreign-born population - Scotland (%)
Place of birth for the foreign-born population - Other Northern Europe (%)
Place of birth for the foreign-born population - Austria (%)
Place of birth for the foreign-born population - Belgium (%)
Place of birth for the foreign-born population - France (%)
Place of birth for the foreign-born population - Germany (%)
Place of birth for the foreign-born population - Netherlands (%)
Place of birth for the foreign-born population - Switzerland (%)
Place of birth for the foreign-born population - Other Western Europe (%)
Place of birth for the foreign-born population - Greece (%)
Place of birth for the foreign-born population - Italy (%)
Place of birth for the foreign-born population - Portugal (%)
Place of birth for the foreign-born population - Spain (%)
Place of birth for the foreign-born population - Other Southern Europe (%)
Place of birth for the foreign-born population - Albania (%)
Place of birth for the foreign-born population - Belarus (%)
Place of birth for the foreign-born population - Bosnia and Herzegovina (%)
Place of birth for the foreign-born population - Bulgaria (%)
Place of birth for the foreign-born population - Croatia (%)
Place of birth for the foreign-born population - Czechoslovakia (%)
Place of birth for the foreign-born population - Hungary (%)
Place of birth for the foreign-born population - Latvia (%)
Place of birth for the foreign-born population - Lithuania (%)
Place of birth for the foreign-born population - North Macedonia (Macedonia) (%)
Place of birth for the foreign-born population - Moldova (%)
Place of birth for the foreign-born population - Poland (%)
Place of birth for the foreign-born population - Romania (%)
Place of birth for the foreign-born population - Russia (%)
Place of birth for the foreign-born population - Serbia (%)
Place of birth for the foreign-born population - Ukraine (%)
Place of birth for the foreign-born population - Other Eastern Europe (%)
Place of birth for the foreign-born population - China (%)
Place of birth for the foreign-born population - Hong Kong (%)
Place of birth for the foreign-born population - Taiwan (%)
Place of birth for the foreign-born population - Japan (%)
Place of birth for the foreign-born population - Korea (%)
Place of birth for the foreign-born population - Other Eastern Asia (%)
Place of birth for the foreign-born population - Afghanistan (%)
Place of birth for the foreign-born population - Bangladesh (%)
Place of birth for the foreign-born population - India (%)
Place of birth for the foreign-born population - Iran (%)
Place of birth for the foreign-born population - Kazakhstan (%)
Place of birth for the foreign-born population - Nepal (%)
Place of birth for the foreign-born population - Pakistan (%)
Place of birth for the foreign-born population - Sri Lanka (%)
Place of birth for the foreign-born population - Uzbekistan (%)
Place of birth for the foreign-born population - Other South Central Asia (%)
Place of birth for the foreign-born population - Burma (%)
Place of birth for the foreign-born population - Cambodia (%)
Place of birth for the foreign-born population - Indonesia (%)
Place of birth for the foreign-born population - Laos (%)
Place of birth for the foreign-born population - Malaysia (%)
Place of birth for the foreign-born population - Philippines (%)
Place of birth for the foreign-born population - Singapore (%)
Place of birth for the foreign-born population - Thailand (%)
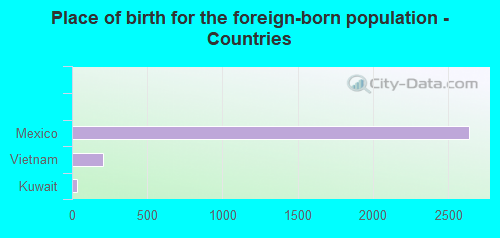
Place of birth for the foreign-born population - Vietnam (%)
Place of birth for the foreign-born population - Other South Eastern Asia (%)
Place of birth for the foreign-born population - Armenia (%)
Place of birth for the foreign-born population - Iraq (%)
Place of birth for the foreign-born population - Israel (%)
Place of birth for the foreign-born population - Jordan (%)
Place of birth for the foreign-born population - Kuwait (%)
Place of birth for the foreign-born population - Lebanon (%)
Place of birth for the foreign-born population - Saudi Arabia (%)
Place of birth for the foreign-born population - Syria (%)
Place of birth for the foreign-born population - Turkey (%)
Place of birth for the foreign-born population - Yemen (%)
Place of birth for the foreign-born population - Other Western Asia (%)
Place of birth for the foreign-born population - Eritrea (%)
Place of birth for the foreign-born population - Ethiopia (%)
Place of birth for the foreign-born population - Kenya (%)
Place of birth for the foreign-born population - Somalia (%)
Place of birth for the foreign-born population - Uganda (%)
Place of birth for the foreign-born population - Zimbabwe (%)
Place of birth for the foreign-born population - Other Eastern Africa (%)
Place of birth for the foreign-born population - Cameroon (%)
Place of birth for the foreign-born population - Congo (%)
Place of birth for the foreign-born population - Democratic Republic of Congo (Zaire) (%)
Place of birth for the foreign-born population - Other Middle Africa (%)
Place of birth for the foreign-born population - Egypt (%)
Place of birth for the foreign-born population - Morocco (%)
Place of birth for the foreign-born population - Sudan (%)
Place of birth for the foreign-born population - Other Northern Africa (%)
Place of birth for the foreign-born population - South Africa (%)
Place of birth for the foreign-born population - Other Southern Africa (%)
Place of birth for the foreign-born population - Cabo Verde (%)
Place of birth for the foreign-born population - Ghana (%)
Place of birth for the foreign-born population - Liberia (%)
Place of birth for the foreign-born population - Nigeria (%)
Place of birth for the foreign-born population - Senegal (%)
Place of birth for the foreign-born population - Sierra Leone (%)
Place of birth for the foreign-born population - Other Western Africa (%)
Place of birth for the foreign-born population - Australia (%)
Place of birth for the foreign-born population - New Zealand (%)
Place of birth for the foreign-born population - Fiji (%)
Place of birth for the foreign-born population - Micronesia (%)
Place of birth for the foreign-born population - Bahamas (%)
Place of birth for the foreign-born population - Barbados (%)
Place of birth for the foreign-born population - Cuba (%)
Place of birth for the foreign-born population - Dominica (%)
Place of birth for the foreign-born population - Dominican Republic (%)
Place of birth for the foreign-born population - Grenada (%)
Place of birth for the foreign-born population - Haiti (%)
Place of birth for the foreign-born population - Jamaica (%)
Place of birth for the foreign-born population - St. Vincent and the Grenadines (%)
Place of birth for the foreign-born population - Trinidad and Tobago (%)
Place of birth for the foreign-born population - West Indies (%)
Place of birth for the foreign-born population - Other Caribbean (%)
Place of birth for the foreign-born population - Belize (%)
Place of birth for the foreign-born population - Costa Rica (%)
Place of birth for the foreign-born population - El Salvador (%)
Place of birth for the foreign-born population - Guatemala (%)
Place of birth for the foreign-born population - Honduras (%)
Place of birth for the foreign-born population - Mexico (%)
Place of birth for the foreign-born population - Nicaragua (%)
Place of birth for the foreign-born population - Panama (%)
Place of birth for the foreign-born population - Other Central America (%)
Place of birth for the foreign-born population - Argentina (%)
Place of birth for the foreign-born population - Bolivia (%)
Place of birth for the foreign-born population - Brazil (%)
Place of birth for the foreign-born population - Chile (%)
Place of birth for the foreign-born population - Colombia (%)
Place of birth for the foreign-born population - Ecuador (%)
Place of birth for the foreign-born population - Guyana (%)
Place of birth for the foreign-born population - Peru (%)
Place of birth for the foreign-born population - Uruguay (%)
Place of birth for the foreign-born population - Venezuela (%)
Place of birth for the foreign-born population - Other South America (%)
Place of birth for the foreign-born population - Canada (%)
Place of birth for the foreign-born population - Other Northern America (%)
Place of birth for the foreign-born population - Other (%)
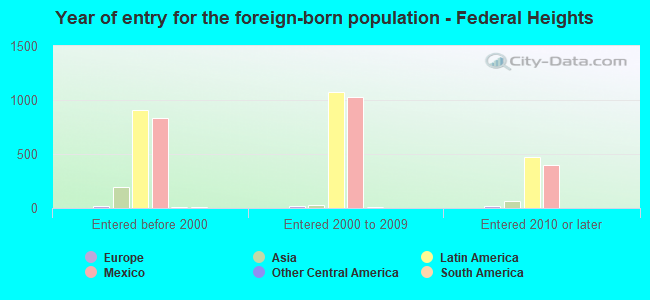
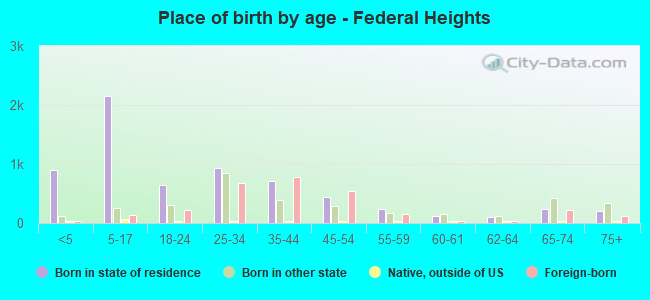
According to 2022 data, the most numerous races in Federal Heights, CO are White alone (4,173 residents), Hispanic (8,793 residents), and Two or more races (169 residents). 53.0% of Federal Heights residents speak English at home. 22.7% of Federal Heights, CO residents are foreign-born (20.5% born in Latin America, 2.4% born in Asia), which is 60.3% greater than the foreign-born rate of 9.0% across the entire state of Colorado.
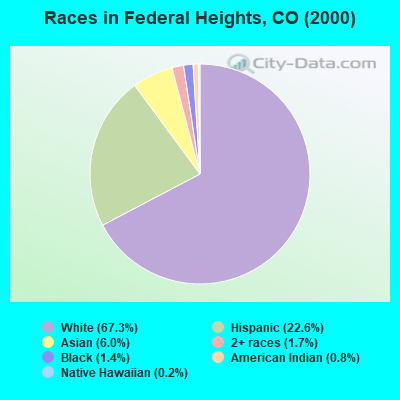
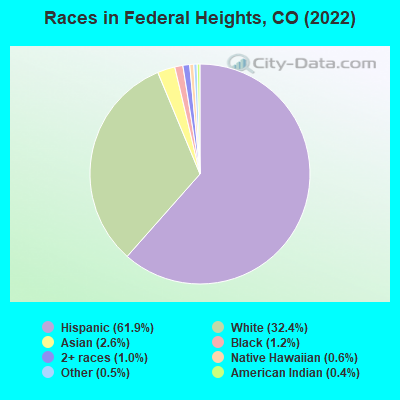
Race distribution in Federal Heights
2000 2022
3,202,880 74.5% White alone 735,601 17.1% Hispanic 158,443 3.7% Black alone 93,277 2.2% Asian alone 72,721 1.7% Two or more races 28,982 0.7% American Indian alone 5,512 0.1% Other race alone 3,845 0.09% Native Hawaiian and Other
3,793,270 65.0% White alone 1,314,962 22.5% Hispanic 268,754 4.6% Two or more races 220,756 3.8% Black alone 182,658 3.1% Asian alone 29,798 0.5% Other race alone 23,389 0.4% American Indian alone 6,339 0.1% Native Hawaiian and Other
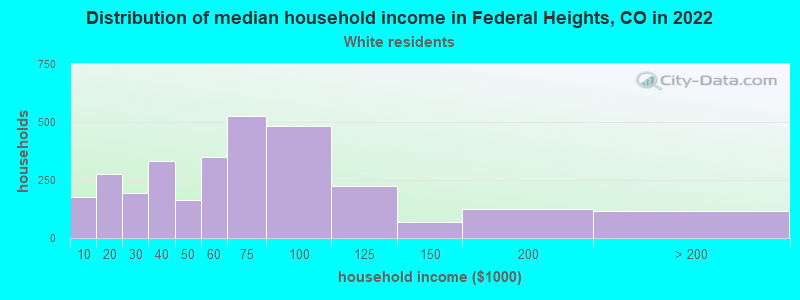
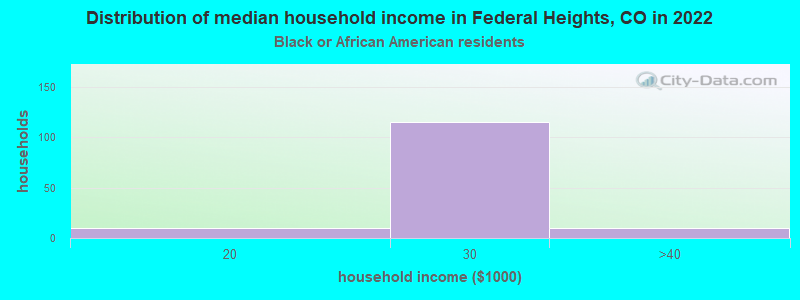
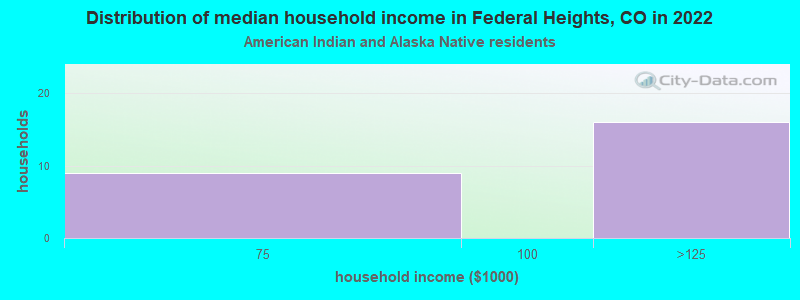
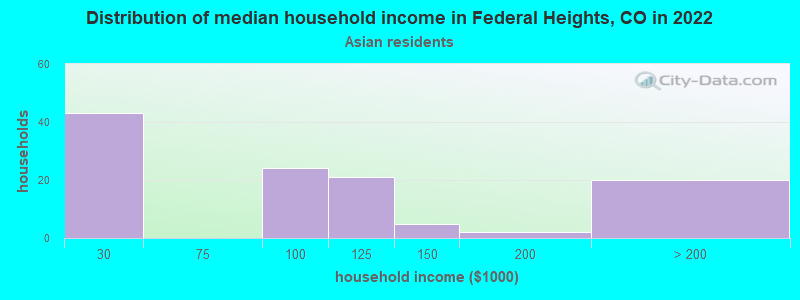
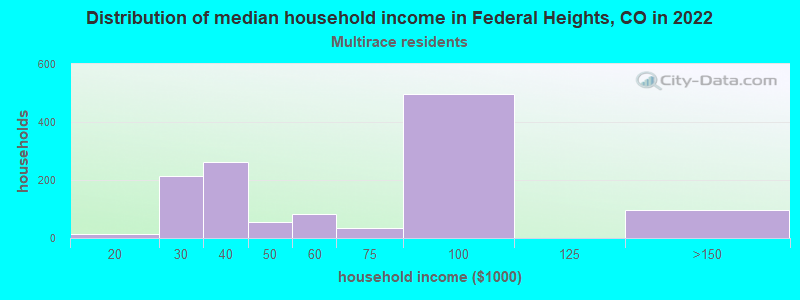
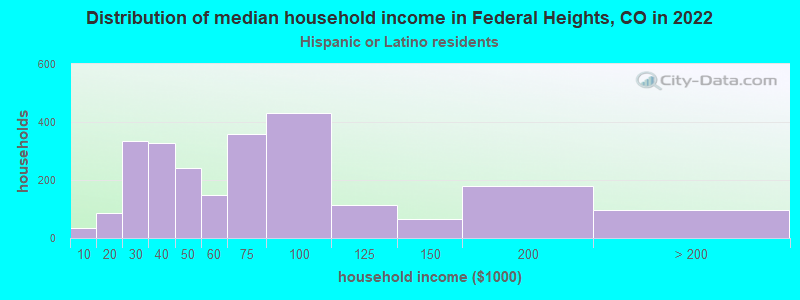
Income and house value in Federal Heights Median household income in 2022 $58,892 White non-Hispanic householders$23,585 Black householders$87,250 American Indian and Alaska Native householders$52,220 Asian householders$47,317 Native Hawaiian and other Pacific Islander householders$48,701 Some other race householders$83,987 Two or more races householders$59,313 Hispanic or Latino race householdersMedian 2022 house value $462,431 White Non-Hispanic householders$315,143 American Indian or Alaska Native householders $547,023 Asian householders$487,975 Some other race householders$357,273 Two or more races householders$482,335 Hispanic or Latino householders
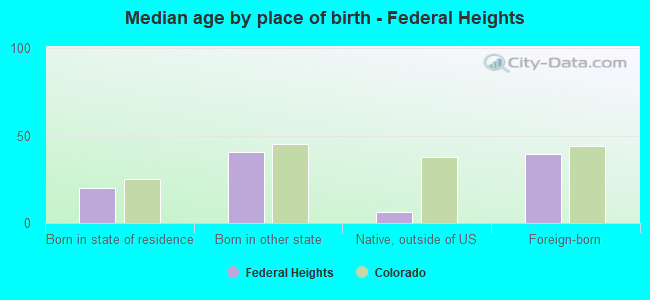
Median age by race in Federal Heights
32.0 Median age for White residents31.7 32.8 35.2 Median age for Black or African American residents28.0 49.5 36.9 Median age for American Indian / Alaska Native residents36.5 35.8 34.4 Median age for Asian residents34.5 33.1 34.3 Median age for Other race residents34.9 29.1 47.9 Median age for Two or more races residents33.1 55.0 44.3 Median age for White alone residents38.5 50.2 26.2 Median age for Hispanic or Latino residents26.8 24.2
Owner/renter occupied households by race in Federal Heights
House owners and renters - White residents 1,980 53.7% Owner occupied1,710 46.3% Renter occupiedHouse owners and renters - Black or African American residents 36 50.4% Owner occupied36 49.6% Renter occupiedHouse owners and renters - American Indian / Alaska Native residents 24 100.0% Owner occupiedHouse owners and renters - Asian residents 121 91.7% Owner occupied11 8.3% Renter occupiedHouse owners and renters - Other race residents 263 68.6% Owner occupied120 31.4% Renter occupiedHouse owners and renters - Two or more races residents 418 73.1% Owner occupied154 26.9% Renter occupiedHouse owners and renters - White alone residents 1,247 58.5% Owner occupied883 41.5% Renter occupiedHouse owners and renters - Hispanic or Latino residents 1,214 52.5% Owner occupied1,100 47.5% Renter occupied
Language usage in Federal Heights
English speakers - Total 53.0% of residents of Federal Heights speak English at home.
41.2% of residents speak Spanish at home 2,920 59.2% Speak English very well2,011 40.8% Speak English less than very well3.7% of residents speak other language at home 272 62.0% Speak English very well167 38.0% Speak English less than very well
English speakers - Born in the United States 80.8% of residents of Federal Heights speak English at home.
18.5% of residents speak Spanish at home 525 90.5% Speak English very well55 9.5% Speak English less than very well0.7% of residents speak other language at home 21 100.0% Speak English very well
English speakers - Native, born elsewhere 49.1% of residents of Federal Heights speak English at home.
38.7% of residents speak other language at home 41 100.0% Speak English less than very well
English speakers - Foreign-born 3.8% of residents of Federal Heights speak English at home.
81.9% of residents speak Spanish at home 731 29.8% Speak English very well1,723 70.2% Speak English less than very well10.6% of residents speak other language at home 199 62.8% Speak English very well118 37.2% Speak English less than very well
White (Caucasian) - Speak only English Native:
70.9% (5,284)Foreign-born:
6.2% (92)
White (Caucasian) - Speak another language Native:
23.3% (1,739)Foreign-born:
84.5% (1,252)
Asian - Speak only English Native:
24.5% (38)Foreign-born:
7.7% (21)
Asian - Speak another language Native:
81.9% (128)Foreign-born:
88.3% (238)
Other race - Speak only English Native:
46.6% (220)Foreign-born:
11.7% (34)
Other race - Speak another language Native:
52.8% (249)Foreign-born:
89.4% (259)
Two or more races - Speak another language Native:
100.0% (778)Foreign-born:
100.0% (911)
White alone - Speak only English Native:
98.3% (3,781)Foreign-born:
44.8% (51)
White alone - Speak another language Native:
1.5% (59)Foreign-born:
55.6% (63)
Hispanic or Latino - Speak only English Native:
42.7% (2,231)Foreign-born:
3.2% (80)
Hispanic or Latino - Speak another language Native:
56.6% (2,957)Foreign-born:
95.0% (2,385)
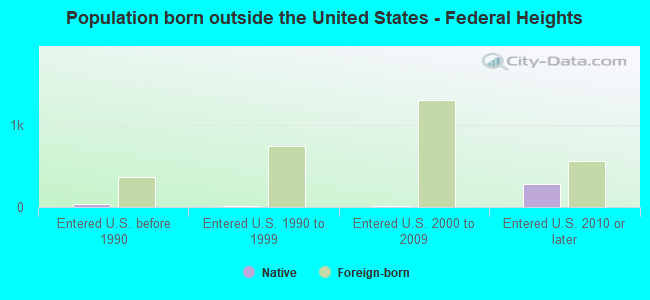
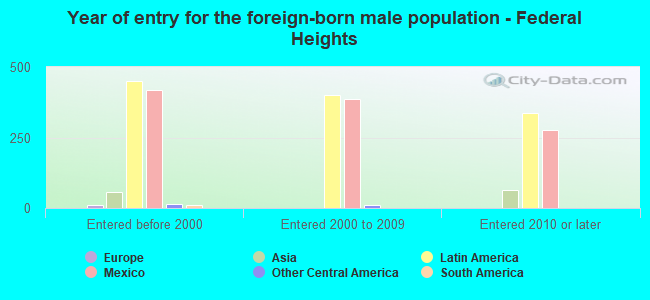
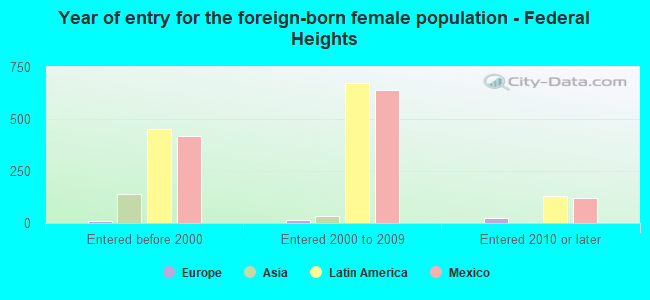
Foreign-born residents in Federal Heights 3,050 residents are foreign born (20.5% Latin America , 2.4% Asia ).
This city:
22.7%Colorado:
100.0%
Marital status for residents in Federal Heights Marital status - White (Caucasian) population 15 years and over
Males 44.1% Never married41.9% Now married0.6% Separated2.4% Widowed11.0% DivorcedFemales 30.5% Never married38.4% Now married4.9% Separated10.0% Widowed16.3% DivorcedWomen who gave birth in the past 12 months Now married:
66.9% (150)Unmarried:
33.1% (74)
Women who did not give birth in the past 12 months Now married:
38.9% (901)Unmarried:
61.1% (1,414)
Marital status - Black or African American population 15 years and over
Males 55.1% Never married4.3% Now married0.0% Separated40.6% Widowed0.0% DivorcedFemales 26.7% Never married26.7% Now married0.0% Separated0.0% Widowed46.7% DivorcedWomen who did not give birth in the past 12 months Now married:
26.7% (12)Unmarried:
73.3% (34)
Marital status - American Indian / Alaska Native population 15 years and over
Males 20.0% Never married28.8% Now married0.0% Separated0.0% Widowed51.2% DivorcedFemales 43.8% Never married56.3% Now married0.0% Separated0.0% Widowed0.0% DivorcedWomen who did not give birth in the past 12 months Now married:
56.3% (17)Unmarried:
43.8% (13)
Marital status - Asian population 15 years and over
Males 16.2% Never married73.8% Now married5.4% Separated0.0% Widowed4.6% DivorcedFemales 26.3% Never married48.5% Now married0.0% Separated14.1% Widowed11.1% DivorcedWomen who did not give birth in the past 12 months Now married:
56.9% (97)Unmarried:
43.1% (74)
Marital status - Other race population 15 years and over
Males 31.5% Never married53.9% Now married1.3% Separated0.0% Widowed13.2% DivorcedFemales 24.9% Never married32.5% Now married5.6% Separated14.7% Widowed22.3% DivorcedWomen who gave birth in the past 12 months Now married:
72.7% (33)Unmarried:
27.3% (12)
Women who did not give birth in the past 12 months Now married:
38.6% (60)Unmarried:
61.4% (95)
Marital status - Two or more races population 15 years and over
Males 56.1% Never married43.9% Now married0.0% Separated0.0% Widowed0.0% DivorcedFemales 32.0% Never married35.4% Now married0.0% Separated22.4% Widowed10.2% DivorcedWomen who did not give birth in the past 12 months Now married:
37.4% (176)Unmarried:
62.6% (295)
Marital status - White alone, not Hispanic / Latino population 15 years and over
Males 37.4% Never married43.2% Now married0.5% Separated2.6% Widowed16.3% DivorcedFemales 24.5% Never married39.5% Now married1.9% Separated11.0% Widowed23.2% DivorcedWomen who gave birth in the past 12 months Now married:
67.6% (48)Unmarried:
32.4% (23)
Women who did not give birth in the past 12 months Now married:
29.6% (234)Unmarried:
70.4% (558)
Marital status - Hispanic or Latino population 15 years and over
Males 46.9% Never married42.7% Now married0.7% Separated1.9% Widowed7.8% DivorcedFemales 34.0% Never married37.8% Now married6.7% Separated10.3% Widowed11.2% DivorcedWomen who gave birth in the past 12 months Now married:
67.6% (153)Unmarried:
32.4% (73)
Women who did not give birth in the past 12 months Now married:
43.8% (937)Unmarried:
56.2% (1,201)
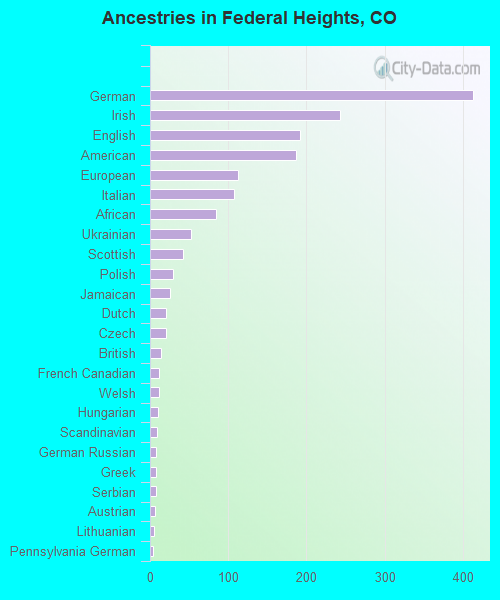
Ancestries in Federal Heights
323 4.4% German177 2.4% Irish151 2.0% English125 1.7% American83 1.1% European44 0.6% Polish42 0.6% Scottish41 0.6% Italian27 0.4% African26 0.4% Arab21 0.3% Norwegian19 0.3% Czechoslovakian13 0.2% Czech13 0.2% Hungarian12 0.2% Slovene10 0.1% Scandinavian8 0.1% Pennsylvania German7 0.09% Welsh6 0.08% Lithuanian5 0.07% Austrian5 0.07% British5 0.07% German Russian4 0.05% French3 0.04% Dutch3 0.04% Scotch-Irish
Geographical mobility in Federal Heights Same house 1 year ago 7,944 78.2% White (Caucasian)31 19.9% Black or African American118 85.1% American Indian / Alaska Native421 99.5% Asian684 85.2% Other race989 100.0% Two or more races3,238 79.1% White alone, not Hispanic / Latino6,655 81.2% Hispanic or LatinoMoved within same county 1,227 12.1% White / Caucasian54 34.0% Black or African American19 13.4% American Indian / Alaska Native33 4.1% Other race318 7.8% White alone, not Hispanic / Latino1,004 12.3% Hispanic or LatinoMoved within same state 831 8.2% White / Caucasian61 38.4% Black or African American13 1.6% Other race424 10.4% White alone, not Hispanic / Latino351 4.3% Hispanic or LatinoMoved from different state 181 1.8% White / Caucasian55 6.8% Other race106 2.6% White alone, not Hispanic / Latino125 1.5% Hispanic or LatinoMoved from abroad 3 0.0% White5 0.1% White alone, not Hispanic / Latino
Children Nativity (place of birth) in Federal Heights
Children under 6 years - Living with two parents Both parents native 261 100.0% NativeBoth parents foreign-born 271 100.0% NativeOne native, one foreign-born parent 196 100.0% NativeChildren under 6 years - Living with one parent Native parent 510 100.0% NativeForeign-born parent 24 62.2% Native15 37.8% Foreign-bornChildren 6 to 17 years - Living with two parents Both parents native 407 99.7% Native1 0.3% Foreign-bornBoth parents foreign-born 326 73.5% Native118 26.5% Foreign-bornOne native, one foreign-born parent 310 100.0% NativeChildren 6 to 17 years - Living with one parent Native parent 728 100.0% NativeForeign-born parent 366 51.2% Native349 48.8% Foreign-born
Grandparents responsible for own grandchildren in Federal Heights
Grandparents (30 to 59 years) White / Caucasian 97 50.7% Responsible for grandchildren95 49.3% Not responsible for grandchildrenAsian 55 100.0% Not responsible for grandchildrenWhite alone, not Hispanic / Latino 16 33.9% Responsible for grandchildren31 66.1% Not responsible for grandchildrenHispanic or Latino 117 51.4% Responsible for grandchildren110 48.6% Not responsible for grandchildrenGrandparents (60 years and over) White / Caucasian 169 51.9% Responsible for grandchildren157 48.1% Not responsible for grandchildrenAsian 10 100.0% Not responsible for grandchildrenWhite alone, not Hispanic / Latino 119 71.8% Responsible for grandchildren47 28.2% Not responsible for grandchildrenHispanic or Latino 151 61.0% Responsible for grandchildren97 39.0% Not responsible for grandchildren