Races in Felida, Washington (WA) Detailed Stats
Data:
Races - White alone (%)
Races - White alone (% change since 2000)
Races - Black alone (%)
Races - Black alone (% change since 2000)
Races - American Indian alone (%)
Races - American Indian alone (% change since 2000)
Races - Asian alone (%)
Races - Asian alone (% change since 2000)
Races - Hispanic (%)
Races - Hispanic (% change since 2000)
Races - Native Hawaiian and Other Pacific Islander alone (%)
Races - Native Hawaiian and Other Pacific Islander alone (% change since 2000)
Races - Two or more races(%)
Races - Two or more races(% change since 2000)
Races - Other race alone (%)
Races - Other race alone (% change since 2000)
Racial diversity
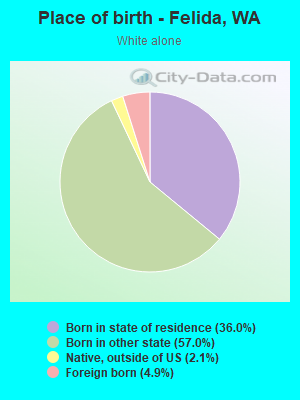
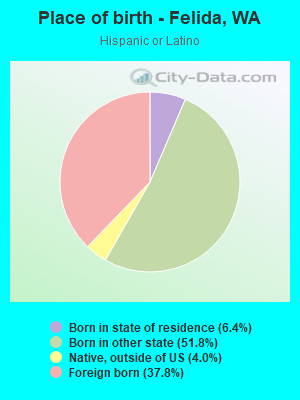
Place of birth - Born in state of residence (%)
Place of birth - Born in state of residence (%) - White
Place of birth - Born in state of residence (%) - Black or African American
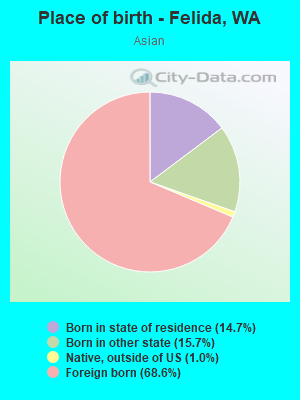
Place of birth - Born in state of residence (%) - Asian
Place of birth - Born in state of residence (%) - Hispanic or Latino
Place of birth - Born in state of residence (%) - American Indian and Alaska Native
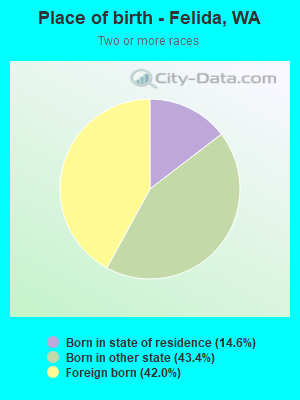
Place of birth - Born in state of residence (%) - Multirace
Place of birth - Born in state of residence (%) - Other Race
Place of birth - Born in other state (%)
Place of birth - Born in other state (%) - White
Place of birth - Born in other state (%) - Black or African American
Place of birth - Born in other state (%) - Asian
Place of birth - Born in other state (%) - Hispanic or Latino
Place of birth - Born in other state (%) - American Indian and Alaska Native
Place of birth - Born in other state (%) - Multirace
Place of birth - Born in other state (%) - Other Race
Place of birth - Native, outside of US (%)
Place of birth - Native, outside of US (%) - White
Place of birth - Native, outside of US (%) - Black or African American
Place of birth - Native, outside of US (%) - Asian
Place of birth - Native, outside of US (%) - Hispanic or Latino
Place of birth - Native, outside of US (%) - American Indian and Alaska Native
Place of birth - Native, outside of US (%) - Multirace
Place of birth - Native, outside of US (%) - Other Race
Place of birth - Foreign born (%)
Place of birth - Foreign born (%) - White
Place of birth - Foreign born (%) - Black or African American
Place of birth - Foreign born (%) - Asian
Place of birth - Foreign born (%) - Hispanic or Latino
Place of birth - Foreign born (%) - American Indian and Alaska Native
Place of birth - Foreign born (%) - Multirace
Place of birth - Foreign born (%) - Other Race
Residents speaking English at home (%)
Residents speaking English at home - Born in the United States (%)
Residents speaking English at home - Native, born elsewhere (%)
Residents speaking English at home - Foreign born (%)
Residents speaking Spanish at home (%)
Residents speaking Spanish at home - Born in the United States (%)
Residents speaking Spanish at home - Native, born elsewhere (%)
Residents speaking Spanish at home - Foreign born (%)
Residents speaking other language at home (%)
Residents speaking other language at home - Born in the United States (%)
Residents speaking other language at home - Native, born elsewhere (%)
Residents speaking other language at home - Foreign born (%)
Marital status - Never married (%)
Marital status - Now married (%)
Marital status - Separated (%)
Marital status - Widowed (%)
Marital status - Divorced (%)
Ancestries Reported - Arab (%)
Ancestries Reported - Czech (%)
Ancestries Reported - Danish (%)
Ancestries Reported - Dutch (%)
Ancestries Reported - English (%)
Ancestries Reported - French (%)
Ancestries Reported - French Canadian (%)
Ancestries Reported - German (%)
Ancestries Reported - Greek (%)
Ancestries Reported - Hungarian (%)
Ancestries Reported - Irish (%)
Ancestries Reported - Italian (%)
Ancestries Reported - Lithuanian (%)
Ancestries Reported - Norwegian (%)
Ancestries Reported - Polish (%)
Ancestries Reported - Portuguese (%)
Ancestries Reported - Russian (%)
Ancestries Reported - Scotch-Irish (%)
Ancestries Reported - Scottish (%)
Ancestries Reported - Slovak (%)
Ancestries Reported - Subsaharan African (%)
Ancestries Reported - Swedish (%)
Ancestries Reported - Swiss (%)
Ancestries Reported - Ukrainian (%)
Ancestries Reported - United States (%)
Ancestries Reported - Welsh (%)
Ancestries Reported - West Indian (%)
Ancestries Reported - Other (%)
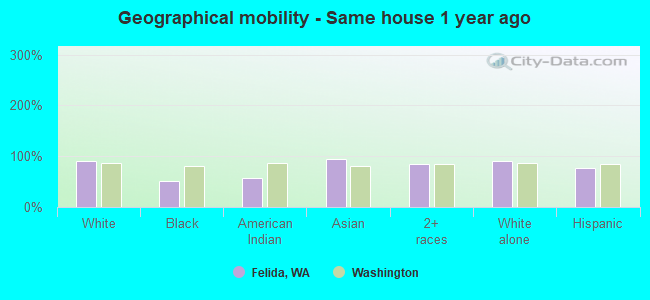
Geographical mobility - Same house 1 year ago (%)
Geographical mobility - Same house 1 year ago (%) - White
Geographical mobility - Same house 1 year ago (%) - Black or African American
Geographical mobility - Same house 1 year ago (%) - Asian
Geographical mobility - Same house 1 year ago (%) - Hispanic or Latino
Geographical mobility - Same house 1 year ago (%) - American Indian and Alaska Native
Geographical mobility - Same house 1 year ago (%) - Multirace
Geographical mobility - Same house 1 year ago (%) - Other Race
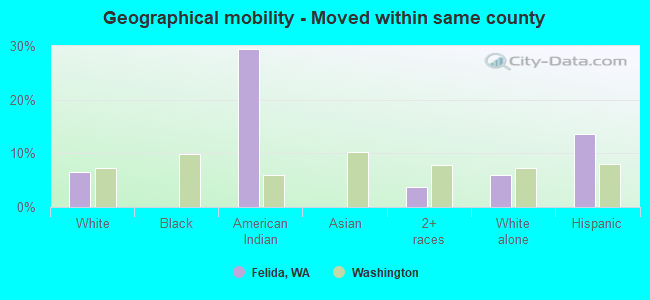
Geographical mobility - Moved within same county (%)
Geographical mobility - Moved within same county (%) - White
Geographical mobility - Moved within same county (%) - Black or African American
Geographical mobility - Moved within same county (%) - Asian
Geographical mobility - Moved within same county (%) - Hispanic or Latino
Geographical mobility - Moved within same county (%) - American Indian and Alaska Native
Geographical mobility - Moved within same county (%) - Multirace
Geographical mobility - Moved within same county (%) - Other Race
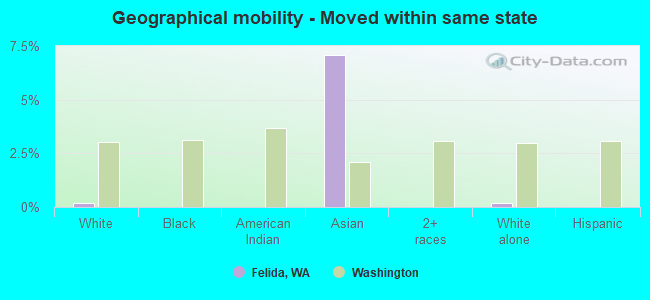
Geographical mobility - Moved from different county within same state (%)
Geographical mobility - Moved from different county within same state (%) - White
Geographical mobility - Moved from different county within same state (%) - Black or African American
Geographical mobility - Moved from different county within same state (%) - Asian
Geographical mobility - Moved from different county within same state (%) - Hispanic or Latino
Geographical mobility - Moved from different county within same state (%) - American Indian and Alaska Native
Geographical mobility - Moved from different county within same state (%) - Multirace
Geographical mobility - Moved from different county within same state (%) - Other Race
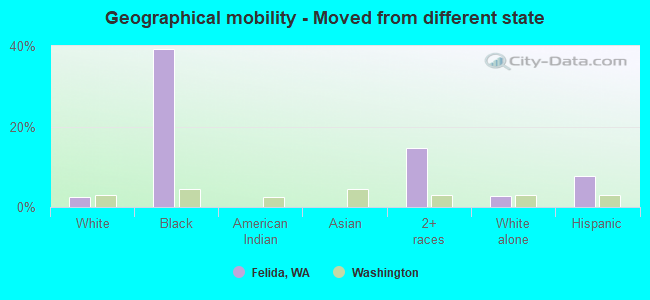
Geographical mobility - Moved from different state (%)
Geographical mobility - Moved from different state (%) - White
Geographical mobility - Moved from different state (%) - Black or African American
Geographical mobility - Moved from different state (%) - Asian
Geographical mobility - Moved from different state (%) - Hispanic or Latino
Geographical mobility - Moved from different state (%) - American Indian and Alaska Native
Geographical mobility - Moved from different state (%) - Multirace
Geographical mobility - Moved from different state (%) - Other Race
Geographical mobility - Moved from abroad (%)
Geographical mobility - Moved from abroad (%) - White
Geographical mobility - Moved from abroad (%) - Black or African American
Geographical mobility - Moved from abroad (%) - Asian
Geographical mobility - Moved from abroad (%) - Hispanic or Latino
Geographical mobility - Moved from abroad (%) - American Indian and Alaska Native
Geographical mobility - Moved from abroad (%) - Multirace
Geographical mobility - Moved from abroad (%) - Other Race
Place of birth for the foreign-born population - Ireland (%)
Place of birth for the foreign-born population - Denmark (%)
Place of birth for the foreign-born population - Norway (%)
Place of birth for the foreign-born population - Sweden (%)
Place of birth for the foreign-born population - United Kingdom (%)
Place of birth for the foreign-born population - England (%)
Place of birth for the foreign-born population - Scotland (%)
Place of birth for the foreign-born population - Other Northern Europe (%)
Place of birth for the foreign-born population - Austria (%)
Place of birth for the foreign-born population - Belgium (%)
Place of birth for the foreign-born population - France (%)
Place of birth for the foreign-born population - Germany (%)
Place of birth for the foreign-born population - Netherlands (%)
Place of birth for the foreign-born population - Switzerland (%)
Place of birth for the foreign-born population - Other Western Europe (%)
Place of birth for the foreign-born population - Greece (%)
Place of birth for the foreign-born population - Italy (%)
Place of birth for the foreign-born population - Portugal (%)
Place of birth for the foreign-born population - Spain (%)
Place of birth for the foreign-born population - Other Southern Europe (%)
Place of birth for the foreign-born population - Albania (%)
Place of birth for the foreign-born population - Belarus (%)
Place of birth for the foreign-born population - Bosnia and Herzegovina (%)
Place of birth for the foreign-born population - Bulgaria (%)
Place of birth for the foreign-born population - Croatia (%)
Place of birth for the foreign-born population - Czechoslovakia (%)
Place of birth for the foreign-born population - Hungary (%)
Place of birth for the foreign-born population - Latvia (%)
Place of birth for the foreign-born population - Lithuania (%)
Place of birth for the foreign-born population - North Macedonia (Macedonia) (%)
Place of birth for the foreign-born population - Moldova (%)
Place of birth for the foreign-born population - Poland (%)
Place of birth for the foreign-born population - Romania (%)
Place of birth for the foreign-born population - Russia (%)
Place of birth for the foreign-born population - Serbia (%)
Place of birth for the foreign-born population - Ukraine (%)
Place of birth for the foreign-born population - Other Eastern Europe (%)
Place of birth for the foreign-born population - China (%)
Place of birth for the foreign-born population - Hong Kong (%)
Place of birth for the foreign-born population - Taiwan (%)
Place of birth for the foreign-born population - Japan (%)
Place of birth for the foreign-born population - Korea (%)
Place of birth for the foreign-born population - Other Eastern Asia (%)
Place of birth for the foreign-born population - Afghanistan (%)
Place of birth for the foreign-born population - Bangladesh (%)
Place of birth for the foreign-born population - India (%)
Place of birth for the foreign-born population - Iran (%)
Place of birth for the foreign-born population - Kazakhstan (%)
Place of birth for the foreign-born population - Nepal (%)
Place of birth for the foreign-born population - Pakistan (%)
Place of birth for the foreign-born population - Sri Lanka (%)
Place of birth for the foreign-born population - Uzbekistan (%)
Place of birth for the foreign-born population - Other South Central Asia (%)
Place of birth for the foreign-born population - Burma (%)
Place of birth for the foreign-born population - Cambodia (%)
Place of birth for the foreign-born population - Indonesia (%)
Place of birth for the foreign-born population - Laos (%)
Place of birth for the foreign-born population - Malaysia (%)
Place of birth for the foreign-born population - Philippines (%)
Place of birth for the foreign-born population - Singapore (%)
Place of birth for the foreign-born population - Thailand (%)
Place of birth for the foreign-born population - Vietnam (%)
Place of birth for the foreign-born population - Other South Eastern Asia (%)
Place of birth for the foreign-born population - Armenia (%)
Place of birth for the foreign-born population - Iraq (%)
Place of birth for the foreign-born population - Israel (%)
Place of birth for the foreign-born population - Jordan (%)
Place of birth for the foreign-born population - Kuwait (%)
Place of birth for the foreign-born population - Lebanon (%)
Place of birth for the foreign-born population - Saudi Arabia (%)
Place of birth for the foreign-born population - Syria (%)
Place of birth for the foreign-born population - Turkey (%)
Place of birth for the foreign-born population - Yemen (%)
Place of birth for the foreign-born population - Other Western Asia (%)
Place of birth for the foreign-born population - Eritrea (%)
Place of birth for the foreign-born population - Ethiopia (%)
Place of birth for the foreign-born population - Kenya (%)
Place of birth for the foreign-born population - Somalia (%)
Place of birth for the foreign-born population - Uganda (%)
Place of birth for the foreign-born population - Zimbabwe (%)
Place of birth for the foreign-born population - Other Eastern Africa (%)
Place of birth for the foreign-born population - Cameroon (%)
Place of birth for the foreign-born population - Congo (%)
Place of birth for the foreign-born population - Democratic Republic of Congo (Zaire) (%)
Place of birth for the foreign-born population - Other Middle Africa (%)
Place of birth for the foreign-born population - Egypt (%)
Place of birth for the foreign-born population - Morocco (%)
Place of birth for the foreign-born population - Sudan (%)
Place of birth for the foreign-born population - Other Northern Africa (%)
Place of birth for the foreign-born population - South Africa (%)
Place of birth for the foreign-born population - Other Southern Africa (%)
Place of birth for the foreign-born population - Cabo Verde (%)
Place of birth for the foreign-born population - Ghana (%)
Place of birth for the foreign-born population - Liberia (%)
Place of birth for the foreign-born population - Nigeria (%)
Place of birth for the foreign-born population - Senegal (%)
Place of birth for the foreign-born population - Sierra Leone (%)
Place of birth for the foreign-born population - Other Western Africa (%)
Place of birth for the foreign-born population - Australia (%)
Place of birth for the foreign-born population - New Zealand (%)
Place of birth for the foreign-born population - Fiji (%)
Place of birth for the foreign-born population - Micronesia (%)
Place of birth for the foreign-born population - Bahamas (%)
Place of birth for the foreign-born population - Barbados (%)
Place of birth for the foreign-born population - Cuba (%)
Place of birth for the foreign-born population - Dominica (%)
Place of birth for the foreign-born population - Dominican Republic (%)
Place of birth for the foreign-born population - Grenada (%)
Place of birth for the foreign-born population - Haiti (%)
Place of birth for the foreign-born population - Jamaica (%)
Place of birth for the foreign-born population - St. Vincent and the Grenadines (%)
Place of birth for the foreign-born population - Trinidad and Tobago (%)
Place of birth for the foreign-born population - West Indies (%)
Place of birth for the foreign-born population - Other Caribbean (%)
Place of birth for the foreign-born population - Belize (%)
Place of birth for the foreign-born population - Costa Rica (%)
Place of birth for the foreign-born population - El Salvador (%)
Place of birth for the foreign-born population - Guatemala (%)
Place of birth for the foreign-born population - Honduras (%)
Place of birth for the foreign-born population - Mexico (%)
Place of birth for the foreign-born population - Nicaragua (%)
Place of birth for the foreign-born population - Panama (%)
Place of birth for the foreign-born population - Other Central America (%)
Place of birth for the foreign-born population - Argentina (%)
Place of birth for the foreign-born population - Bolivia (%)
Place of birth for the foreign-born population - Brazil (%)
Place of birth for the foreign-born population - Chile (%)
Place of birth for the foreign-born population - Colombia (%)
Place of birth for the foreign-born population - Ecuador (%)
Place of birth for the foreign-born population - Guyana (%)
Place of birth for the foreign-born population - Peru (%)
Place of birth for the foreign-born population - Uruguay (%)
Place of birth for the foreign-born population - Venezuela (%)
Place of birth for the foreign-born population - Other South America (%)
Place of birth for the foreign-born population - Canada (%)
Place of birth for the foreign-born population - Other Northern America (%)
Place of birth for the foreign-born population - Other (%)
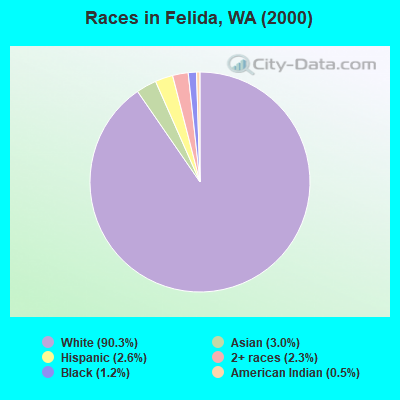
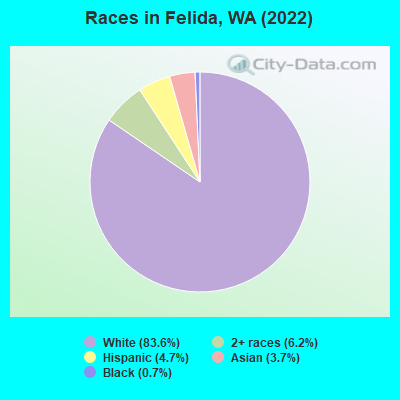
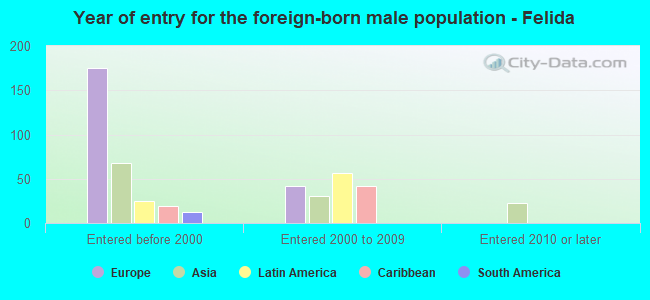
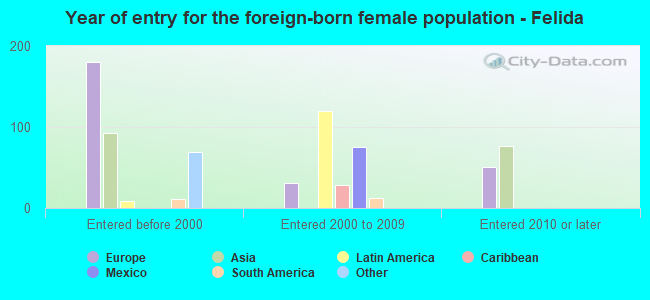
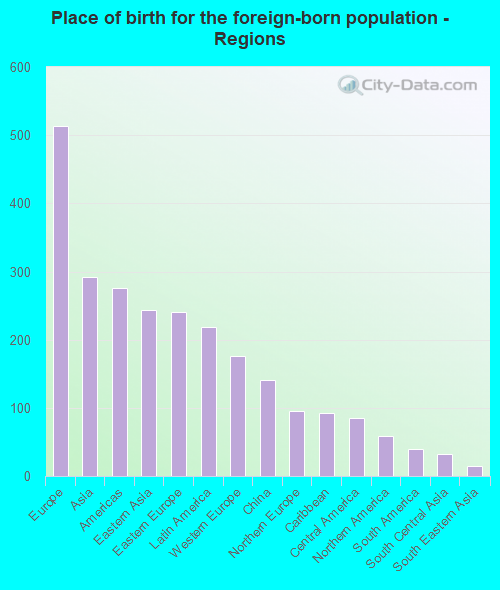
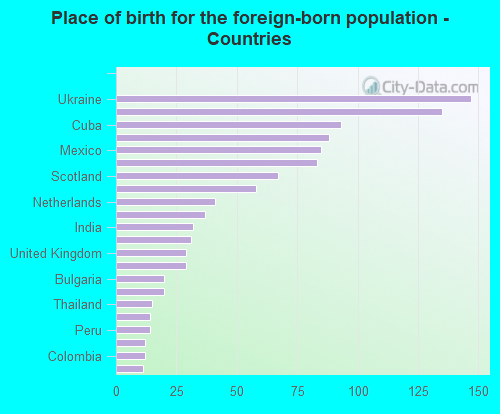
According to 2022 data, the most numerous races in Felida, WA are White alone (9,016 residents), Hispanic (512 residents), and Asian alone (398 residents). 91.6% of Felida residents speak English at home. 10.0% of Felida, WA residents are foreign-born (4.7% born in Europe, 2.7% born in Asia, 2.0% born in Latin America), which is 49.7% less than the foreign-born rate of 15.0% across the entire state of Washington.
Race distribution in Felida
2000 2022
4,652,490 78.9% White alone 441,509 7.5% Hispanic 319,401 5.4% Asian alone 184,631 3.1% Black alone 175,926 3.0% Two or more races 85,396 1.4% American Indian alone 22,779 0.4% Native Hawaiian and Other 11,989 0.2% Other race alone
4,941,456 63.5% White alone 1,093,313 14.0% Hispanic 755,832 9.7% Asian alone 523,448 6.7% Two or more races 299,537 3.8% Black alone 69,024 0.9% American Indian alone 52,231 0.7% Native Hawaiian and Other 50,945 0.7% Other race alone
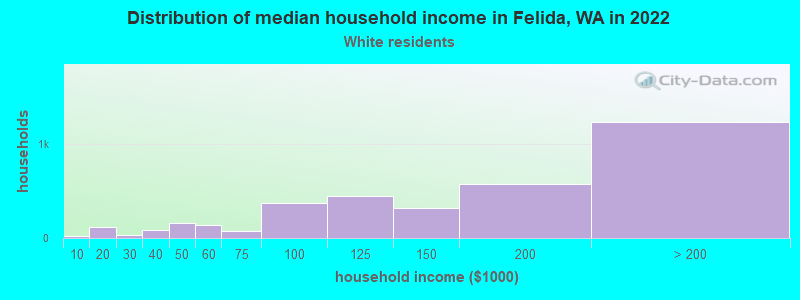
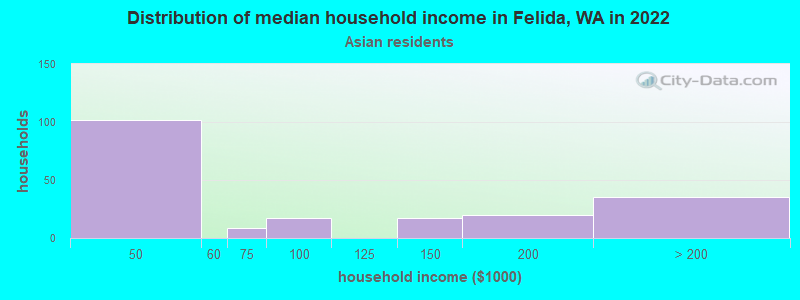
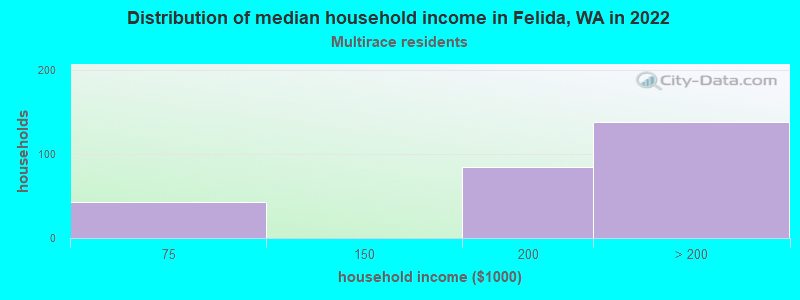
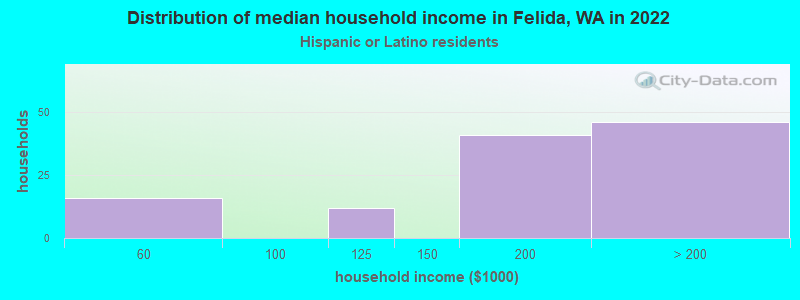
Income and house value in Felida Median household income in 2022 $146,369 White non-Hispanic householdersover $200,000 Two or more races householders$197,964 Hispanic or Latino race householdersMedian 2022 house value $715,287 White Non-Hispanic householdersover $1,000,000 Black or African American householders $502,697 Asian householders$882,963 Two or more races householders$540,624 Hispanic or Latino householders
Median age by race in Felida
46.7 Median age for White residents45.8 48.5 65.1 Median age for Black or African American residents58.3 -698,955,364.9 -708,661,416.6 Median age for American Indian / Alaska Native residents-716,049,382.0 -640,557,005.5 48.7 Median age for Asian residents58.3 47.6 -779,279,278.5 Median age for Native Hawaiian / Pacific Islander residents-779,310,344.0 -928,017,717.8 -730,813,286.8 Median age for Other race residents-725,768,320.8 -733,556,298.0 53.3 Median age for Two or more races residents55.1 45.9 46.4 Median age for White alone residents45.0 48.1 30.2 Median age for Hispanic or Latino residents51.6 29.4
Owner/renter occupied households by race in Felida
House owners and renters - White residents 3,405 93.9% Owner occupied222 6.1% Renter occupiedHouse owners and renters - Black or African American residents 11 100.0% Owner occupiedHouse owners and renters - American Indian / Alaska Native residents 6 100.0% Owner occupiedHouse owners and renters - Asian residents 128 72.9% Owner occupied47 27.1% Renter occupiedHouse owners and renters - Two or more races residents 197 65.1% Owner occupied106 34.9% Renter occupiedHouse owners and renters - White alone residents 3,415 93.6% Owner occupied233 6.4% Renter occupiedHouse owners and renters - Hispanic or Latino residents 62 59.6% Owner occupied42 40.4% Renter occupied
Language usage in Felida
English speakers - Total 91.6% of residents of Felida speak English at home.
2.8% of residents speak Spanish at home 263 91.0% Speak English very well26 9.0% Speak English less than very well5.5% of residents speak other language at home 270 48.5% Speak English very well287 51.5% Speak English less than very well
English speakers - Born in the United States 96.5% of residents of Felida speak English at home.
1.5% of residents speak Spanish at home 90 100.0% Speak English very well0.5% of residents speak other language at home 32 100.0% Speak English very well
All residents speak only English at home
English speakers - Foreign-born 40.4% of residents of Felida speak English at home.
20.7% of residents speak Spanish at home 182 87.5% Speak English very well26 12.5% Speak English less than very well42.6% of residents speak other language at home 147 34.3% Speak English very well281 65.7% Speak English less than very well
White (Caucasian) - Speak only English Native:
99.2% (7,999)Foreign-born:
82.4% (332)
White (Caucasian) - Speak another language Native:
1.1% (86)Foreign-born:
31.8% (128)
Asian - Speak only English Native:
62.9% (76)Foreign-born:
3.7% (10)
Asian - Speak another language Native:
36.9% (44)Foreign-born:
92.5% (253)
Two or more races - Speak only English Native:
84.7% (639)Foreign-born:
6.6% (39)
Two or more races - Speak another language Native:
12.1% (91)Foreign-born:
85.6% (508)
White alone - Speak only English Native:
98.2% (7,970)Foreign-born:
71.4% (316)
White alone - Speak another language Native:
1.4% (112)Foreign-born:
34.9% (154)
Hispanic or Latino - Speak only English Native:
89.6% (237)Foreign-born:
15.2% (30)
Hispanic or Latino - Speak another language Native:
9.1% (24)Foreign-born:
87.8% (176)
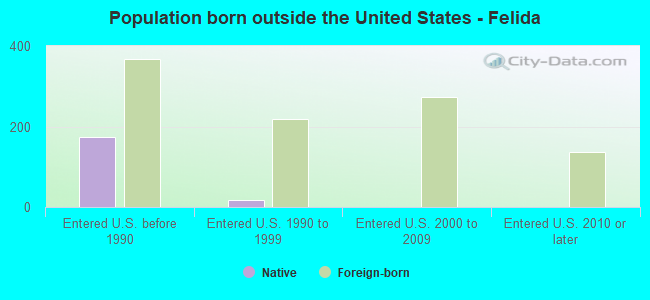
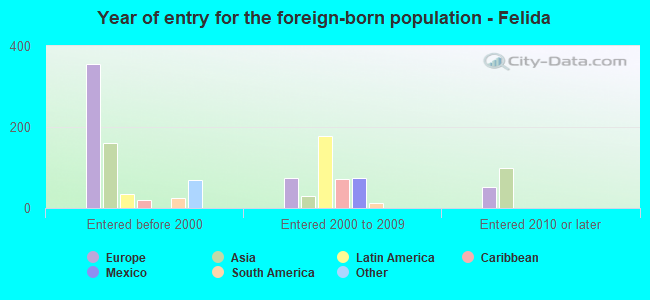
Foreign-born residents in Felida 1,081 residents are foreign born (4.7% Europe , 2.7% Asia , 2.0% Latin America ).
This city:
10.0%Washington:
14.9%
Marital status for residents in Felida Marital status - White (Caucasian) population 15 years and over
Males 22.7% Never married69.9% Now married0.9% Separated1.0% Widowed5.5% DivorcedFemales 18.1% Never married67.1% Now married0.5% Separated5.0% Widowed9.3% DivorcedWomen who gave birth in the past 12 months Now married:
100.0% (160)Unmarried:
0.0% (0)
Women who did not give birth in the past 12 months Now married:
65.1% (938)Unmarried:
34.9% (502)
Marital status - Black or African American population 15 years and over
Males 0.0% Never married100.0% Now married0.0% Separated0.0% Widowed0.0% DivorcedFemales 0.0% Never married100.0% Now married0.0% Separated0.0% Widowed0.0% DivorcedMarital status - American Indian / Alaska Native population 15 years and over
Males 0.0% Never married100.0% Now married0.0% Separated0.0% Widowed0.0% DivorcedFemales 0.0% Never married100.0% Now married0.0% Separated0.0% Widowed0.0% DivorcedWomen who did not give birth in the past 12 months Now married:
100.0% (7)Unmarried:
0.0% (0)
Marital status - Asian population 15 years and over
Males 29.1% Never married70.9% Now married0.0% Separated0.0% Widowed0.0% DivorcedFemales 15.4% Never married48.2% Now married26.8% Separated1.8% Widowed7.9% DivorcedWomen who did not give birth in the past 12 months Now married:
65.1% (105)Unmarried:
34.9% (56)
Marital status - Two or more races population 15 years and over
Males 18.5% Never married66.7% Now married0.0% Separated9.5% Widowed5.3% DivorcedFemales 29.9% Never married50.7% Now married0.0% Separated0.0% Widowed19.3% DivorcedWomen who did not give birth in the past 12 months Now married:
42.4% (147)Unmarried:
57.6% (199)
Marital status - White alone, not Hispanic / Latino population 15 years and over
Males 23.2% Never married69.3% Now married0.9% Separated1.0% Widowed5.6% DivorcedFemales 18.3% Never married66.7% Now married0.5% Separated5.1% Widowed9.4% DivorcedWomen who gave birth in the past 12 months Now married:
100.0% (131)Unmarried:
0.0% (0)
Women who did not give birth in the past 12 months Now married:
65.1% (973)Unmarried:
34.9% (521)
Marital status - Hispanic or Latino population 15 years and over
Males 0.0% Never married100.0% Now married0.0% Separated0.0% Widowed0.0% DivorcedFemales 34.6% Never married65.4% Now married0.0% Separated0.0% Widowed0.0% DivorcedWomen who gave birth in the past 12 months Now married:
100.0% (37)Unmarried:
0.0% (0)
Women who did not give birth in the past 12 months Now married:
26.8% (33)Unmarried:
73.2% (90)
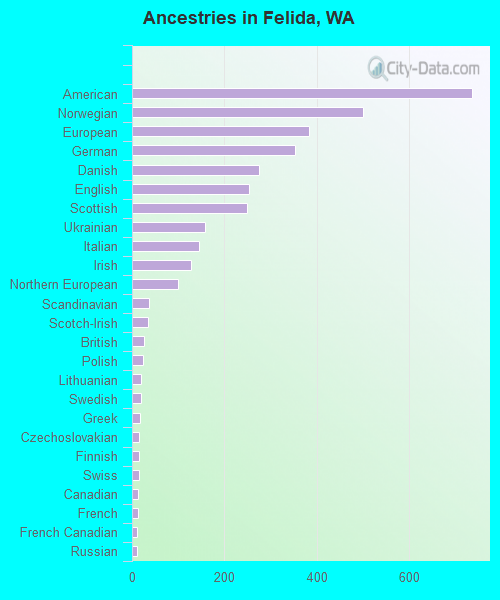
Ancestries in Felida
736 15.1% American501 10.3% Norwegian384 7.9% European353 7.2% German274 5.6% Danish253 5.2% English249 5.1% Scottish158 3.2% Ukrainian144 3.0% Italian128 2.6% Irish100 2.1% Northern European37 0.8% Scandinavian34 0.7% Scotch-Irish27 0.6% British23 0.5% Polish19 0.4% Lithuanian19 0.4% Swedish17 0.3% Greek16 0.3% Czechoslovakian16 0.3% Finnish16 0.3% Swiss14 0.3% Canadian14 0.3% French10 0.2% French Canadian10 0.2% Russian
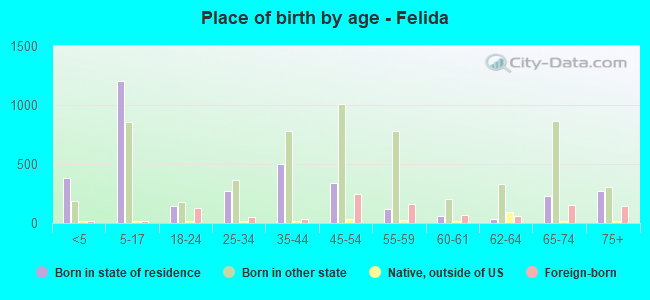
Children Nativity (place of birth) in Felida
Children under 6 years - Living with two parents Both parents native 572 100.0% NativeBoth parents foreign-born 46 100.0% NativeOne native, one foreign-born parent 63 100.0% NativeChildren under 6 years - Living with one parent Native parent 36 100.0% NativeChildren 6 to 17 years - Living with two parents Both parents native 1,335 100.0% NativeBoth parents foreign-born 75 100.0% NativeOne native, one foreign-born parent 235 100.0% NativeChildren 6 to 17 years - Living with one parent Native parent 282 100.0% NativeForeign-born parent 16 52.5% Native15 47.5% Foreign-born
Grandparents responsible for own grandchildren in Felida
Grandparents (30 to 59 years) White / Caucasian 9 100.0% Responsible for grandchildrenWhite alone, not Hispanic / Latino 9 100.0% Responsible for grandchildren
Grandparents (60 years and over) White / Caucasian 10 100.0% Responsible for grandchildrenWhite alone, not Hispanic / Latino 10 100.0% Responsible for grandchildren