Races in Fenton, New York (NY) Detailed Stats
Ancestries, Foreign-born residents, place of birth
1.5% of Fenton, NY residents are foreign-born , which is 1333.9% less than the foreign-born rate of 22.0% across the entire state of New York.
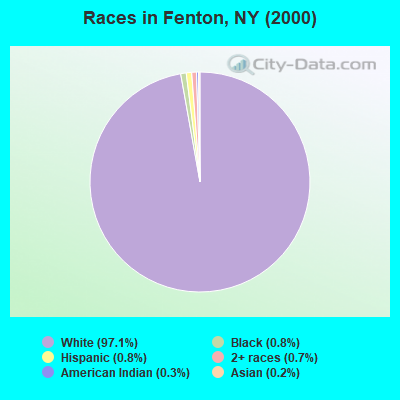
Race distribution in Fenton

- 6,70697.1%White alone
- 550.8%Hispanic
- 560.8%Black alone
- 510.7%Two or more races
- 200.3%American Indian alone
- 170.2%Asian alone
- 40.06%Other race alone
2000
2022
-
- 11,760,98162.0%White alone
- 2,867,58315.1%Hispanic
- 2,812,62314.8%Black alone
- 1,035,9265.5%Asian alone
- 366,1161.9%Two or more races
- 75,4990.4%Other race alone
- 52,4990.3%American Indian alone
- 5,2300.03%Native Hawaiian and Other
Pacific Islander alone

-
- 10,408,93352.9%White alone
- 3,867,29919.7%Hispanic
- 2,633,84013.4%Black alone
- 1,776,2869.0%Asian alone
- 732,6703.7%Two or more races
- 216,1101.1%Other race alone
- 35,0820.2%American Indian alone
- 6,9310.04%Native Hawaiian and Other
Pacific Islander alone

Income and house value in Fenton
- Median household income in 2022
- $68,556White non-Hispanic householders
- $56,753Black householders
- $14,838Asian householders
- $30,258Two or more races householders
- $82,678Hispanic or Latino race householders
- Median 2022 house value
- $149,061White Non-Hispanic householders
- $148,074Black or African American householders
- $370,185Asian householders
- $222,111Two or more races householders
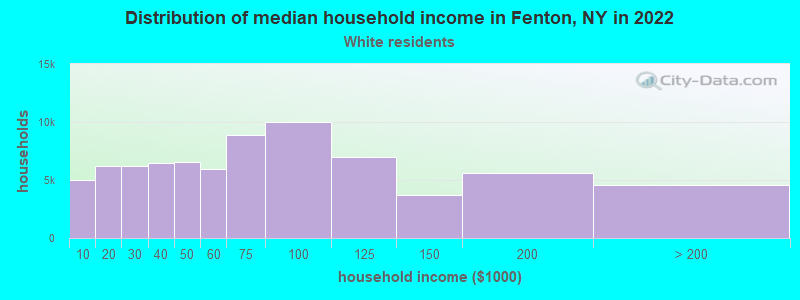
Household income for White non-Hispanic householders
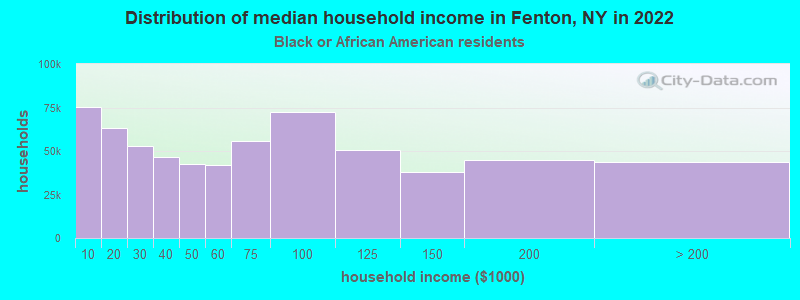
Household income for Black householders
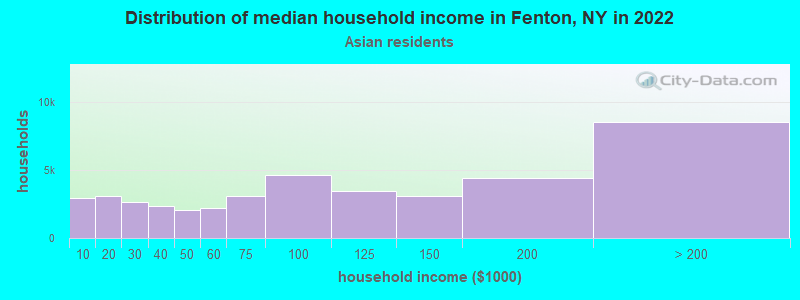
Household income for Asian householders
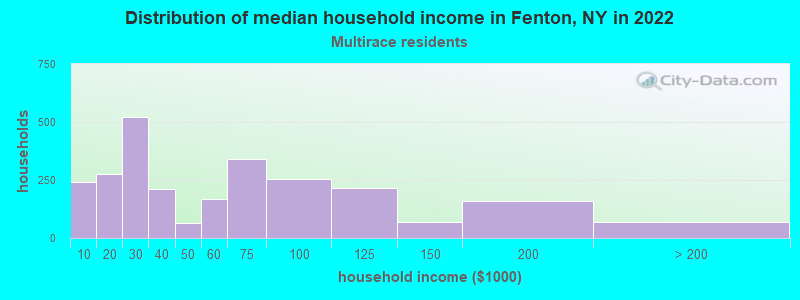
Household income for Two or more races householders
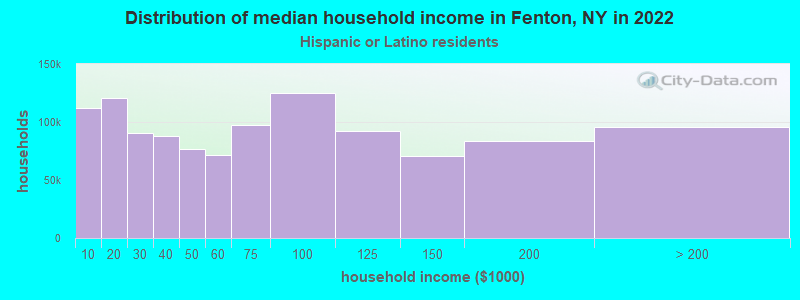
Household income for Hispanic or Latino race householders
Foreign-born residents in Fenton
106 residents are foreign born
| This city: | 1.5% |
| New York: | 20.4% |
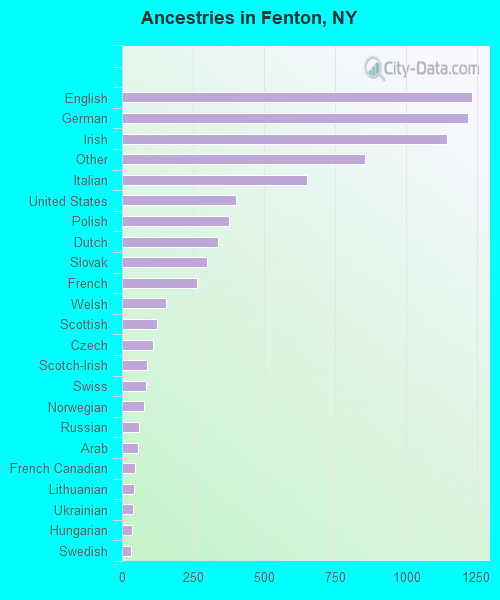
Ancestries in Fenton

- 1,22915.9%English
- 1,21615.7%German
- 1,14414.8%Irish
- 85511.0%Other
- 6528.4%Italian
- 4025.2%United States
- 3764.9%Polish
- 3384.4%Dutch
- 2993.9%Slovak
- 2623.4%French
- 1542.0%Welsh
- 1241.6%Scottish
- 1081.4%Czech
- 891.2%Scotch-Irish
- 861.1%Swiss
- 791.0%Norwegian
- 600.8%Russian
- 580.7%Arab
- 460.6%French Canadian
- 420.5%Lithuanian
- 370.5%Ukrainian
- 350.5%Hungarian
- 330.4%Swedish
- 80.1%Subsaharan African
- 60.08%Greek
Zip codes: 13833.