Races in Fifield, Wisconsin (WI) Detailed Stats
Ancestries, Foreign-born residents, place of birth

Discuss Fifield, Wisconsin races on our local forum with over 2,400,000 registered users
0.8% of Fifield, WI residents are foreign-born , which is 518.1% less than the foreign-born rate of 5.0% across the entire state of Wisconsin.
Race distribution in Fifield

- 96697.7%White alone
- 121.2%American Indian alone
- 50.5%Hispanic
- 20.2%Two or more races
- 20.2%Other race alone
- 10.1%Black alone
- 10.1%Asian alone

2000
2022
-
- 4,681,63087.3%White alone
- 300,2455.6%Black alone
- 192,9213.6%Hispanic
- 87,9951.6%Asian alone
- 51,9211.0%Two or more races
- 43,9800.8%American Indian alone
- 3,6370.07%Other race alone
- 1,3460.03%Native Hawaiian and Other
Pacific Islander alone

-
- 4,654,03179.0%White alone
- 447,0227.6%Hispanic
- 345,6785.9%Black alone
- 217,5323.7%Two or more races
- 172,2422.9%Asian alone
- 33,7620.6%American Indian alone
- 19,6800.3%Other race alone
- 2,5920.04%Native Hawaiian and Other
Pacific Islander alone

Income and house value in Fifield
- Median household income in 2022
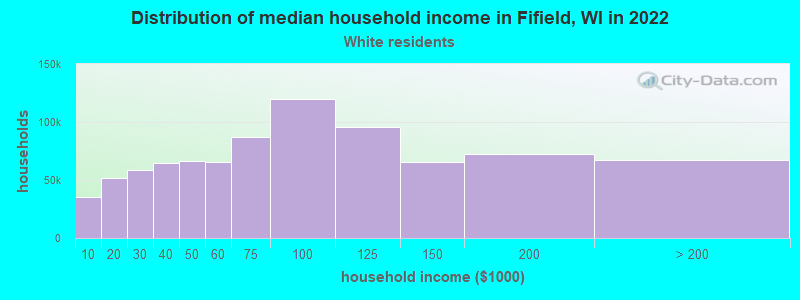
- $61,128White non-Hispanic householders
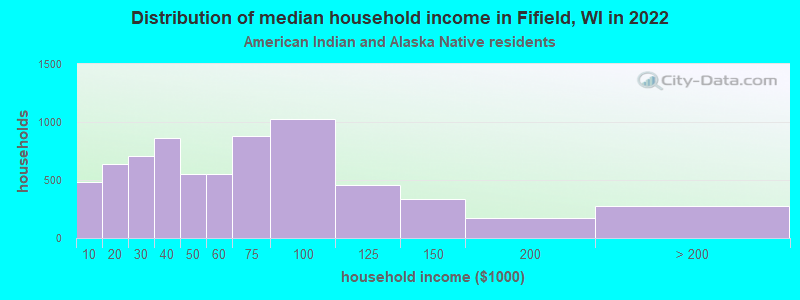
- $45,740American Indian and Alaska Native householders
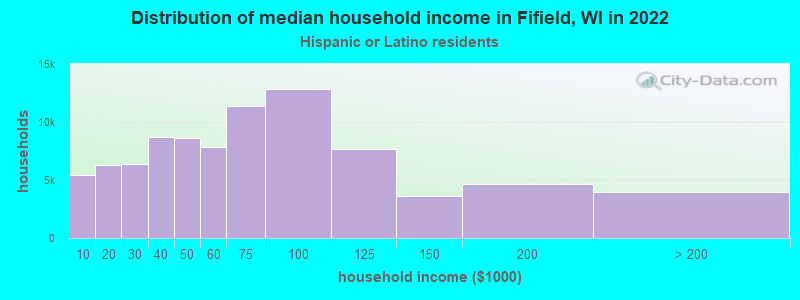
- $80,557Hispanic or Latino race householders
- Median 2022 house value
- $179,022White Non-Hispanic householders
- $231,229American Indian or Alaska Native householders
- $154,152Hispanic or Latino householders
Household income for White non-Hispanic householders
Household income for American Indian and Alaska Native householders
Household income for Hispanic or Latino race householders
Foreign-born residents in Fifield
8 residents are foreign born
| This city: | 0.8% |
| Wisconsin: | 3.6% |
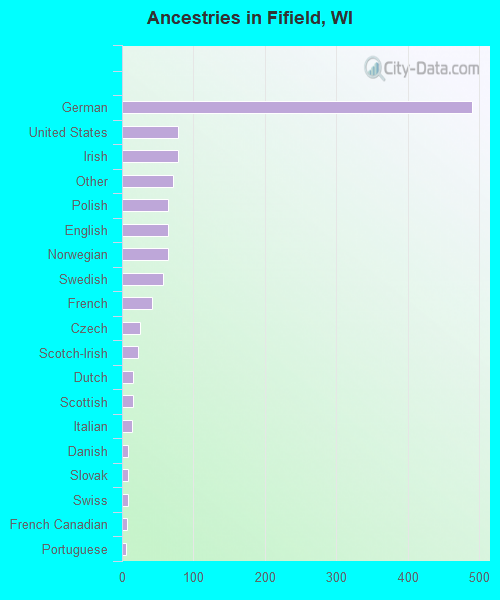
Ancestries in Fifield

- 48942.3%German
- 796.8%United States
- 786.8%Irish
- 726.2%Other
- 655.6%Polish
- 645.5%English
- 645.5%Norwegian
- 574.9%Swedish
- 423.6%French
- 252.2%Czech
- 232.0%Scotch-Irish
- 161.4%Dutch
- 161.4%Scottish
- 141.2%Italian
- 90.8%Danish
- 80.7%Slovak
- 80.7%Swiss
- 70.6%French Canadian
- 60.5%Portuguese
- 40.3%Russian
- 30.3%Hungarian
- 20.2%Lithuanian
- 20.2%Ukrainian
- 20.2%Welsh
Zip codes: 54552.