Races in Five Forks, South Carolina (SC) Detailed Stats
Data:
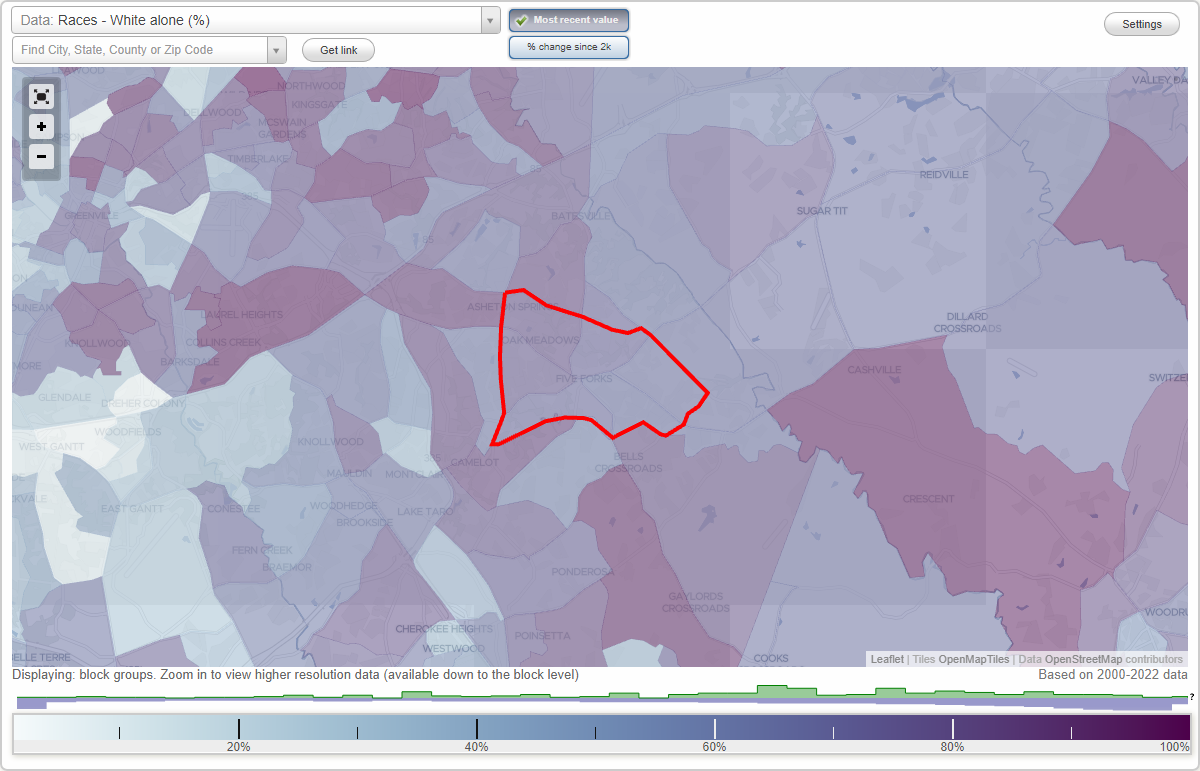
Races - White alone (%)
Races - White alone (% change since 2000)
Races - Black alone (%)
Races - Black alone (% change since 2000)
Races - American Indian alone (%)
Races - American Indian alone (% change since 2000)
Races - Asian alone (%)
Races - Asian alone (% change since 2000)
Races - Hispanic (%)
Races - Hispanic (% change since 2000)
Races - Native Hawaiian and Other Pacific Islander alone (%)
Races - Native Hawaiian and Other Pacific Islander alone (% change since 2000)
Races - Two or more races(%)
Races - Two or more races(% change since 2000)
Races - Other race alone (%)
Races - Other race alone (% change since 2000)
Racial diversity
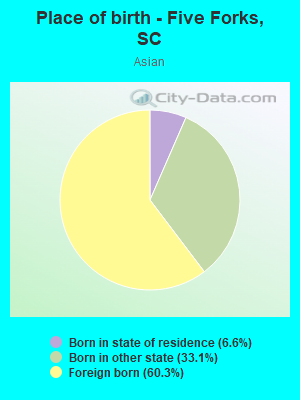
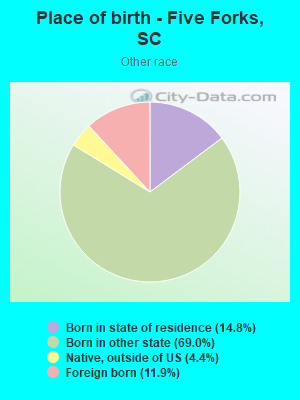
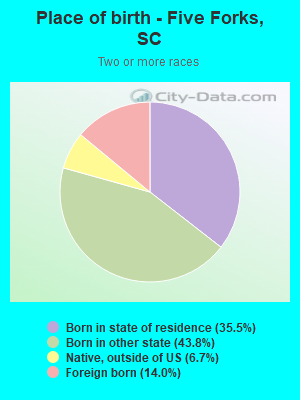
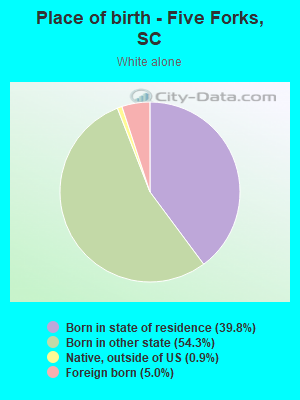
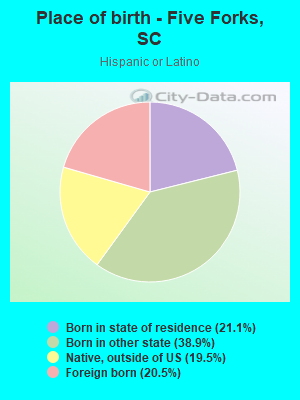
Place of birth - Born in state of residence (%)
Place of birth - Born in state of residence (%) - White
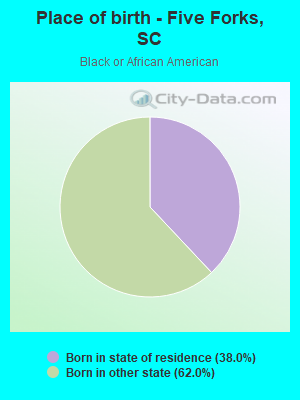
Place of birth - Born in state of residence (%) - Black or African American
Place of birth - Born in state of residence (%) - Asian
Place of birth - Born in state of residence (%) - Hispanic or Latino
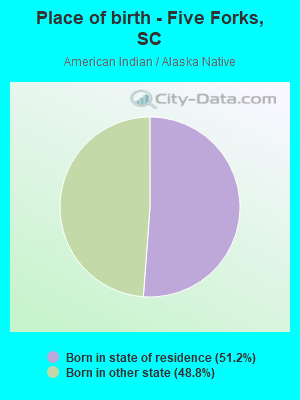
Place of birth - Born in state of residence (%) - American Indian and Alaska Native
Place of birth - Born in state of residence (%) - Multirace
Place of birth - Born in state of residence (%) - Other Race
Place of birth - Born in other state (%)
Place of birth - Born in other state (%) - White
Place of birth - Born in other state (%) - Black or African American
Place of birth - Born in other state (%) - Asian
Place of birth - Born in other state (%) - Hispanic or Latino
Place of birth - Born in other state (%) - American Indian and Alaska Native
Place of birth - Born in other state (%) - Multirace
Place of birth - Born in other state (%) - Other Race
Place of birth - Native, outside of US (%)
Place of birth - Native, outside of US (%) - White
Place of birth - Native, outside of US (%) - Black or African American
Place of birth - Native, outside of US (%) - Asian
Place of birth - Native, outside of US (%) - Hispanic or Latino
Place of birth - Native, outside of US (%) - American Indian and Alaska Native
Place of birth - Native, outside of US (%) - Multirace
Place of birth - Native, outside of US (%) - Other Race
Place of birth - Foreign born (%)
Place of birth - Foreign born (%) - White
Place of birth - Foreign born (%) - Black or African American
Place of birth - Foreign born (%) - Asian
Place of birth - Foreign born (%) - Hispanic or Latino
Place of birth - Foreign born (%) - American Indian and Alaska Native
Place of birth - Foreign born (%) - Multirace
Place of birth - Foreign born (%) - Other Race
Residents speaking English at home (%)
Residents speaking English at home - Born in the United States (%)
Residents speaking English at home - Native, born elsewhere (%)
Residents speaking English at home - Foreign born (%)
Residents speaking Spanish at home (%)
Residents speaking Spanish at home - Born in the United States (%)
Residents speaking Spanish at home - Native, born elsewhere (%)
Residents speaking Spanish at home - Foreign born (%)
Residents speaking other language at home (%)
Residents speaking other language at home - Born in the United States (%)
Residents speaking other language at home - Native, born elsewhere (%)
Residents speaking other language at home - Foreign born (%)
Marital status - Never married (%)
Marital status - Now married (%)
Marital status - Separated (%)
Marital status - Widowed (%)
Marital status - Divorced (%)
Ancestries Reported - Arab (%)
Ancestries Reported - Czech (%)
Ancestries Reported - Danish (%)
Ancestries Reported - Dutch (%)
Ancestries Reported - English (%)
Ancestries Reported - French (%)
Ancestries Reported - French Canadian (%)
Ancestries Reported - German (%)
Ancestries Reported - Greek (%)
Ancestries Reported - Hungarian (%)
Ancestries Reported - Irish (%)
Ancestries Reported - Italian (%)
Ancestries Reported - Lithuanian (%)
Ancestries Reported - Norwegian (%)
Ancestries Reported - Polish (%)
Ancestries Reported - Portuguese (%)
Ancestries Reported - Russian (%)
Ancestries Reported - Scotch-Irish (%)
Ancestries Reported - Scottish (%)
Ancestries Reported - Slovak (%)
Ancestries Reported - Subsaharan African (%)
Ancestries Reported - Swedish (%)
Ancestries Reported - Swiss (%)
Ancestries Reported - Ukrainian (%)
Ancestries Reported - United States (%)
Ancestries Reported - Welsh (%)
Ancestries Reported - West Indian (%)
Ancestries Reported - Other (%)
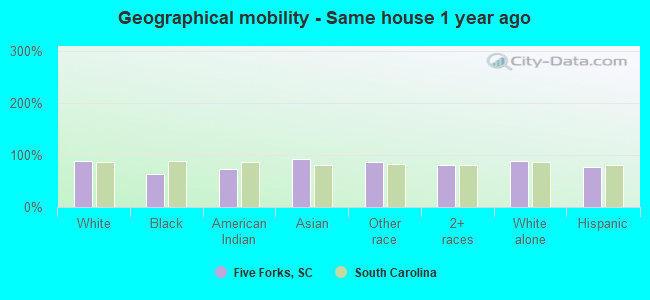
Geographical mobility - Same house 1 year ago (%)
Geographical mobility - Same house 1 year ago (%) - White
Geographical mobility - Same house 1 year ago (%) - Black or African American
Geographical mobility - Same house 1 year ago (%) - Asian
Geographical mobility - Same house 1 year ago (%) - Hispanic or Latino
Geographical mobility - Same house 1 year ago (%) - American Indian and Alaska Native
Geographical mobility - Same house 1 year ago (%) - Multirace
Geographical mobility - Same house 1 year ago (%) - Other Race
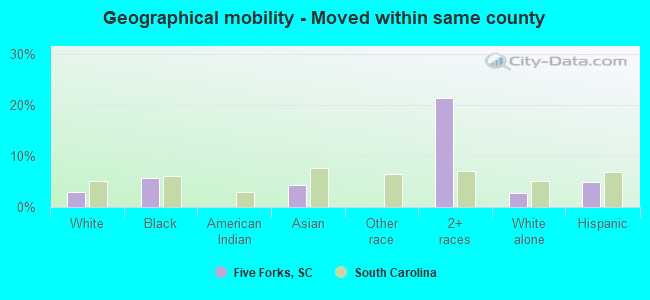
Geographical mobility - Moved within same county (%)
Geographical mobility - Moved within same county (%) - White
Geographical mobility - Moved within same county (%) - Black or African American
Geographical mobility - Moved within same county (%) - Asian
Geographical mobility - Moved within same county (%) - Hispanic or Latino
Geographical mobility - Moved within same county (%) - American Indian and Alaska Native
Geographical mobility - Moved within same county (%) - Multirace
Geographical mobility - Moved within same county (%) - Other Race
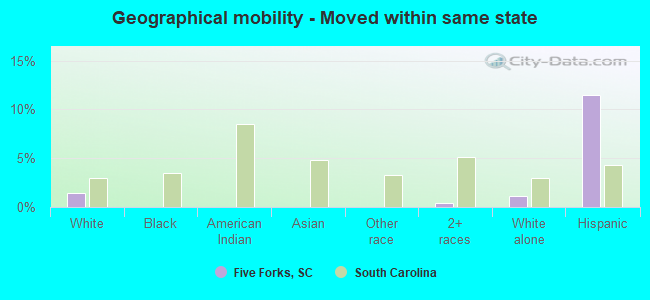
Geographical mobility - Moved from different county within same state (%)
Geographical mobility - Moved from different county within same state (%) - White
Geographical mobility - Moved from different county within same state (%) - Black or African American
Geographical mobility - Moved from different county within same state (%) - Asian
Geographical mobility - Moved from different county within same state (%) - Hispanic or Latino
Geographical mobility - Moved from different county within same state (%) - American Indian and Alaska Native
Geographical mobility - Moved from different county within same state (%) - Multirace
Geographical mobility - Moved from different county within same state (%) - Other Race
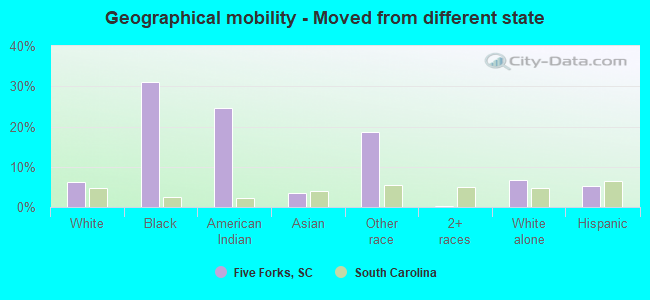
Geographical mobility - Moved from different state (%)
Geographical mobility - Moved from different state (%) - White
Geographical mobility - Moved from different state (%) - Black or African American
Geographical mobility - Moved from different state (%) - Asian
Geographical mobility - Moved from different state (%) - Hispanic or Latino
Geographical mobility - Moved from different state (%) - American Indian and Alaska Native
Geographical mobility - Moved from different state (%) - Multirace
Geographical mobility - Moved from different state (%) - Other Race
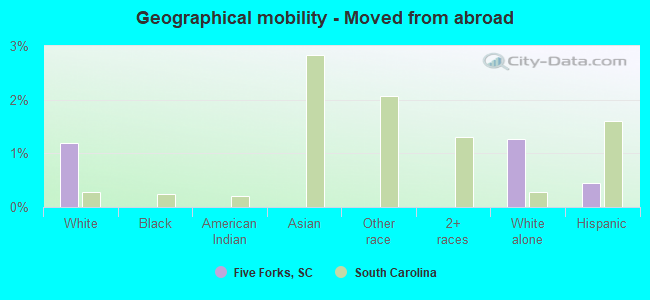
Geographical mobility - Moved from abroad (%)
Geographical mobility - Moved from abroad (%) - White
Geographical mobility - Moved from abroad (%) - Black or African American
Geographical mobility - Moved from abroad (%) - Asian
Geographical mobility - Moved from abroad (%) - Hispanic or Latino
Geographical mobility - Moved from abroad (%) - American Indian and Alaska Native
Geographical mobility - Moved from abroad (%) - Multirace
Geographical mobility - Moved from abroad (%) - Other Race
Place of birth for the foreign-born population - Ireland (%)
Place of birth for the foreign-born population - Denmark (%)
Place of birth for the foreign-born population - Norway (%)
Place of birth for the foreign-born population - Sweden (%)
Place of birth for the foreign-born population - United Kingdom (%)
Place of birth for the foreign-born population - England (%)
Place of birth for the foreign-born population - Scotland (%)
Place of birth for the foreign-born population - Other Northern Europe (%)
Place of birth for the foreign-born population - Austria (%)
Place of birth for the foreign-born population - Belgium (%)
Place of birth for the foreign-born population - France (%)
Place of birth for the foreign-born population - Germany (%)
Place of birth for the foreign-born population - Netherlands (%)
Place of birth for the foreign-born population - Switzerland (%)
Place of birth for the foreign-born population - Other Western Europe (%)
Place of birth for the foreign-born population - Greece (%)
Place of birth for the foreign-born population - Italy (%)
Place of birth for the foreign-born population - Portugal (%)
Place of birth for the foreign-born population - Spain (%)
Place of birth for the foreign-born population - Other Southern Europe (%)
Place of birth for the foreign-born population - Albania (%)
Place of birth for the foreign-born population - Belarus (%)
Place of birth for the foreign-born population - Bosnia and Herzegovina (%)
Place of birth for the foreign-born population - Bulgaria (%)
Place of birth for the foreign-born population - Croatia (%)
Place of birth for the foreign-born population - Czechoslovakia (%)
Place of birth for the foreign-born population - Hungary (%)
Place of birth for the foreign-born population - Latvia (%)
Place of birth for the foreign-born population - Lithuania (%)
Place of birth for the foreign-born population - North Macedonia (Macedonia) (%)
Place of birth for the foreign-born population - Moldova (%)
Place of birth for the foreign-born population - Poland (%)
Place of birth for the foreign-born population - Romania (%)
Place of birth for the foreign-born population - Russia (%)
Place of birth for the foreign-born population - Serbia (%)
Place of birth for the foreign-born population - Ukraine (%)
Place of birth for the foreign-born population - Other Eastern Europe (%)
Place of birth for the foreign-born population - China (%)
Place of birth for the foreign-born population - Hong Kong (%)
Place of birth for the foreign-born population - Taiwan (%)
Place of birth for the foreign-born population - Japan (%)
Place of birth for the foreign-born population - Korea (%)
Place of birth for the foreign-born population - Other Eastern Asia (%)
Place of birth for the foreign-born population - Afghanistan (%)
Place of birth for the foreign-born population - Bangladesh (%)
Place of birth for the foreign-born population - India (%)
Place of birth for the foreign-born population - Iran (%)
Place of birth for the foreign-born population - Kazakhstan (%)
Place of birth for the foreign-born population - Nepal (%)
Place of birth for the foreign-born population - Pakistan (%)
Place of birth for the foreign-born population - Sri Lanka (%)
Place of birth for the foreign-born population - Uzbekistan (%)
Place of birth for the foreign-born population - Other South Central Asia (%)
Place of birth for the foreign-born population - Burma (%)
Place of birth for the foreign-born population - Cambodia (%)
Place of birth for the foreign-born population - Indonesia (%)
Place of birth for the foreign-born population - Laos (%)
Place of birth for the foreign-born population - Malaysia (%)
Place of birth for the foreign-born population - Philippines (%)
Place of birth for the foreign-born population - Singapore (%)
Place of birth for the foreign-born population - Thailand (%)
Place of birth for the foreign-born population - Vietnam (%)
Place of birth for the foreign-born population - Other South Eastern Asia (%)
Place of birth for the foreign-born population - Armenia (%)
Place of birth for the foreign-born population - Iraq (%)
Place of birth for the foreign-born population - Israel (%)
Place of birth for the foreign-born population - Jordan (%)
Place of birth for the foreign-born population - Kuwait (%)
Place of birth for the foreign-born population - Lebanon (%)
Place of birth for the foreign-born population - Saudi Arabia (%)
Place of birth for the foreign-born population - Syria (%)
Place of birth for the foreign-born population - Turkey (%)
Place of birth for the foreign-born population - Yemen (%)
Place of birth for the foreign-born population - Other Western Asia (%)
Place of birth for the foreign-born population - Eritrea (%)
Place of birth for the foreign-born population - Ethiopia (%)
Place of birth for the foreign-born population - Kenya (%)
Place of birth for the foreign-born population - Somalia (%)
Place of birth for the foreign-born population - Uganda (%)
Place of birth for the foreign-born population - Zimbabwe (%)
Place of birth for the foreign-born population - Other Eastern Africa (%)
Place of birth for the foreign-born population - Cameroon (%)
Place of birth for the foreign-born population - Congo (%)
Place of birth for the foreign-born population - Democratic Republic of Congo (Zaire) (%)
Place of birth for the foreign-born population - Other Middle Africa (%)
Place of birth for the foreign-born population - Egypt (%)
Place of birth for the foreign-born population - Morocco (%)
Place of birth for the foreign-born population - Sudan (%)
Place of birth for the foreign-born population - Other Northern Africa (%)
Place of birth for the foreign-born population - South Africa (%)
Place of birth for the foreign-born population - Other Southern Africa (%)
Place of birth for the foreign-born population - Cabo Verde (%)
Place of birth for the foreign-born population - Ghana (%)
Place of birth for the foreign-born population - Liberia (%)
Place of birth for the foreign-born population - Nigeria (%)
Place of birth for the foreign-born population - Senegal (%)
Place of birth for the foreign-born population - Sierra Leone (%)
Place of birth for the foreign-born population - Other Western Africa (%)
Place of birth for the foreign-born population - Australia (%)
Place of birth for the foreign-born population - New Zealand (%)
Place of birth for the foreign-born population - Fiji (%)
Place of birth for the foreign-born population - Micronesia (%)
Place of birth for the foreign-born population - Bahamas (%)
Place of birth for the foreign-born population - Barbados (%)
Place of birth for the foreign-born population - Cuba (%)
Place of birth for the foreign-born population - Dominica (%)
Place of birth for the foreign-born population - Dominican Republic (%)
Place of birth for the foreign-born population - Grenada (%)
Place of birth for the foreign-born population - Haiti (%)
Place of birth for the foreign-born population - Jamaica (%)
Place of birth for the foreign-born population - St. Vincent and the Grenadines (%)
Place of birth for the foreign-born population - Trinidad and Tobago (%)
Place of birth for the foreign-born population - West Indies (%)
Place of birth for the foreign-born population - Other Caribbean (%)
Place of birth for the foreign-born population - Belize (%)
Place of birth for the foreign-born population - Costa Rica (%)
Place of birth for the foreign-born population - El Salvador (%)
Place of birth for the foreign-born population - Guatemala (%)
Place of birth for the foreign-born population - Honduras (%)
Place of birth for the foreign-born population - Mexico (%)
Place of birth for the foreign-born population - Nicaragua (%)
Place of birth for the foreign-born population - Panama (%)
Place of birth for the foreign-born population - Other Central America (%)
Place of birth for the foreign-born population - Argentina (%)
Place of birth for the foreign-born population - Bolivia (%)
Place of birth for the foreign-born population - Brazil (%)
Place of birth for the foreign-born population - Chile (%)
Place of birth for the foreign-born population - Colombia (%)
Place of birth for the foreign-born population - Ecuador (%)
Place of birth for the foreign-born population - Guyana (%)
Place of birth for the foreign-born population - Peru (%)
Place of birth for the foreign-born population - Uruguay (%)
Place of birth for the foreign-born population - Venezuela (%)
Place of birth for the foreign-born population - Other South America (%)
Place of birth for the foreign-born population - Canada (%)
Place of birth for the foreign-born population - Other Northern America (%)
Place of birth for the foreign-born population - Other (%)
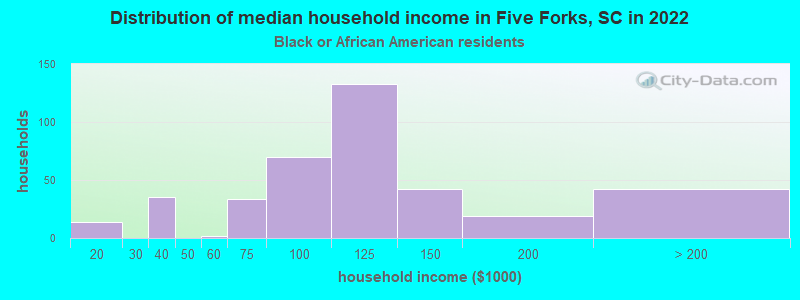
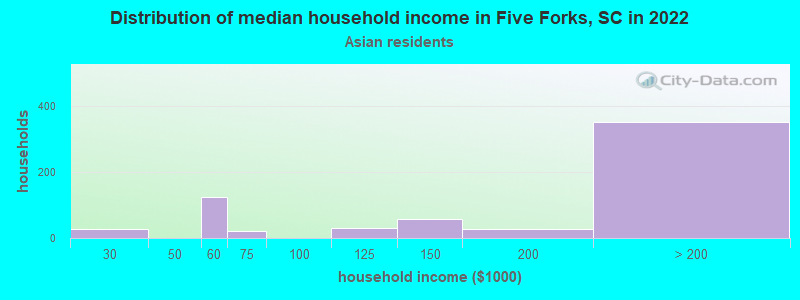
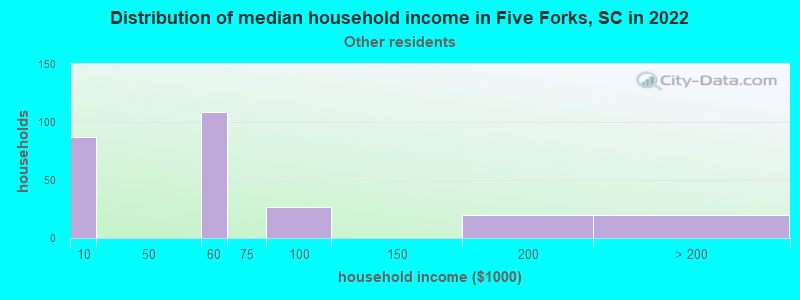
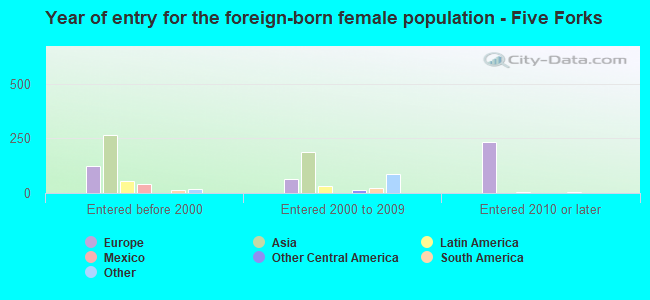
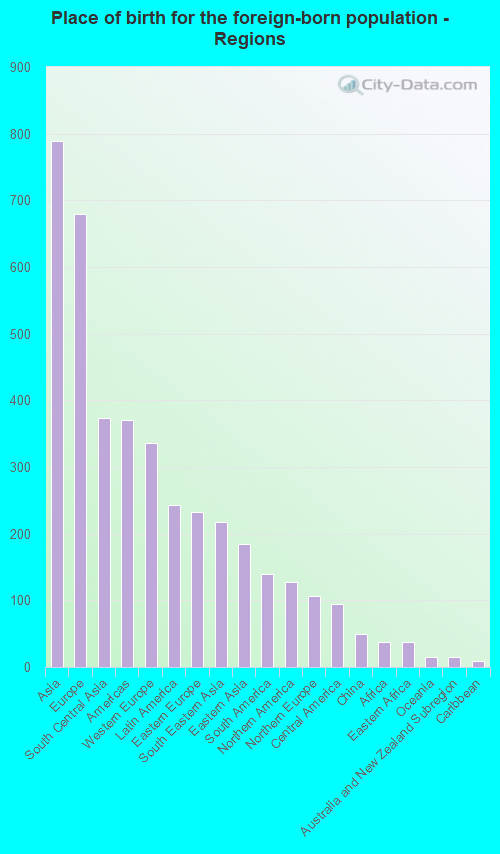
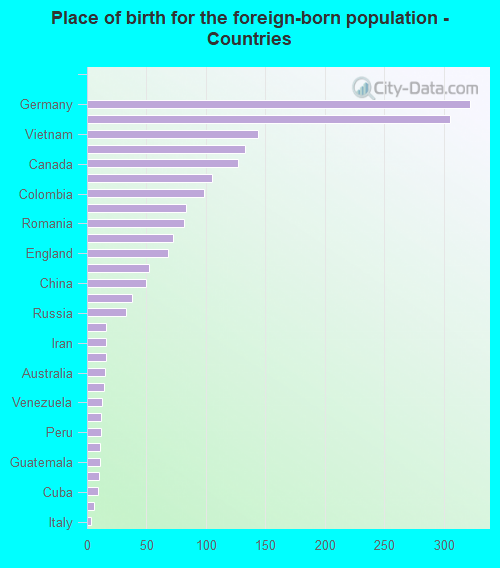
According to 2022 data, the most numerous races in Five Forks, SC are White alone (14,446 residents), Black alone (1,258 residents), and Hispanic (1,302 residents). 87.3% of Five Forks residents speak English at home. 9.8% of Five Forks, SC residents are foreign-born (4.2% born in Asia, 3.6% born in Europe, 1.3% born in Latin America), which is 49.1% greater than the foreign-born rate of 5.0% across the entire state of South Carolina.
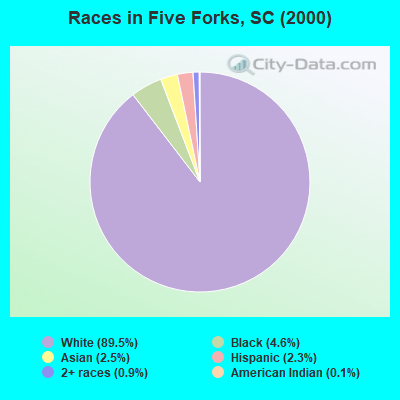
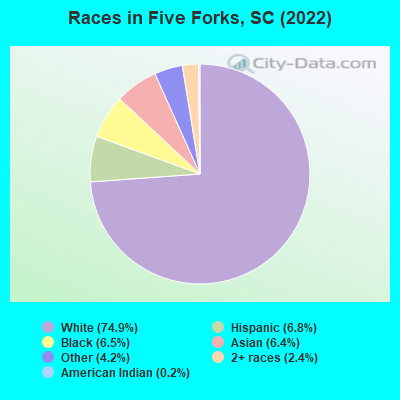
Race distribution in Five Forks
2000 2022
2,652,291 66.1% White alone 1,178,486 29.4% Black alone 95,076 2.4% Hispanic 35,568 0.9% Asian alone 33,290 0.8% Two or more races 12,765 0.3% American Indian alone 3,266 0.08% Other race alone 1,270 0.03% Native Hawaiian and Other
3,301,739 62.5% White alone 1,313,290 24.9% Black alone 343,783 6.5% Hispanic 190,508 3.6% Two or more races 89,888 1.7% Asian alone 29,390 0.6% Other race alone 12,112 0.2% American Indian alone 1,924 0.04% Native Hawaiian and Other
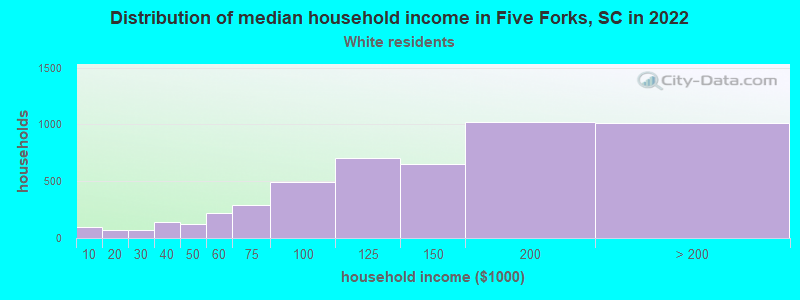
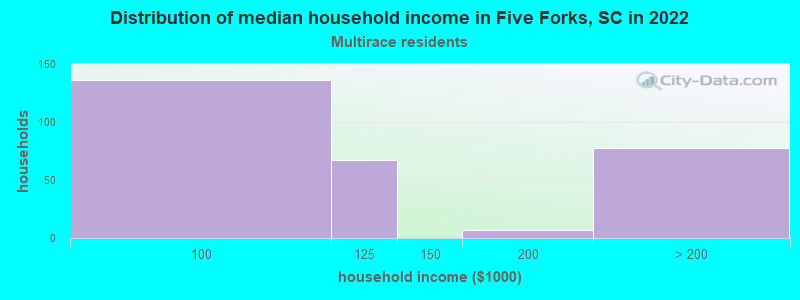
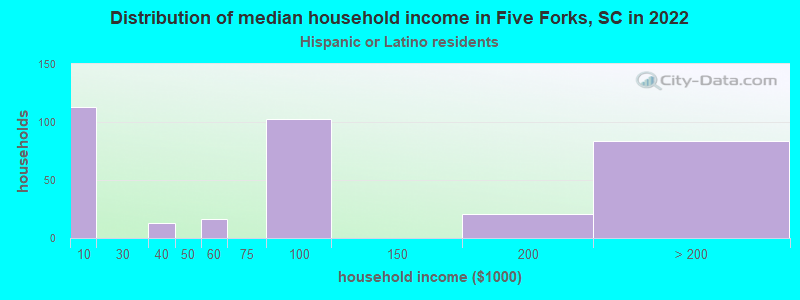
Income and house value in Five Forks Median household income in 2022 $136,565 White non-Hispanic householders$112,637 Black householders$133,800 Asian householders$134,208 Two or more races householders$95,136 Hispanic or Latino race householdersMedian 2022 house value $470,215 White Non-Hispanic householders$342,325 Black or African American householders$378,983 American Indian or Alaska Native householders $717,726 Asian householders$447,889 Native Hawaiian and other Pacific Islander householders$447,889 Some other race householders$430,801 Hispanic or Latino householders
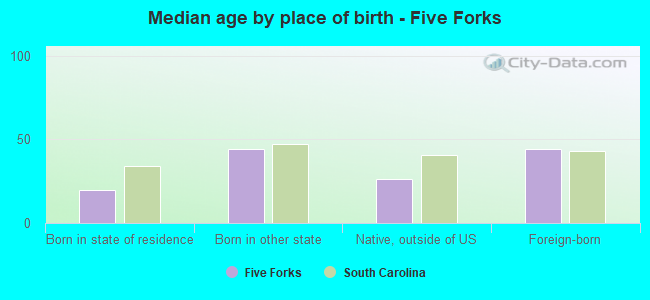
Median age by race in Five Forks
38.3 Median age for White residents34.2 45.8 33.8 Median age for Black or African American residents36.9 34.2 27.8 Median age for American Indian / Alaska Native residents-862,419,205.0 27.7 44.0 Median age for Asian residents36.6 45.3 -698,412,697.7 Median age for Native Hawaiian / Pacific Islander residents-551,574,375.1 -1,016,109,044.8 17.1 Median age for Other race residents16.1 27.4 34.1 Median age for Two or more races residents14.9 36.7 39.2 Median age for White alone residents35.0 45.3 26.2 Median age for Hispanic or Latino residents17.5 34.2
Owner/renter occupied households by race in Five Forks
House owners and renters - White residents 4,559 91.4% Owner occupied430 8.6% Renter occupiedHouse owners and renters - Black or African American residents 404 90.4% Owner occupied43 9.6% Renter occupiedHouse owners and renters - American Indian / Alaska Native residents 7 100.0% Owner occupiedHouse owners and renters - Asian residents 717 99.3% Owner occupied5 0.7% Renter occupiedHouse owners and renters - Other race residents 108 30.1% Owner occupied250 69.9% Renter occupiedHouse owners and renters - Two or more races residents 271 99.2% Owner occupied2 0.8% Renter occupiedHouse owners and renters - White alone residents 4,482 91.0% Owner occupied444 9.0% Renter occupiedHouse owners and renters - Hispanic or Latino residents 310 75.7% Owner occupied100 24.3% Renter occupied
Language usage in Five Forks
English speakers - Total 87.3% of residents of Five Forks speak English at home.
3.7% of residents speak Spanish at home 538 80.1% Speak English very well134 19.9% Speak English less than very well8.8% of residents speak other language at home 1,161 73.2% Speak English very well425 26.8% Speak English less than very well
English speakers - Born in the United States 94.5% of residents of Five Forks speak English at home.
1.8% of residents speak Spanish at home 136 76.8% Speak English very well41 23.2% Speak English less than very well2.6% of residents speak other language at home 201 76.4% Speak English very well62 23.6% Speak English less than very well
English speakers - Native, born elsewhere 40.9% of residents of Five Forks speak English at home.
63.6% of residents speak Spanish at home 190 79.8% Speak English very well48 20.2% Speak English less than very well
English speakers - Foreign-born 17.3% of residents of Five Forks speak English at home.
16.2% of residents speak Spanish at home 247 88.2% Speak English very well33 11.8% Speak English less than very well75.7% of residents speak other language at home 995 75.9% Speak English very well316 24.1% Speak English less than very well
White (Caucasian) - Speak only English Native:
97.7% (13,003)Foreign-born:
29.2% (165)
White (Caucasian) - Speak another language Native:
2.2% (295)Foreign-born:
64.9% (368)
Asian - Speak only English Native:
54.8% (195)Foreign-born:
14.4% (110)
Asian - Speak another language Native:
37.0% (132)Foreign-born:
85.6% (654)
Other race - Speak only English Native:
100.0% (825)Foreign-born:
12.3% (17)
Other race - Speak another language Native:
7.8% (64)Foreign-born:
87.9% (122)
Two or more races - Speak another language Native:
11.6% (79)Foreign-born:
100.0% (135)
White alone - Speak only English Native:
99.2% (12,805)Foreign-born:
23.0% (161)
White alone - Speak another language Native:
0.8% (106)Foreign-born:
73.8% (518)
Hispanic or Latino - Speak only English Native:
59.1% (559)Foreign-born:
9.3% (27)
Hispanic or Latino - Speak another language Native:
43.1% (408)Foreign-born:
90.9% (262)
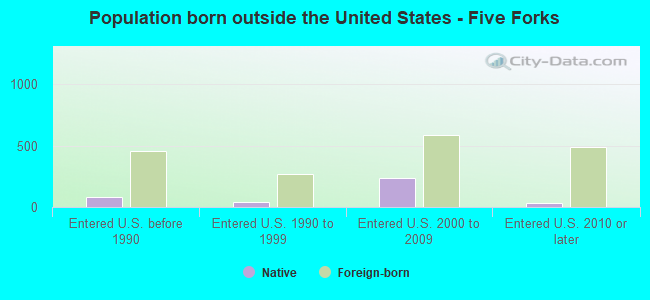
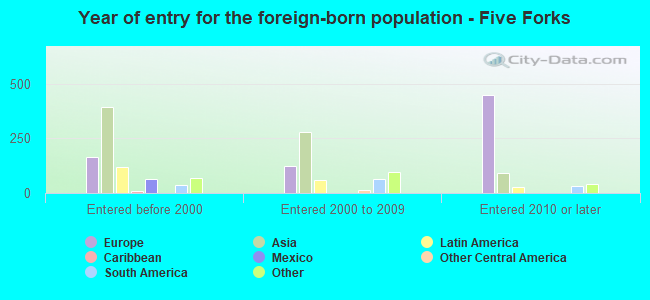
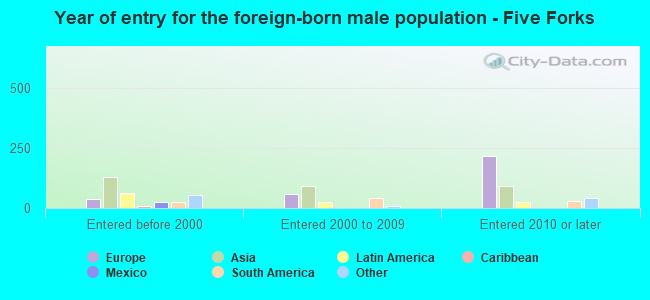
Foreign-born residents in Five Forks 1,894 residents are foreign born (4.2% Asia , 3.6% Europe , 1.3% Latin America ).
This city:
9.8%South Carolina:
5.3%
Marital status for residents in Five Forks Marital status - White (Caucasian) population 15 years and over
Males 29.2% Never married66.5% Now married0.2% Separated1.0% Widowed3.1% DivorcedFemales 14.8% Never married68.7% Now married1.0% Separated6.0% Widowed9.4% DivorcedWomen who gave birth in the past 12 months Now married:
91.3% (242)Unmarried:
8.7% (23)
Women who did not give birth in the past 12 months Now married:
60.1% (1,480)Unmarried:
39.9% (982)
Marital status - Black or African American population 15 years and over
Males 39.9% Never married50.2% Now married0.0% Separated0.0% Widowed10.0% DivorcedFemales 45.1% Never married49.8% Now married0.0% Separated1.5% Widowed3.7% DivorcedWomen who did not give birth in the past 12 months Now married:
37.4% (162)Unmarried:
62.6% (272)
Marital status - American Indian / Alaska Native population 15 years and over
Males 61.5% Never married38.5% Now married0.0% Separated0.0% Widowed0.0% DivorcedFemales 37.5% Never married62.5% Now married0.0% Separated0.0% Widowed0.0% DivorcedWomen who did not give birth in the past 12 months Now married:
62.5% (14)Unmarried:
37.5% (8)
Marital status - Asian population 15 years and over
Males 5.3% Never married94.7% Now married0.0% Separated0.0% Widowed0.0% DivorcedFemales 36.4% Never married50.0% Now married0.0% Separated9.4% Widowed4.1% DivorcedWomen who did not give birth in the past 12 months Now married:
46.4% (235)Unmarried:
53.6% (272)
Marital status - Other race population 15 years and over
Males 13.5% Never married72.5% Now married0.0% Separated0.0% Widowed14.0% DivorcedFemales 61.9% Never married27.9% Now married0.0% Separated10.2% Widowed0.0% DivorcedWomen who did not give birth in the past 12 months Now married:
26.0% (100)Unmarried:
74.0% (285)
Marital status - Two or more races population 15 years and over
Males 24.7% Never married52.5% Now married0.0% Separated0.0% Widowed22.8% DivorcedFemales 8.4% Never married82.6% Now married8.7% Separated0.0% Widowed0.3% DivorcedWomen who gave birth in the past 12 months Now married:
93.5% (32)Unmarried:
6.5% (2)
Women who did not give birth in the past 12 months Now married:
90.6% (243)Unmarried:
9.4% (25)
Marital status - White alone, not Hispanic / Latino population 15 years and over
Males 28.0% Never married67.7% Now married0.2% Separated1.1% Widowed3.0% DivorcedFemales 15.0% Never married68.3% Now married1.0% Separated6.1% Widowed9.6% DivorcedWomen who gave birth in the past 12 months Now married:
91.3% (247)Unmarried:
8.7% (23)
Women who did not give birth in the past 12 months Now married:
59.4% (1,455)Unmarried:
40.6% (995)
Marital status - Hispanic or Latino population 15 years and over
Males 42.1% Never married48.4% Now married0.0% Separated0.0% Widowed9.4% DivorcedFemales 30.3% Never married61.0% Now married0.0% Separated8.8% Widowed0.0% DivorcedWomen who gave birth in the past 12 months Now married:
100.0% (31)Unmarried:
0.0% (0)
Women who did not give birth in the past 12 months Now married:
58.1% (197)Unmarried:
41.9% (142)
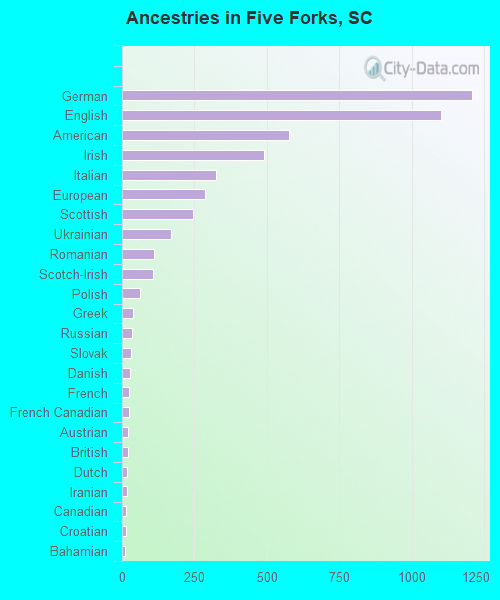
Ancestries in Five Forks
1,207 17.3% German1,100 15.8% English575 8.2% American490 7.0% Irish323 4.6% Italian285 4.1% European245 3.5% Scottish169 2.4% Ukrainian111 1.6% Romanian108 1.5% Scotch-Irish62 0.9% Polish39 0.6% Greek33 0.5% Russian30 0.4% Slovak27 0.4% Danish25 0.4% French24 0.3% French Canadian20 0.3% Austrian19 0.3% British17 0.2% Dutch16 0.2% Iranian15 0.2% Canadian13 0.2% Croatian11 0.2% Bahamian6 0.09% Hungarian
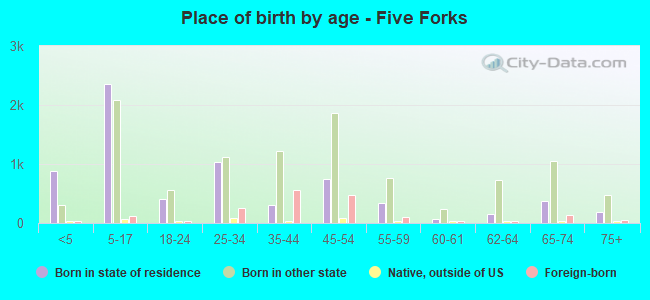
Children Nativity (place of birth) in Five Forks
Children under 6 years - Living with two parents Both parents native 1,121 100.0% NativeBoth parents foreign-born 132 78.6% Native36 21.4% Foreign-bornOne native, one foreign-born parent 42 100.0% NativeChildren under 6 years - Living with one parent Native parent 80 100.0% NativeChildren 6 to 17 years - Living with two parents Both parents native 3,616 99.4% Native22 0.6% Foreign-bornBoth parents foreign-born 185 68.0% Native87 32.0% Foreign-bornOne native, one foreign-born parent 253 100.0% NativeChildren 6 to 17 years - Living with one parent Native parent 283 100.0% NativeForeign-born parent 62 54.8% Native51 45.2% Foreign-born
Grandparents responsible for own grandchildren in Five Forks
Grandparents (30 to 59 years) White / Caucasian 46 100.0% Not responsible for grandchildrenBlack or African American 55 66.3% Responsible for grandchildren28 33.7% Not responsible for grandchildrenWhite alone, not Hispanic / Latino 52 100.0% Not responsible for grandchildren
Grandparents (60 years and over) White / Caucasian 17 100.0% Not responsible for grandchildrenWhite alone, not Hispanic / Latino 17 100.0% Not responsible for grandchildren