Races in Fleming Island, Florida (FL) Detailed Stats
Data:
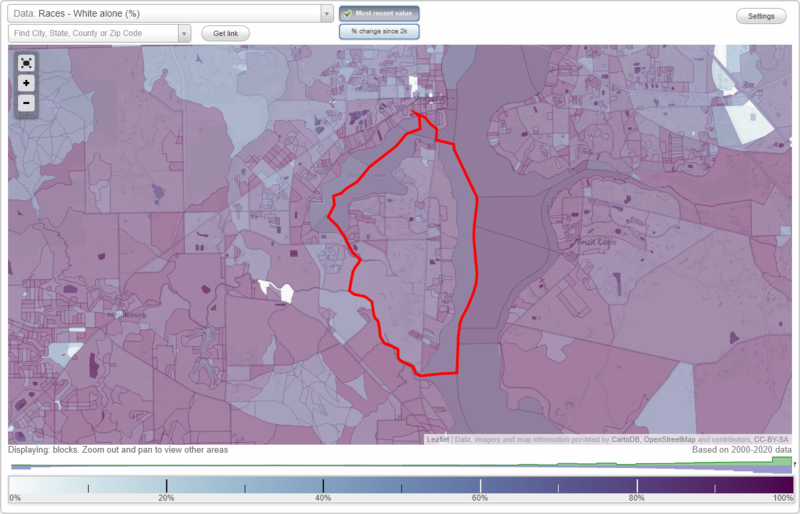
Races - White alone (%)
Races - White alone (% change since 2000)
Races - Black alone (%)
Races - Black alone (% change since 2000)
Races - American Indian alone (%)
Races - American Indian alone (% change since 2000)
Races - Asian alone (%)
Races - Asian alone (% change since 2000)
Races - Hispanic (%)
Races - Hispanic (% change since 2000)
Races - Native Hawaiian and Other Pacific Islander alone (%)
Races - Native Hawaiian and Other Pacific Islander alone (% change since 2000)
Races - Two or more races(%)
Races - Two or more races(% change since 2000)
Races - Other race alone (%)
Races - Other race alone (% change since 2000)
Racial diversity
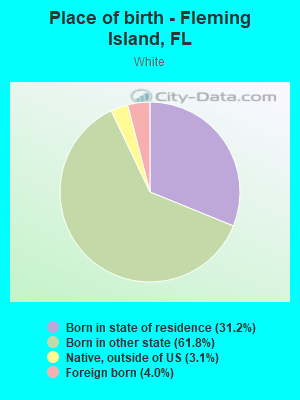
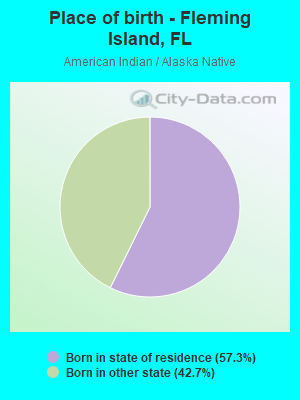
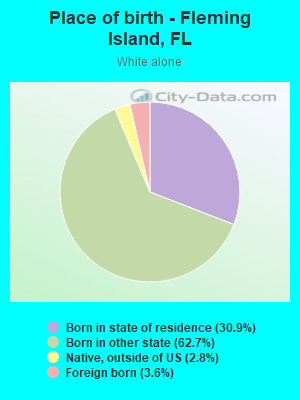
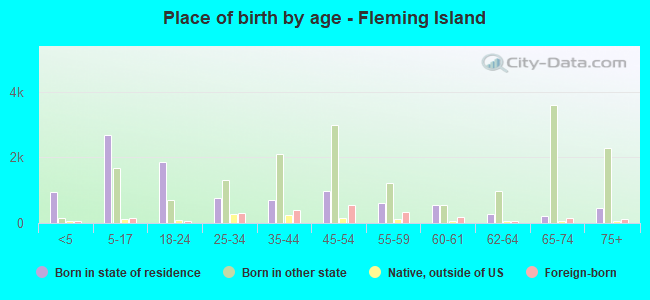
Place of birth - Born in state of residence (%)
Place of birth - Born in state of residence (%) - White
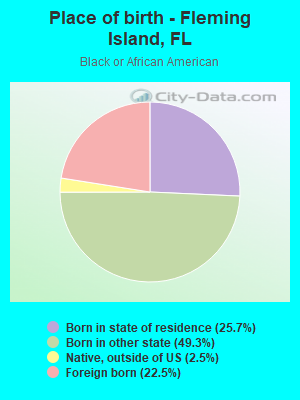
Place of birth - Born in state of residence (%) - Black or African American
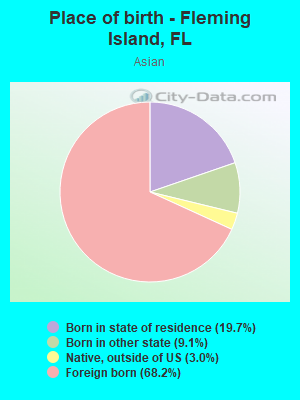
Place of birth - Born in state of residence (%) - Asian
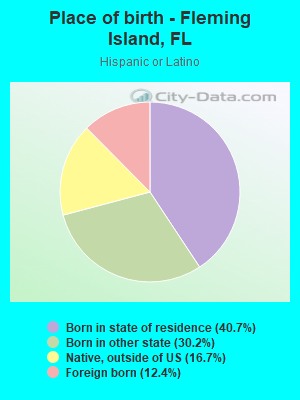
Place of birth - Born in state of residence (%) - Hispanic or Latino
Place of birth - Born in state of residence (%) - American Indian and Alaska Native
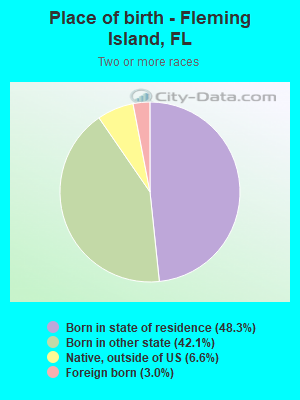
Place of birth - Born in state of residence (%) - Multirace
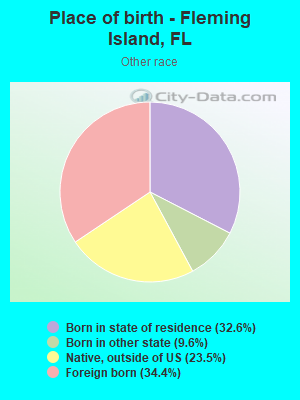
Place of birth - Born in state of residence (%) - Other Race
Place of birth - Born in other state (%)
Place of birth - Born in other state (%) - White
Place of birth - Born in other state (%) - Black or African American
Place of birth - Born in other state (%) - Asian
Place of birth - Born in other state (%) - Hispanic or Latino
Place of birth - Born in other state (%) - American Indian and Alaska Native
Place of birth - Born in other state (%) - Multirace
Place of birth - Born in other state (%) - Other Race
Place of birth - Native, outside of US (%)
Place of birth - Native, outside of US (%) - White
Place of birth - Native, outside of US (%) - Black or African American
Place of birth - Native, outside of US (%) - Asian
Place of birth - Native, outside of US (%) - Hispanic or Latino
Place of birth - Native, outside of US (%) - American Indian and Alaska Native
Place of birth - Native, outside of US (%) - Multirace
Place of birth - Native, outside of US (%) - Other Race
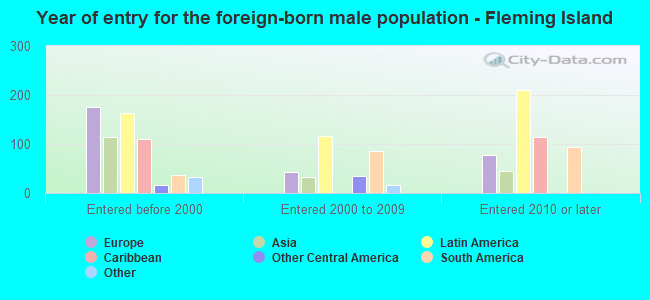
Place of birth - Foreign born (%)
Place of birth - Foreign born (%) - White
Place of birth - Foreign born (%) - Black or African American
Place of birth - Foreign born (%) - Asian
Place of birth - Foreign born (%) - Hispanic or Latino
Place of birth - Foreign born (%) - American Indian and Alaska Native
Place of birth - Foreign born (%) - Multirace
Place of birth - Foreign born (%) - Other Race
Residents speaking English at home (%)
Residents speaking English at home - Born in the United States (%)
Residents speaking English at home - Native, born elsewhere (%)
Residents speaking English at home - Foreign born (%)
Residents speaking Spanish at home (%)
Residents speaking Spanish at home - Born in the United States (%)
Residents speaking Spanish at home - Native, born elsewhere (%)
Residents speaking Spanish at home - Foreign born (%)
Residents speaking other language at home (%)
Residents speaking other language at home - Born in the United States (%)
Residents speaking other language at home - Native, born elsewhere (%)
Residents speaking other language at home - Foreign born (%)
Marital status - Never married (%)
Marital status - Now married (%)
Marital status - Separated (%)
Marital status - Widowed (%)
Marital status - Divorced (%)
Ancestries Reported - Arab (%)
Ancestries Reported - Czech (%)
Ancestries Reported - Danish (%)
Ancestries Reported - Dutch (%)
Ancestries Reported - English (%)
Ancestries Reported - French (%)
Ancestries Reported - French Canadian (%)
Ancestries Reported - German (%)
Ancestries Reported - Greek (%)
Ancestries Reported - Hungarian (%)
Ancestries Reported - Irish (%)
Ancestries Reported - Italian (%)
Ancestries Reported - Lithuanian (%)
Ancestries Reported - Norwegian (%)
Ancestries Reported - Polish (%)
Ancestries Reported - Portuguese (%)
Ancestries Reported - Russian (%)
Ancestries Reported - Scotch-Irish (%)
Ancestries Reported - Scottish (%)
Ancestries Reported - Slovak (%)
Ancestries Reported - Subsaharan African (%)
Ancestries Reported - Swedish (%)
Ancestries Reported - Swiss (%)
Ancestries Reported - Ukrainian (%)
Ancestries Reported - United States (%)
Ancestries Reported - Welsh (%)
Ancestries Reported - West Indian (%)
Ancestries Reported - Other (%)
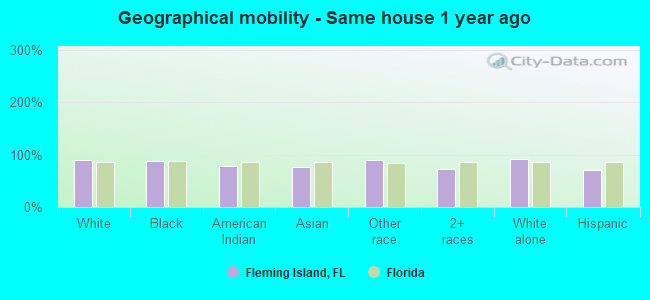
Geographical mobility - Same house 1 year ago (%)
Geographical mobility - Same house 1 year ago (%) - White
Geographical mobility - Same house 1 year ago (%) - Black or African American
Geographical mobility - Same house 1 year ago (%) - Asian
Geographical mobility - Same house 1 year ago (%) - Hispanic or Latino
Geographical mobility - Same house 1 year ago (%) - American Indian and Alaska Native
Geographical mobility - Same house 1 year ago (%) - Multirace
Geographical mobility - Same house 1 year ago (%) - Other Race
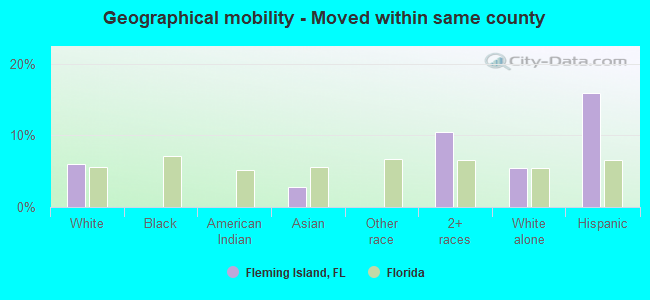
Geographical mobility - Moved within same county (%)
Geographical mobility - Moved within same county (%) - White
Geographical mobility - Moved within same county (%) - Black or African American
Geographical mobility - Moved within same county (%) - Asian
Geographical mobility - Moved within same county (%) - Hispanic or Latino
Geographical mobility - Moved within same county (%) - American Indian and Alaska Native
Geographical mobility - Moved within same county (%) - Multirace
Geographical mobility - Moved within same county (%) - Other Race
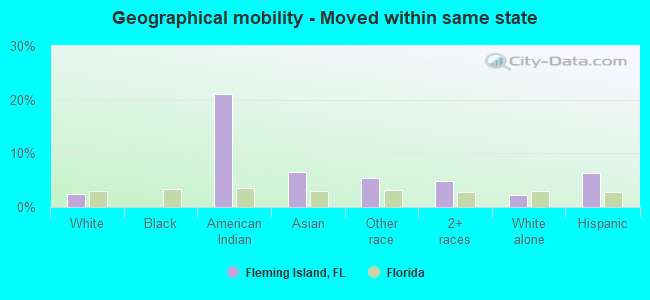
Geographical mobility - Moved from different county within same state (%)
Geographical mobility - Moved from different county within same state (%) - White
Geographical mobility - Moved from different county within same state (%) - Black or African American
Geographical mobility - Moved from different county within same state (%) - Asian
Geographical mobility - Moved from different county within same state (%) - Hispanic or Latino
Geographical mobility - Moved from different county within same state (%) - American Indian and Alaska Native
Geographical mobility - Moved from different county within same state (%) - Multirace
Geographical mobility - Moved from different county within same state (%) - Other Race
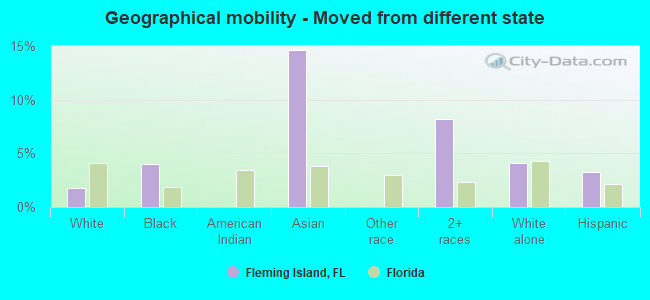
Geographical mobility - Moved from different state (%)
Geographical mobility - Moved from different state (%) - White
Geographical mobility - Moved from different state (%) - Black or African American
Geographical mobility - Moved from different state (%) - Asian
Geographical mobility - Moved from different state (%) - Hispanic or Latino
Geographical mobility - Moved from different state (%) - American Indian and Alaska Native
Geographical mobility - Moved from different state (%) - Multirace
Geographical mobility - Moved from different state (%) - Other Race
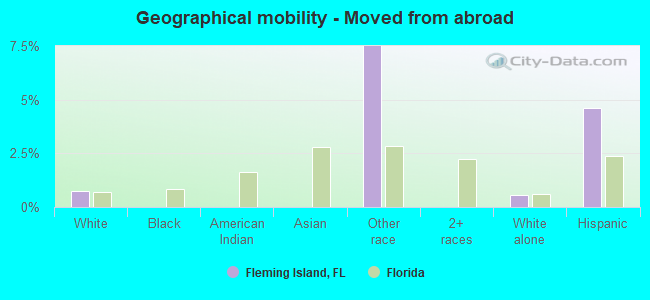
Geographical mobility - Moved from abroad (%)
Geographical mobility - Moved from abroad (%) - White
Geographical mobility - Moved from abroad (%) - Black or African American
Geographical mobility - Moved from abroad (%) - Asian
Geographical mobility - Moved from abroad (%) - Hispanic or Latino
Geographical mobility - Moved from abroad (%) - American Indian and Alaska Native
Geographical mobility - Moved from abroad (%) - Multirace
Geographical mobility - Moved from abroad (%) - Other Race
Place of birth for the foreign-born population - Ireland (%)
Place of birth for the foreign-born population - Denmark (%)
Place of birth for the foreign-born population - Norway (%)
Place of birth for the foreign-born population - Sweden (%)
Place of birth for the foreign-born population - United Kingdom (%)
Place of birth for the foreign-born population - England (%)
Place of birth for the foreign-born population - Scotland (%)
Place of birth for the foreign-born population - Other Northern Europe (%)
Place of birth for the foreign-born population - Austria (%)
Place of birth for the foreign-born population - Belgium (%)
Place of birth for the foreign-born population - France (%)
Place of birth for the foreign-born population - Germany (%)
Place of birth for the foreign-born population - Netherlands (%)
Place of birth for the foreign-born population - Switzerland (%)
Place of birth for the foreign-born population - Other Western Europe (%)
Place of birth for the foreign-born population - Greece (%)
Place of birth for the foreign-born population - Italy (%)
Place of birth for the foreign-born population - Portugal (%)
Place of birth for the foreign-born population - Spain (%)
Place of birth for the foreign-born population - Other Southern Europe (%)
Place of birth for the foreign-born population - Albania (%)
Place of birth for the foreign-born population - Belarus (%)
Place of birth for the foreign-born population - Bosnia and Herzegovina (%)
Place of birth for the foreign-born population - Bulgaria (%)
Place of birth for the foreign-born population - Croatia (%)
Place of birth for the foreign-born population - Czechoslovakia (%)
Place of birth for the foreign-born population - Hungary (%)
Place of birth for the foreign-born population - Latvia (%)
Place of birth for the foreign-born population - Lithuania (%)
Place of birth for the foreign-born population - North Macedonia (Macedonia) (%)
Place of birth for the foreign-born population - Moldova (%)
Place of birth for the foreign-born population - Poland (%)
Place of birth for the foreign-born population - Romania (%)
Place of birth for the foreign-born population - Russia (%)
Place of birth for the foreign-born population - Serbia (%)
Place of birth for the foreign-born population - Ukraine (%)
Place of birth for the foreign-born population - Other Eastern Europe (%)
Place of birth for the foreign-born population - China (%)
Place of birth for the foreign-born population - Hong Kong (%)
Place of birth for the foreign-born population - Taiwan (%)
Place of birth for the foreign-born population - Japan (%)
Place of birth for the foreign-born population - Korea (%)
Place of birth for the foreign-born population - Other Eastern Asia (%)
Place of birth for the foreign-born population - Afghanistan (%)
Place of birth for the foreign-born population - Bangladesh (%)
Place of birth for the foreign-born population - India (%)
Place of birth for the foreign-born population - Iran (%)
Place of birth for the foreign-born population - Kazakhstan (%)
Place of birth for the foreign-born population - Nepal (%)
Place of birth for the foreign-born population - Pakistan (%)
Place of birth for the foreign-born population - Sri Lanka (%)
Place of birth for the foreign-born population - Uzbekistan (%)
Place of birth for the foreign-born population - Other South Central Asia (%)
Place of birth for the foreign-born population - Burma (%)
Place of birth for the foreign-born population - Cambodia (%)
Place of birth for the foreign-born population - Indonesia (%)
Place of birth for the foreign-born population - Laos (%)
Place of birth for the foreign-born population - Malaysia (%)
Place of birth for the foreign-born population - Philippines (%)
Place of birth for the foreign-born population - Singapore (%)
Place of birth for the foreign-born population - Thailand (%)
Place of birth for the foreign-born population - Vietnam (%)
Place of birth for the foreign-born population - Other South Eastern Asia (%)
Place of birth for the foreign-born population - Armenia (%)
Place of birth for the foreign-born population - Iraq (%)
Place of birth for the foreign-born population - Israel (%)
Place of birth for the foreign-born population - Jordan (%)
Place of birth for the foreign-born population - Kuwait (%)
Place of birth for the foreign-born population - Lebanon (%)
Place of birth for the foreign-born population - Saudi Arabia (%)
Place of birth for the foreign-born population - Syria (%)
Place of birth for the foreign-born population - Turkey (%)
Place of birth for the foreign-born population - Yemen (%)
Place of birth for the foreign-born population - Other Western Asia (%)
Place of birth for the foreign-born population - Eritrea (%)
Place of birth for the foreign-born population - Ethiopia (%)
Place of birth for the foreign-born population - Kenya (%)
Place of birth for the foreign-born population - Somalia (%)
Place of birth for the foreign-born population - Uganda (%)
Place of birth for the foreign-born population - Zimbabwe (%)
Place of birth for the foreign-born population - Other Eastern Africa (%)
Place of birth for the foreign-born population - Cameroon (%)
Place of birth for the foreign-born population - Congo (%)
Place of birth for the foreign-born population - Democratic Republic of Congo (Zaire) (%)
Place of birth for the foreign-born population - Other Middle Africa (%)
Place of birth for the foreign-born population - Egypt (%)
Place of birth for the foreign-born population - Morocco (%)
Place of birth for the foreign-born population - Sudan (%)
Place of birth for the foreign-born population - Other Northern Africa (%)
Place of birth for the foreign-born population - South Africa (%)
Place of birth for the foreign-born population - Other Southern Africa (%)
Place of birth for the foreign-born population - Cabo Verde (%)
Place of birth for the foreign-born population - Ghana (%)
Place of birth for the foreign-born population - Liberia (%)
Place of birth for the foreign-born population - Nigeria (%)
Place of birth for the foreign-born population - Senegal (%)
Place of birth for the foreign-born population - Sierra Leone (%)
Place of birth for the foreign-born population - Other Western Africa (%)
Place of birth for the foreign-born population - Australia (%)
Place of birth for the foreign-born population - New Zealand (%)
Place of birth for the foreign-born population - Fiji (%)
Place of birth for the foreign-born population - Micronesia (%)
Place of birth for the foreign-born population - Bahamas (%)
Place of birth for the foreign-born population - Barbados (%)
Place of birth for the foreign-born population - Cuba (%)
Place of birth for the foreign-born population - Dominica (%)
Place of birth for the foreign-born population - Dominican Republic (%)
Place of birth for the foreign-born population - Grenada (%)
Place of birth for the foreign-born population - Haiti (%)
Place of birth for the foreign-born population - Jamaica (%)
Place of birth for the foreign-born population - St. Vincent and the Grenadines (%)
Place of birth for the foreign-born population - Trinidad and Tobago (%)
Place of birth for the foreign-born population - West Indies (%)
Place of birth for the foreign-born population - Other Caribbean (%)
Place of birth for the foreign-born population - Belize (%)
Place of birth for the foreign-born population - Costa Rica (%)
Place of birth for the foreign-born population - El Salvador (%)
Place of birth for the foreign-born population - Guatemala (%)
Place of birth for the foreign-born population - Honduras (%)
Place of birth for the foreign-born population - Mexico (%)
Place of birth for the foreign-born population - Nicaragua (%)
Place of birth for the foreign-born population - Panama (%)
Place of birth for the foreign-born population - Other Central America (%)
Place of birth for the foreign-born population - Argentina (%)
Place of birth for the foreign-born population - Bolivia (%)
Place of birth for the foreign-born population - Brazil (%)
Place of birth for the foreign-born population - Chile (%)
Place of birth for the foreign-born population - Colombia (%)
Place of birth for the foreign-born population - Ecuador (%)
Place of birth for the foreign-born population - Guyana (%)
Place of birth for the foreign-born population - Peru (%)
Place of birth for the foreign-born population - Uruguay (%)
Place of birth for the foreign-born population - Venezuela (%)
Place of birth for the foreign-born population - Other South America (%)
Place of birth for the foreign-born population - Canada (%)
Place of birth for the foreign-born population - Other Northern America (%)
Place of birth for the foreign-born population - Other (%)
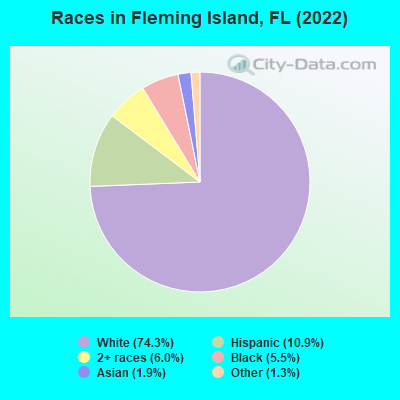
According to 2022 data, the most numerous races in Fleming Island, FL are White alone (22,862 residents), Hispanic (3,353 residents), and Black alone (1,685 residents). 90.1% of Fleming Island residents speak English at home.
Race distribution in Fleming Island 22,862 74.3% White alone 3,353 10.9% Hispanic 1,843 6.0% Two or more races 1,685 5.5% Black alone 598 1.9% Asian alone 387 1.3% Other race alone 25 0.08% American Indian alone
2000 2022
10,458,509 65.4% White alone 2,682,715 16.8% Hispanic 2,264,268 14.2% Black alone 261,693 1.6% Asian alone 236,954 1.5% Two or more races 42,358 0.3% American Indian alone 28,994 0.2% Other race alone 6,887 0.04% Native Hawaiian and Other
11,309,403 50.8% White alone 6,025,039 27.1% Hispanic 3,241,015 14.6% Black alone 861,630 3.9% Two or more races 623,692 2.8% Asian alone 152,054 0.7% Other race alone 22,504 0.1% American Indian alone 9,486 0.04% Native Hawaiian and Other
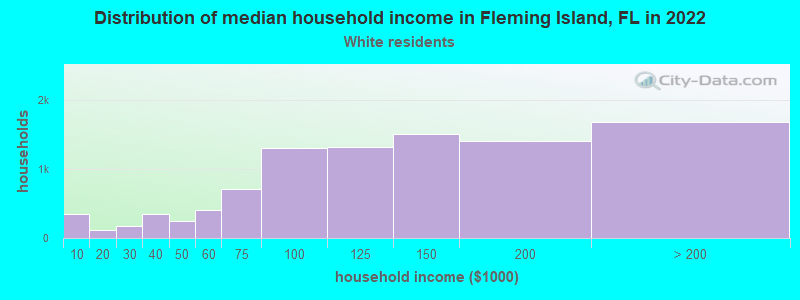
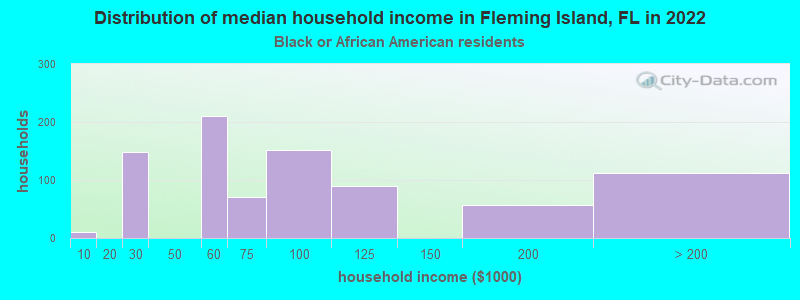
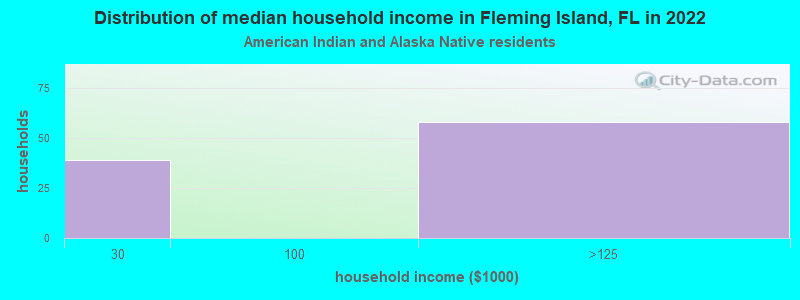
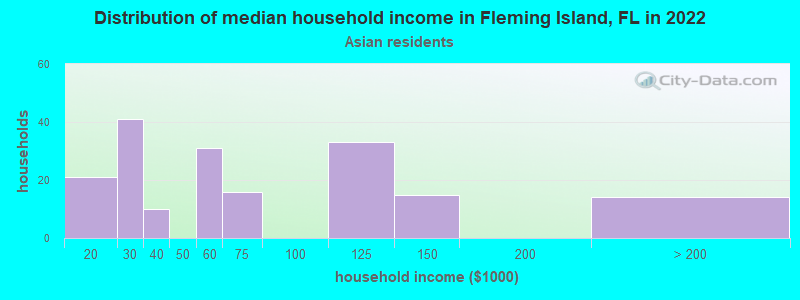
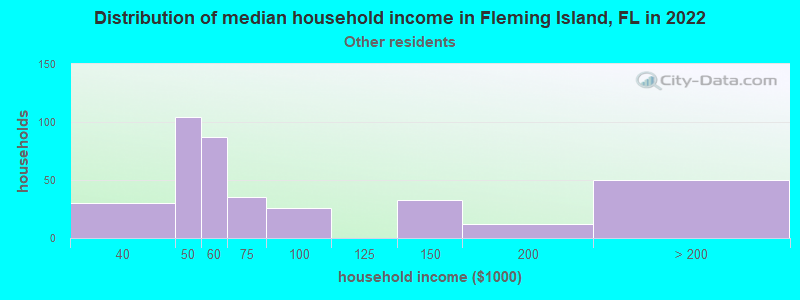
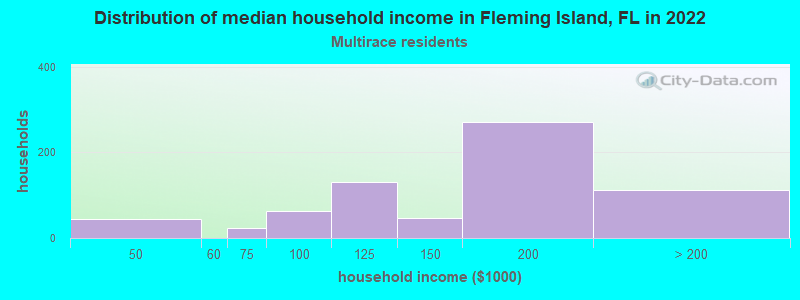
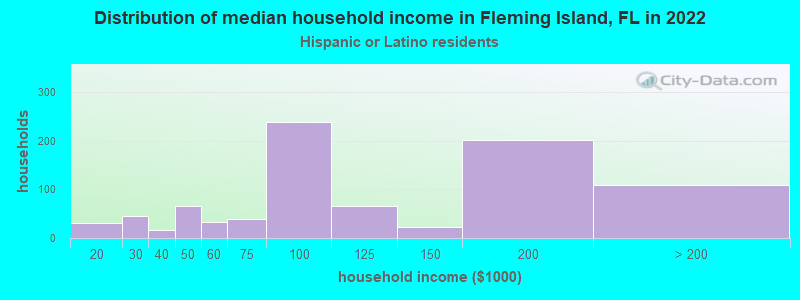
Income and house value in Fleming Island Median household income in 2022 $138,922 White non-Hispanic householders$75,970 Black householders$46,320 Asian householders$69,223 Some other race householders$169,729 Two or more races householders$90,280 Hispanic or Latino race householders
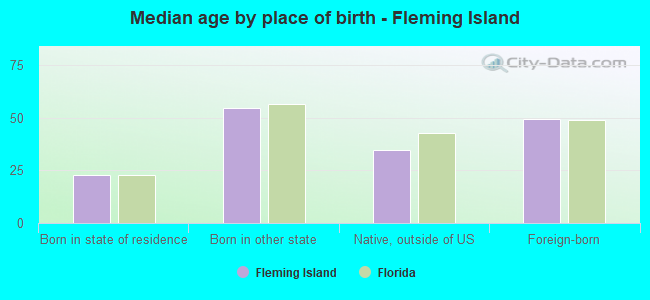
Median age by race in Fleming Island
48.5 Median age for White residents49.0 49.2 35.8 Median age for Black or African American residents35.8 42.0 44.4 Median age for American Indian / Alaska Native residents-673,283,704.9 -594,925,633.7 38.7 Median age for Asian residents33.7 45.4 -679,849,340.2 Median age for Native Hawaiian / Pacific Islander residents-666,666,666.0 -666,666,666.0 41.0 Median age for Other race residents30.2 48.9 26.2 Median age for Two or more races residents27.2 24.6 51.1 Median age for White alone residents51.2 50.1 30.9 Median age for Hispanic or Latino residents27.8 34.6
Owner/renter occupied households by race in Fleming Island
House owners and renters - White residents 8,602 87.3% Owner occupied1,252 12.7% Renter occupiedHouse owners and renters - Black or African American residents 505 77.9% Owner occupied143 22.1% Renter occupiedHouse owners and renters - American Indian / Alaska Native residents 52 63.2% Owner occupied30 36.8% Renter occupiedHouse owners and renters - Asian residents 177 93.5% Owner occupied12 6.5% Renter occupiedHouse owners and renters - Other race residents 139 40.5% Owner occupied204 59.5% Renter occupiedHouse owners and renters - Two or more races residents 727 91.1% Owner occupied71 8.9% Renter occupiedHouse owners and renters - White alone residents 8,387 88.5% Owner occupied1,085 11.5% Renter occupiedHouse owners and renters - Hispanic or Latino residents 631 66.5% Owner occupied319 33.5% Renter occupied
Language usage in Fleming Island
English speakers - Total 90.1% of residents of Fleming Island speak English at home.
5.0% of residents speak Spanish at home 1,109 74.3% Speak English very well384 25.7% Speak English less than very well4.8% of residents speak other language at home 1,160 81.7% Speak English very well260 18.3% Speak English less than very well
English speakers - Born in the United States 98.1% of residents of Fleming Island speak English at home.
1.5% of residents speak Spanish at home 245 95.0% Speak English very well13 5.0% Speak English less than very well0.5% of residents speak other language at home 95 100.0% Speak English very well
English speakers - Native, born elsewhere 67.1% of residents of Fleming Island speak English at home.
34.7% of residents speak Spanish at home 361 87.8% Speak English very well50 12.2% Speak English less than very well
English speakers - Foreign-born 49.3% of residents of Fleming Island speak English at home.
16.7% of residents speak Spanish at home 175 47.4% Speak English very well194 52.6% Speak English less than very well39.9% of residents speak other language at home 643 72.9% Speak English very well239 27.1% Speak English less than very well
White (Caucasian) - Speak only English Native:
98.9% (21,946)Foreign-born:
45.2% (435)
White (Caucasian) - Speak another language Native:
1.6% (344)Foreign-born:
55.9% (538)
Black or African American - Speak only English Native:
96.8% (1,397)Foreign-born:
58.0% (207)
Black or African American - Speak another language Native:
3.0% (44)Foreign-born:
41.1% (146)
Asian - Speak only English Native:
63.9% (81)Foreign-born:
34.3% (148)
Asian - Speak another language Native:
18.4% (23)Foreign-born:
67.6% (292)
Other race - Speak only English Native:
37.3% (294)Foreign-born:
6.8% (24)
Other race - Speak another language Native:
52.3% (412)Foreign-born:
80.0% (276)
Two or more races - Speak only English Native:
61.8% (1,677)Foreign-born:
18.9% (17)
Two or more races - Speak another language Native:
37.8% (1,025)Foreign-born:
64.1% (59)
White alone - Speak only English Native:
98.4% (20,928)Foreign-born:
53.5% (443)
White alone - Speak another language Native:
1.6% (335)Foreign-born:
42.1% (349)
Hispanic or Latino - Speak only English Native:
64.2% (1,852)Foreign-born:
10.8% (46)
Hispanic or Latino - Speak another language Native:
36.2% (1,043)Foreign-born:
89.2% (376)
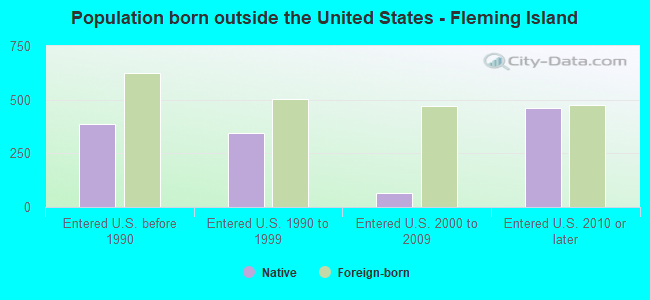
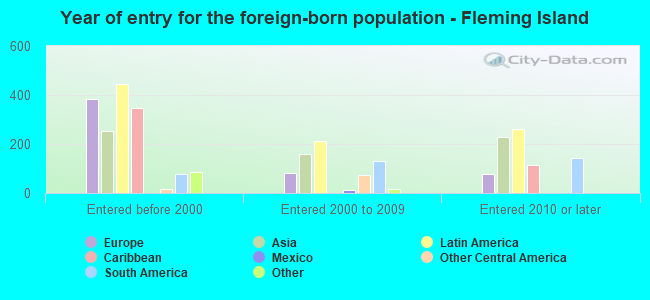
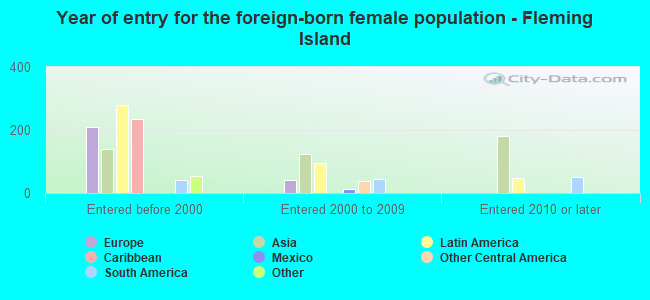
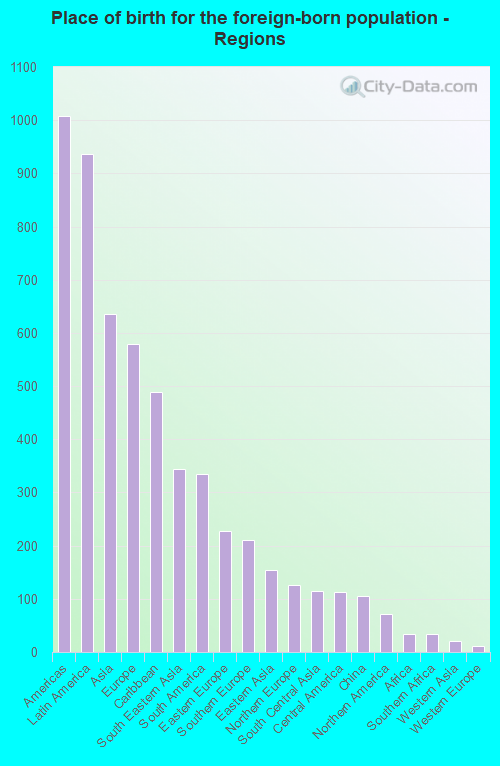
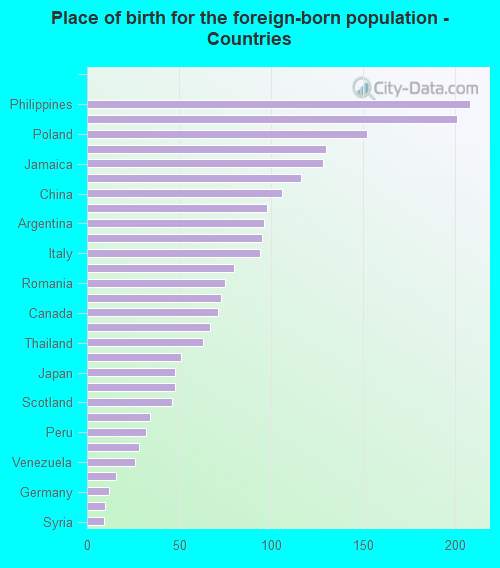
Foreign-born residents in Fleming Island
Marital status for residents in Fleming Island Marital status - White (Caucasian) population 15 years and over
Males 21.0% Never married71.2% Now married0.3% Separated1.9% Widowed5.7% DivorcedFemales 16.2% Never married66.9% Now married0.8% Separated7.2% Widowed8.9% DivorcedWomen who gave birth in the past 12 months Now married:
100.0% (173)Unmarried:
0.0% (0)
Women who did not give birth in the past 12 months Now married:
57.7% (2,680)Unmarried:
42.3% (1,967)
Marital status - Black or African American population 15 years and over
Males 45.8% Never married52.1% Now married0.0% Separated2.1% Widowed0.0% DivorcedFemales 31.3% Never married50.8% Now married0.0% Separated0.0% Widowed17.9% DivorcedWomen who did not give birth in the past 12 months Now married:
26.4% (91)Unmarried:
73.6% (253)
Marital status - American Indian / Alaska Native population 15 years and over
Males 100.0% Never married0.0% Now married0.0% Separated0.0% Widowed0.0% DivorcedFemales 0.0% Never married67.2% Now married0.0% Separated32.8% Widowed0.0% DivorcedWomen who did not give birth in the past 12 months Now married:
100.0% (67)Unmarried:
0.0% (0)
Marital status - Asian population 15 years and over
Males 9.1% Never married76.6% Now married0.0% Separated4.8% Widowed9.5% DivorcedFemales 35.0% Never married55.3% Now married0.0% Separated2.3% Widowed7.5% DivorcedWomen who gave birth in the past 12 months Now married:
100.0% (10)Unmarried:
0.0% (0)
Women who did not give birth in the past 12 months Now married:
45.7% (83)Unmarried:
54.3% (99)
Marital status - Other race population 15 years and over
Males 36.6% Never married63.4% Now married0.0% Separated0.0% Widowed0.0% DivorcedFemales 10.5% Never married68.4% Now married0.0% Separated0.0% Widowed21.1% DivorcedWomen who did not give birth in the past 12 months Now married:
54.7% (275)Unmarried:
45.3% (228)
Marital status - Two or more races population 15 years and over
Males 43.2% Never married47.4% Now married0.0% Separated2.0% Widowed7.4% DivorcedFemales 35.9% Never married60.7% Now married0.0% Separated2.8% Widowed0.6% DivorcedWomen who gave birth in the past 12 months Now married:
100.0% (15)Unmarried:
0.0% (0)
Women who did not give birth in the past 12 months Now married:
39.9% (262)Unmarried:
60.1% (394)
Marital status - White alone, not Hispanic / Latino population 15 years and over
Males 19.9% Never married71.8% Now married0.3% Separated2.0% Widowed6.0% DivorcedFemales 15.7% Never married67.0% Now married0.8% Separated7.4% Widowed9.0% DivorcedWomen who gave birth in the past 12 months Now married:
100.0% (164)Unmarried:
0.0% (0)
Women who did not give birth in the past 12 months Now married:
58.5% (2,601)Unmarried:
41.5% (1,841)
Marital status - Hispanic or Latino population 15 years and over
Males 43.3% Never married54.1% Now married0.0% Separated0.8% Widowed1.7% DivorcedFemales 28.4% Never married58.9% Now married0.0% Separated1.0% Widowed11.8% DivorcedWomen who gave birth in the past 12 months Now married:
100.0% (11)Unmarried:
0.0% (0)
Women who did not give birth in the past 12 months Now married:
41.8% (344)Unmarried:
58.2% (479)
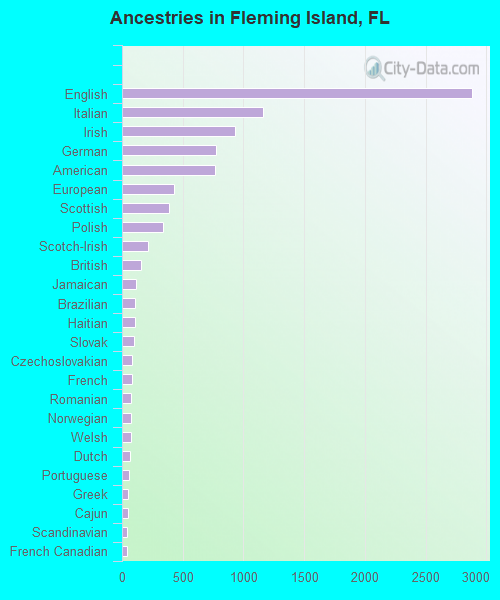
Ancestries in Fleming Island
2,879 23.6% English1,158 9.5% Italian932 7.7% Irish771 6.3% German765 6.3% American428 3.5% European390 3.2% Scottish340 2.8% Polish217 1.8% Scotch-Irish153 1.3% British119 1.0% Jamaican108 0.9% Brazilian108 0.9% Haitian97 0.8% Slovak80 0.7% Czechoslovakian80 0.7% French77 0.6% Romanian76 0.6% Norwegian73 0.6% Welsh64 0.5% Dutch58 0.5% Portuguese52 0.4% Greek49 0.4% Cajun43 0.4% Scandinavian41 0.3% French Canadian39 0.3% Eastern European38 0.3% Swedish27 0.2% Hungarian25 0.2% Lithuanian17 0.1% Russian10 0.08% Jordanian7 0.06% Australian4 0.03% Pennsylvania German
Geographical mobility in Fleming Island Same house 1 year ago 21,302 89.6% White (Caucasian)1,540 87.3% Black or African American98 78.1% American Indian / Alaska Native592 76.1% Asian1,251 88.9% Other race2,138 72.3% Two or more races20,663 91.2% White alone, not Hispanic / Latino2,421 71.4% Hispanic or LatinoMoved within same county 1,421 6.0% White / Caucasian21 2.7% Asian312 10.5% Two or more races1,249 5.5% White alone, not Hispanic / Latino540 15.9% Hispanic or LatinoMoved within same state 582 2.4% White / Caucasian26 21.0% American Indian / Alaska Native51 6.5% Asian76 5.4% Other race144 4.9% Two or more races505 2.2% White alone, not Hispanic / Latino215 6.3% Hispanic or LatinoMoved from different state 422 1.8% White / Caucasian70 4.0% Black or African American114 14.7% Asian242 8.2% Two or more races934 4.1% White alone, not Hispanic / Latino110 3.2% Hispanic or LatinoMoved from abroad 177 0.7% White106 7.5% Other race126 0.6% White alone, not Hispanic / Latino156 4.6% Hispanic or Latino
Children Nativity (place of birth) in Fleming Island
Children under 6 years - Living with two parents Both parents native 969 100.0% NativeBoth parents foreign-born 114 100.0% NativeOne native, one foreign-born parent 47 100.0% NativeChildren under 6 years - Living with one parent Native parent 160 100.0% NativeForeign-born parent 11 100.0% NativeChildren 6 to 17 years - Living with two parents Both parents native 2,799 96.8% Native92 3.2% Foreign-bornBoth parents foreign-born 479 90.6% Native50 9.4% Foreign-bornOne native, one foreign-born parent 242 100.0% NativeChildren 6 to 17 years - Living with one parent Native parent 320 100.0% NativeForeign-born parent 257 55.0% Native210 45.0% Foreign-born
Grandparents responsible for own grandchildren in Fleming Island
Grandparents (30 to 59 years) White / Caucasian 65 69.7% Responsible for grandchildren28 30.3% Not responsible for grandchildrenOther race 21 100.0% Not responsible for grandchildrenWhite alone, not Hispanic / Latino 76 67.6% Responsible for grandchildren36 32.4% Not responsible for grandchildrenHispanic or Latino 16 100.0% Not responsible for grandchildrenGrandparents (60 years and over) White / Caucasian 85 24.0% Responsible for grandchildren270 76.0% Not responsible for grandchildrenWhite alone, not Hispanic / Latino 85 25.1% Responsible for grandchildren256 74.9% Not responsible for grandchildrenHispanic or Latino 23 100.0% Not responsible for grandchildren