Races in Foothill Farms, California (CA) Detailed Stats
Data:
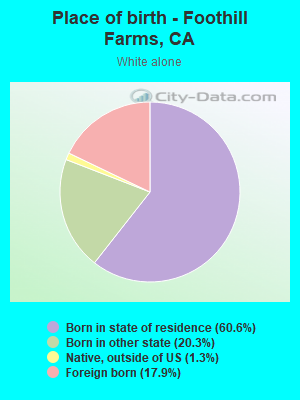
Races - White alone (%)
Races - White alone (% change since 2000)
Races - Black alone (%)
Races - Black alone (% change since 2000)
Races - American Indian alone (%)
Races - American Indian alone (% change since 2000)
Races - Asian alone (%)
Races - Asian alone (% change since 2000)
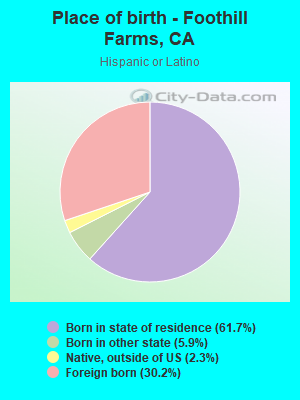
Races - Hispanic (%)
Races - Hispanic (% change since 2000)
Races - Native Hawaiian and Other Pacific Islander alone (%)
Races - Native Hawaiian and Other Pacific Islander alone (% change since 2000)
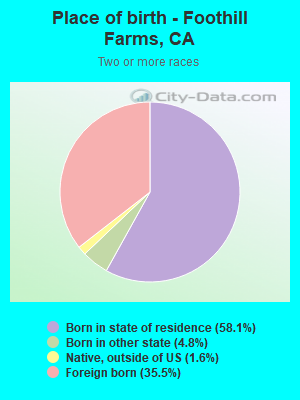
Races - Two or more races(%)
Races - Two or more races(% change since 2000)
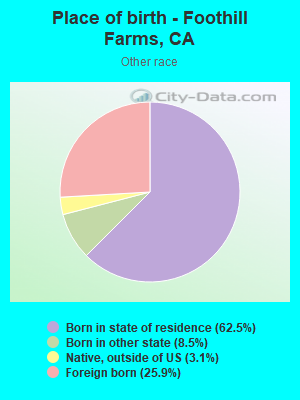
Races - Other race alone (%)
Races - Other race alone (% change since 2000)
Racial diversity
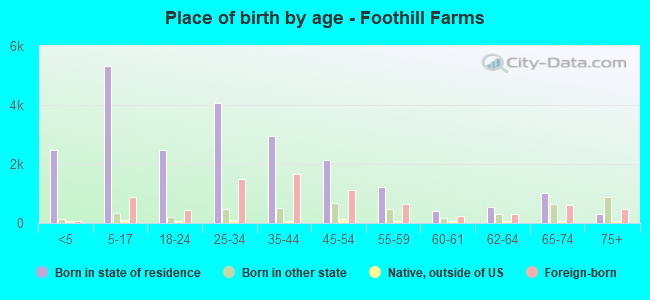
Place of birth - Born in state of residence (%)
Place of birth - Born in state of residence (%) - White
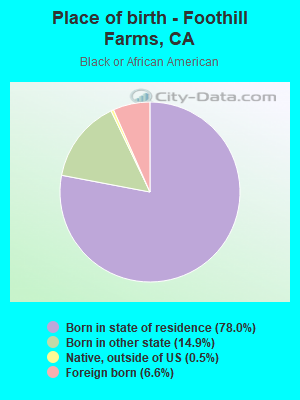
Place of birth - Born in state of residence (%) - Black or African American
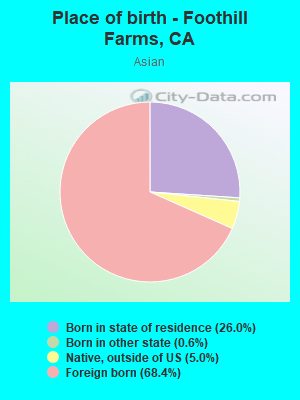
Place of birth - Born in state of residence (%) - Asian
Place of birth - Born in state of residence (%) - Hispanic or Latino
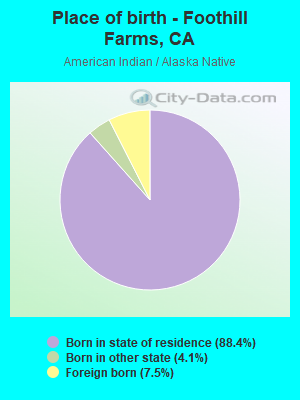
Place of birth - Born in state of residence (%) - American Indian and Alaska Native
Place of birth - Born in state of residence (%) - Multirace
Place of birth - Born in state of residence (%) - Other Race
Place of birth - Born in other state (%)
Place of birth - Born in other state (%) - White
Place of birth - Born in other state (%) - Black or African American
Place of birth - Born in other state (%) - Asian
Place of birth - Born in other state (%) - Hispanic or Latino
Place of birth - Born in other state (%) - American Indian and Alaska Native
Place of birth - Born in other state (%) - Multirace
Place of birth - Born in other state (%) - Other Race
Place of birth - Native, outside of US (%)
Place of birth - Native, outside of US (%) - White
Place of birth - Native, outside of US (%) - Black or African American
Place of birth - Native, outside of US (%) - Asian
Place of birth - Native, outside of US (%) - Hispanic or Latino
Place of birth - Native, outside of US (%) - American Indian and Alaska Native
Place of birth - Native, outside of US (%) - Multirace
Place of birth - Native, outside of US (%) - Other Race
Place of birth - Foreign born (%)
Place of birth - Foreign born (%) - White
Place of birth - Foreign born (%) - Black or African American
Place of birth - Foreign born (%) - Asian
Place of birth - Foreign born (%) - Hispanic or Latino
Place of birth - Foreign born (%) - American Indian and Alaska Native
Place of birth - Foreign born (%) - Multirace
Place of birth - Foreign born (%) - Other Race
Residents speaking English at home (%)
Residents speaking English at home - Born in the United States (%)
Residents speaking English at home - Native, born elsewhere (%)
Residents speaking English at home - Foreign born (%)
Residents speaking Spanish at home (%)
Residents speaking Spanish at home - Born in the United States (%)
Residents speaking Spanish at home - Native, born elsewhere (%)
Residents speaking Spanish at home - Foreign born (%)
Residents speaking other language at home (%)
Residents speaking other language at home - Born in the United States (%)
Residents speaking other language at home - Native, born elsewhere (%)
Residents speaking other language at home - Foreign born (%)
Marital status - Never married (%)
Marital status - Now married (%)
Marital status - Separated (%)
Marital status - Widowed (%)
Marital status - Divorced (%)
Ancestries Reported - Arab (%)
Ancestries Reported - Czech (%)
Ancestries Reported - Danish (%)
Ancestries Reported - Dutch (%)
Ancestries Reported - English (%)
Ancestries Reported - French (%)
Ancestries Reported - French Canadian (%)
Ancestries Reported - German (%)
Ancestries Reported - Greek (%)
Ancestries Reported - Hungarian (%)
Ancestries Reported - Irish (%)
Ancestries Reported - Italian (%)
Ancestries Reported - Lithuanian (%)
Ancestries Reported - Norwegian (%)
Ancestries Reported - Polish (%)
Ancestries Reported - Portuguese (%)
Ancestries Reported - Russian (%)
Ancestries Reported - Scotch-Irish (%)
Ancestries Reported - Scottish (%)
Ancestries Reported - Slovak (%)
Ancestries Reported - Subsaharan African (%)
Ancestries Reported - Swedish (%)
Ancestries Reported - Swiss (%)
Ancestries Reported - Ukrainian (%)
Ancestries Reported - United States (%)
Ancestries Reported - Welsh (%)
Ancestries Reported - West Indian (%)
Ancestries Reported - Other (%)
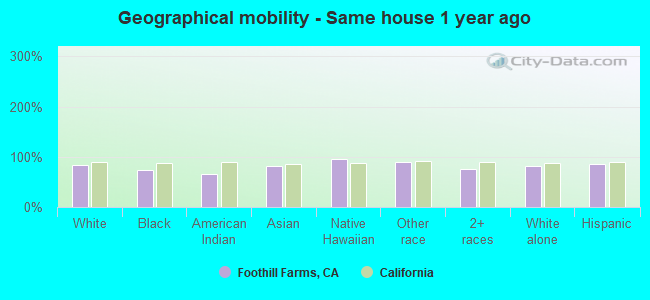
Geographical mobility - Same house 1 year ago (%)
Geographical mobility - Same house 1 year ago (%) - White
Geographical mobility - Same house 1 year ago (%) - Black or African American
Geographical mobility - Same house 1 year ago (%) - Asian
Geographical mobility - Same house 1 year ago (%) - Hispanic or Latino
Geographical mobility - Same house 1 year ago (%) - American Indian and Alaska Native
Geographical mobility - Same house 1 year ago (%) - Multirace
Geographical mobility - Same house 1 year ago (%) - Other Race
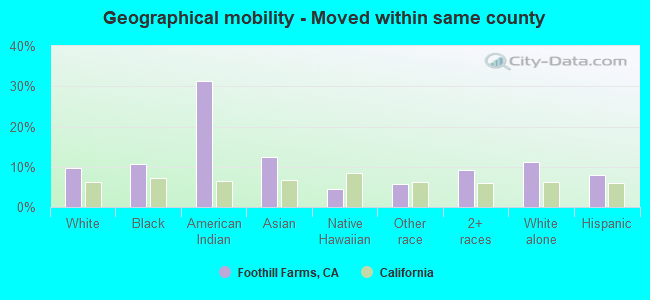
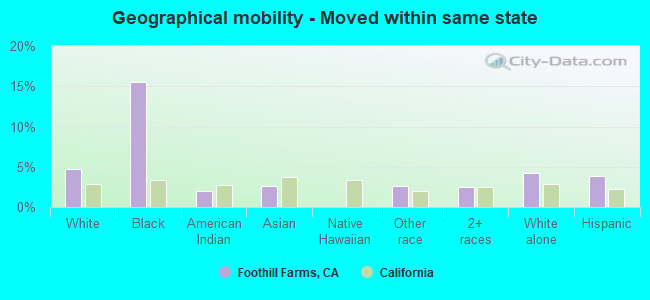
Geographical mobility - Moved within same county (%)
Geographical mobility - Moved within same county (%) - White
Geographical mobility - Moved within same county (%) - Black or African American
Geographical mobility - Moved within same county (%) - Asian
Geographical mobility - Moved within same county (%) - Hispanic or Latino
Geographical mobility - Moved within same county (%) - American Indian and Alaska Native
Geographical mobility - Moved within same county (%) - Multirace
Geographical mobility - Moved within same county (%) - Other Race
Geographical mobility - Moved from different county within same state (%)
Geographical mobility - Moved from different county within same state (%) - White
Geographical mobility - Moved from different county within same state (%) - Black or African American
Geographical mobility - Moved from different county within same state (%) - Asian
Geographical mobility - Moved from different county within same state (%) - Hispanic or Latino
Geographical mobility - Moved from different county within same state (%) - American Indian and Alaska Native
Geographical mobility - Moved from different county within same state (%) - Multirace
Geographical mobility - Moved from different county within same state (%) - Other Race
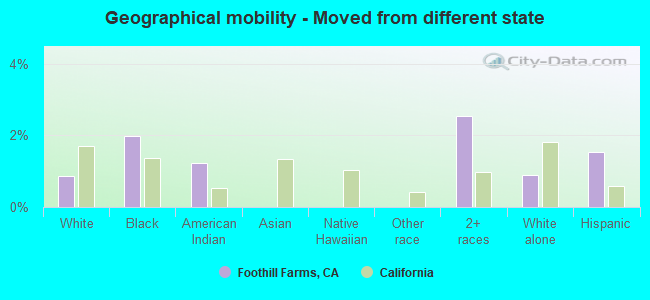
Geographical mobility - Moved from different state (%)
Geographical mobility - Moved from different state (%) - White
Geographical mobility - Moved from different state (%) - Black or African American
Geographical mobility - Moved from different state (%) - Asian
Geographical mobility - Moved from different state (%) - Hispanic or Latino
Geographical mobility - Moved from different state (%) - American Indian and Alaska Native
Geographical mobility - Moved from different state (%) - Multirace
Geographical mobility - Moved from different state (%) - Other Race
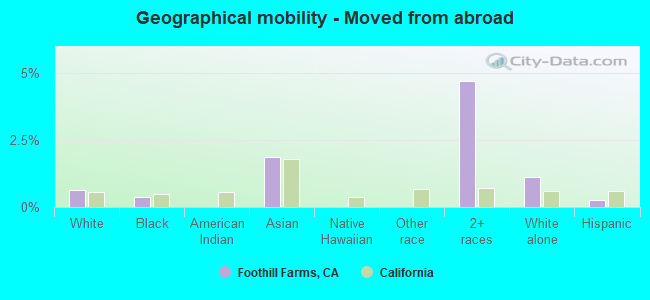
Geographical mobility - Moved from abroad (%)
Geographical mobility - Moved from abroad (%) - White
Geographical mobility - Moved from abroad (%) - Black or African American
Geographical mobility - Moved from abroad (%) - Asian
Geographical mobility - Moved from abroad (%) - Hispanic or Latino
Geographical mobility - Moved from abroad (%) - American Indian and Alaska Native
Geographical mobility - Moved from abroad (%) - Multirace
Geographical mobility - Moved from abroad (%) - Other Race
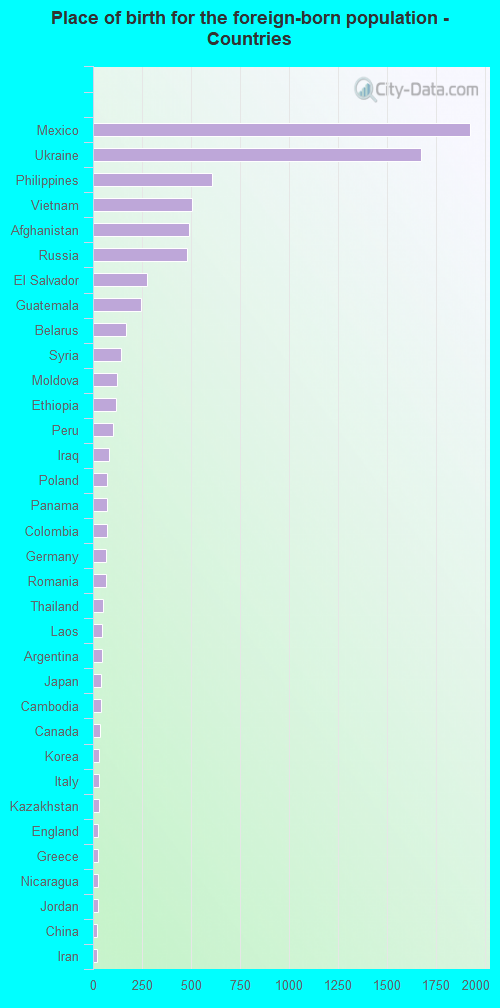
Place of birth for the foreign-born population - Ireland (%)
Place of birth for the foreign-born population - Denmark (%)
Place of birth for the foreign-born population - Norway (%)
Place of birth for the foreign-born population - Sweden (%)
Place of birth for the foreign-born population - United Kingdom (%)
Place of birth for the foreign-born population - England (%)
Place of birth for the foreign-born population - Scotland (%)
Place of birth for the foreign-born population - Other Northern Europe (%)
Place of birth for the foreign-born population - Austria (%)
Place of birth for the foreign-born population - Belgium (%)
Place of birth for the foreign-born population - France (%)
Place of birth for the foreign-born population - Germany (%)
Place of birth for the foreign-born population - Netherlands (%)
Place of birth for the foreign-born population - Switzerland (%)
Place of birth for the foreign-born population - Other Western Europe (%)
Place of birth for the foreign-born population - Greece (%)
Place of birth for the foreign-born population - Italy (%)
Place of birth for the foreign-born population - Portugal (%)
Place of birth for the foreign-born population - Spain (%)
Place of birth for the foreign-born population - Other Southern Europe (%)
Place of birth for the foreign-born population - Albania (%)
Place of birth for the foreign-born population - Belarus (%)
Place of birth for the foreign-born population - Bosnia and Herzegovina (%)
Place of birth for the foreign-born population - Bulgaria (%)
Place of birth for the foreign-born population - Croatia (%)
Place of birth for the foreign-born population - Czechoslovakia (%)
Place of birth for the foreign-born population - Hungary (%)
Place of birth for the foreign-born population - Latvia (%)
Place of birth for the foreign-born population - Lithuania (%)
Place of birth for the foreign-born population - North Macedonia (Macedonia) (%)
Place of birth for the foreign-born population - Moldova (%)
Place of birth for the foreign-born population - Poland (%)
Place of birth for the foreign-born population - Romania (%)
Place of birth for the foreign-born population - Russia (%)
Place of birth for the foreign-born population - Serbia (%)
Place of birth for the foreign-born population - Ukraine (%)
Place of birth for the foreign-born population - Other Eastern Europe (%)
Place of birth for the foreign-born population - China (%)
Place of birth for the foreign-born population - Hong Kong (%)
Place of birth for the foreign-born population - Taiwan (%)
Place of birth for the foreign-born population - Japan (%)
Place of birth for the foreign-born population - Korea (%)
Place of birth for the foreign-born population - Other Eastern Asia (%)
Place of birth for the foreign-born population - Afghanistan (%)
Place of birth for the foreign-born population - Bangladesh (%)
Place of birth for the foreign-born population - India (%)
Place of birth for the foreign-born population - Iran (%)
Place of birth for the foreign-born population - Kazakhstan (%)
Place of birth for the foreign-born population - Nepal (%)
Place of birth for the foreign-born population - Pakistan (%)
Place of birth for the foreign-born population - Sri Lanka (%)
Place of birth for the foreign-born population - Uzbekistan (%)
Place of birth for the foreign-born population - Other South Central Asia (%)
Place of birth for the foreign-born population - Burma (%)
Place of birth for the foreign-born population - Cambodia (%)
Place of birth for the foreign-born population - Indonesia (%)
Place of birth for the foreign-born population - Laos (%)
Place of birth for the foreign-born population - Malaysia (%)
Place of birth for the foreign-born population - Philippines (%)
Place of birth for the foreign-born population - Singapore (%)
Place of birth for the foreign-born population - Thailand (%)
Place of birth for the foreign-born population - Vietnam (%)
Place of birth for the foreign-born population - Other South Eastern Asia (%)
Place of birth for the foreign-born population - Armenia (%)
Place of birth for the foreign-born population - Iraq (%)
Place of birth for the foreign-born population - Israel (%)
Place of birth for the foreign-born population - Jordan (%)
Place of birth for the foreign-born population - Kuwait (%)
Place of birth for the foreign-born population - Lebanon (%)
Place of birth for the foreign-born population - Saudi Arabia (%)
Place of birth for the foreign-born population - Syria (%)
Place of birth for the foreign-born population - Turkey (%)
Place of birth for the foreign-born population - Yemen (%)
Place of birth for the foreign-born population - Other Western Asia (%)
Place of birth for the foreign-born population - Eritrea (%)
Place of birth for the foreign-born population - Ethiopia (%)
Place of birth for the foreign-born population - Kenya (%)
Place of birth for the foreign-born population - Somalia (%)
Place of birth for the foreign-born population - Uganda (%)
Place of birth for the foreign-born population - Zimbabwe (%)
Place of birth for the foreign-born population - Other Eastern Africa (%)
Place of birth for the foreign-born population - Cameroon (%)
Place of birth for the foreign-born population - Congo (%)
Place of birth for the foreign-born population - Democratic Republic of Congo (Zaire) (%)
Place of birth for the foreign-born population - Other Middle Africa (%)
Place of birth for the foreign-born population - Egypt (%)
Place of birth for the foreign-born population - Morocco (%)
Place of birth for the foreign-born population - Sudan (%)
Place of birth for the foreign-born population - Other Northern Africa (%)
Place of birth for the foreign-born population - South Africa (%)
Place of birth for the foreign-born population - Other Southern Africa (%)
Place of birth for the foreign-born population - Cabo Verde (%)
Place of birth for the foreign-born population - Ghana (%)
Place of birth for the foreign-born population - Liberia (%)
Place of birth for the foreign-born population - Nigeria (%)
Place of birth for the foreign-born population - Senegal (%)
Place of birth for the foreign-born population - Sierra Leone (%)
Place of birth for the foreign-born population - Other Western Africa (%)
Place of birth for the foreign-born population - Australia (%)
Place of birth for the foreign-born population - New Zealand (%)
Place of birth for the foreign-born population - Fiji (%)
Place of birth for the foreign-born population - Micronesia (%)
Place of birth for the foreign-born population - Bahamas (%)
Place of birth for the foreign-born population - Barbados (%)
Place of birth for the foreign-born population - Cuba (%)
Place of birth for the foreign-born population - Dominica (%)
Place of birth for the foreign-born population - Dominican Republic (%)
Place of birth for the foreign-born population - Grenada (%)
Place of birth for the foreign-born population - Haiti (%)
Place of birth for the foreign-born population - Jamaica (%)
Place of birth for the foreign-born population - St. Vincent and the Grenadines (%)
Place of birth for the foreign-born population - Trinidad and Tobago (%)
Place of birth for the foreign-born population - West Indies (%)
Place of birth for the foreign-born population - Other Caribbean (%)
Place of birth for the foreign-born population - Belize (%)
Place of birth for the foreign-born population - Costa Rica (%)
Place of birth for the foreign-born population - El Salvador (%)
Place of birth for the foreign-born population - Guatemala (%)
Place of birth for the foreign-born population - Honduras (%)
Place of birth for the foreign-born population - Mexico (%)
Place of birth for the foreign-born population - Nicaragua (%)
Place of birth for the foreign-born population - Panama (%)
Place of birth for the foreign-born population - Other Central America (%)
Place of birth for the foreign-born population - Argentina (%)
Place of birth for the foreign-born population - Bolivia (%)
Place of birth for the foreign-born population - Brazil (%)
Place of birth for the foreign-born population - Chile (%)
Place of birth for the foreign-born population - Colombia (%)
Place of birth for the foreign-born population - Ecuador (%)
Place of birth for the foreign-born population - Guyana (%)
Place of birth for the foreign-born population - Peru (%)
Place of birth for the foreign-born population - Uruguay (%)
Place of birth for the foreign-born population - Venezuela (%)
Place of birth for the foreign-born population - Other South America (%)
Place of birth for the foreign-born population - Canada (%)
Place of birth for the foreign-born population - Other Northern America (%)
Place of birth for the foreign-born population - Other (%)
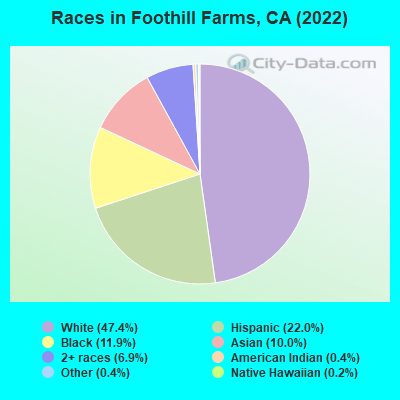
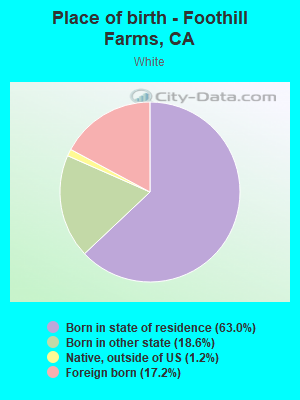
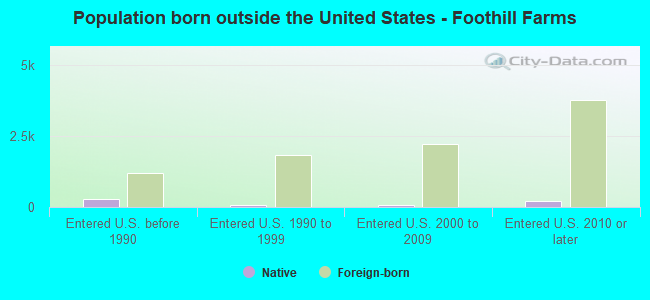
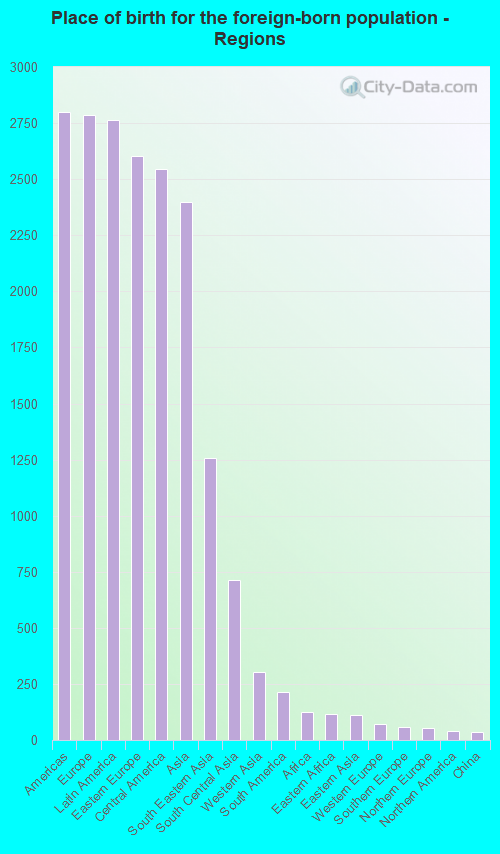
According to 2022 data, the most numerous races in Foothill Farms, CA are Hispanic (9,056 residents), White alone (17,395 residents), and Asian alone (2,052 residents). 66.8% of Foothill Farms residents speak English at home. 22.2% of Foothill Farms, CA residents are foreign-born (7.7% born in Europe, 7.6% born in Latin America, 6.6% born in Asia), which is 16.9% less than the foreign-born rate of 26.0% across the entire state of California.
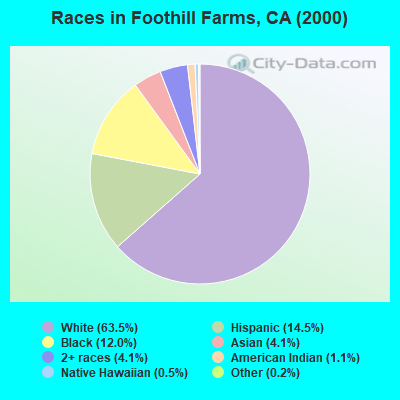
Race distribution in Foothill Farms
2000 2022
15,816,790 46.7% White alone 10,966,556 32.4% Hispanic 3,648,860 10.8% Asian alone 2,181,926 6.4% Black alone 903,115 2.7% Two or more races 178,984 0.5% American Indian alone 103,736 0.3% Native Hawaiian and Other 71,681 0.2% Other race alone
15,732,184 40.3% Hispanic 13,160,426 33.7% White alone 5,957,867 15.3% Asian alone 2,025,218 5.2% Black alone 1,663,222 4.3% Two or more races 251,618 0.6% Other race alone 135,777 0.3% Native Hawaiian and Other 103,030 0.3% American Indian alone
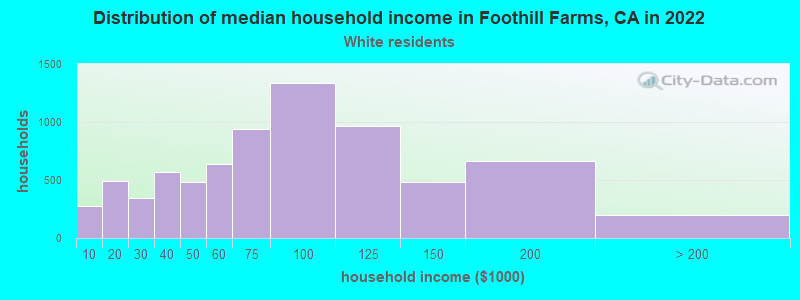
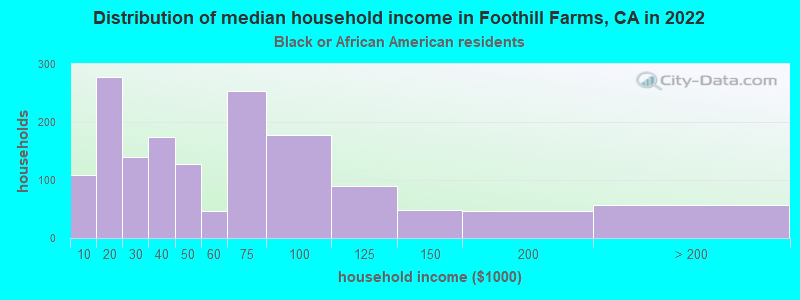
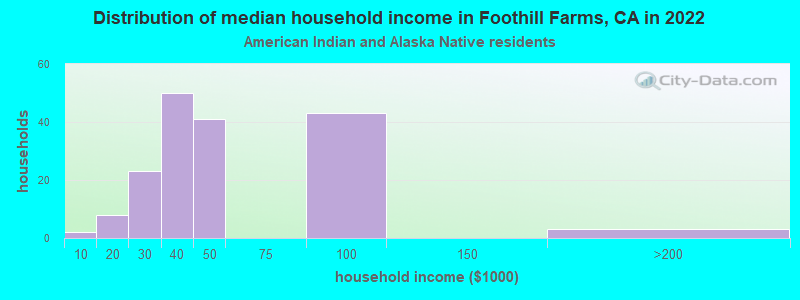
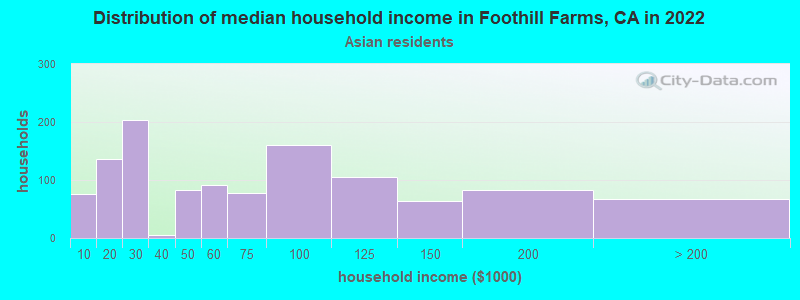
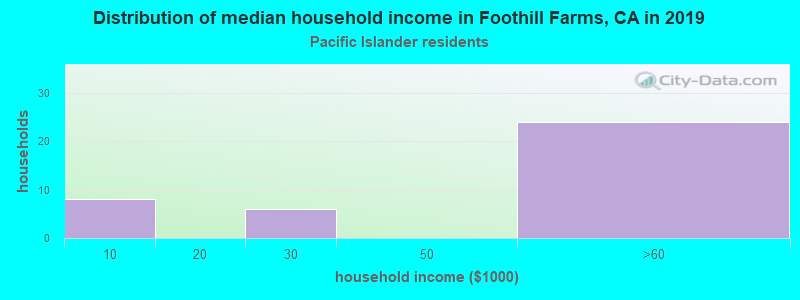
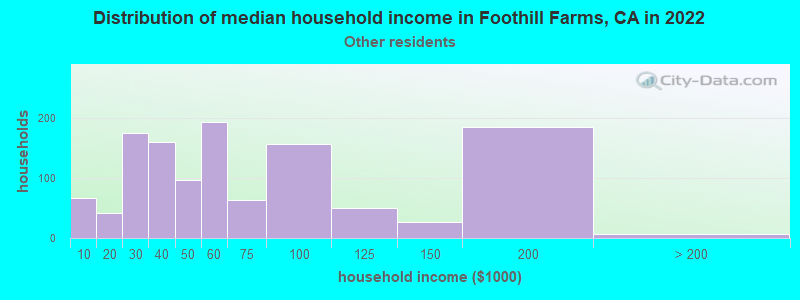
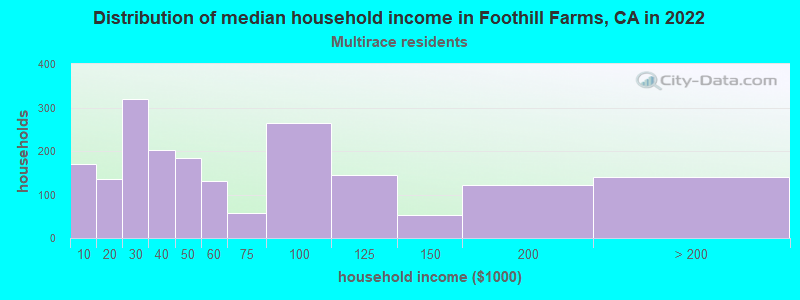
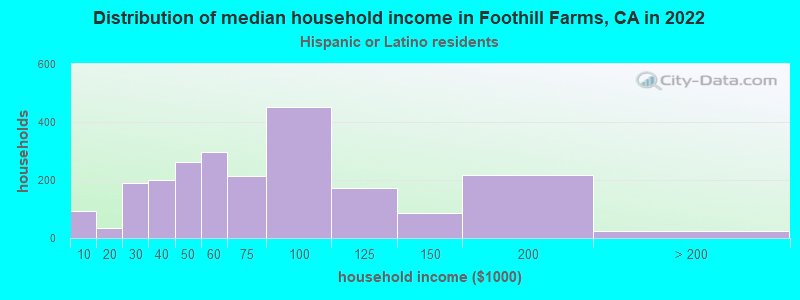
Income and house value in Foothill Farms Median household income in 2022 $76,156 White non-Hispanic householders$46,895 Black householders$90,839 American Indian and Alaska Native householders$66,964 Asian householders$82,434 Native Hawaiian and other Pacific Islander householders$64,249 Some other race householders$51,539 Two or more races householders$77,863 Hispanic or Latino race householdersMedian 2022 house value $436,954 White Non-Hispanic householders$435,154 Black or African American householders$385,844 American Indian or Alaska Native householders $467,908 Asian householders$326,096 Native Hawaiian and other Pacific Islander householders$396,282 Some other race householders$404,920 Two or more races householders$387,644 Hispanic or Latino householders
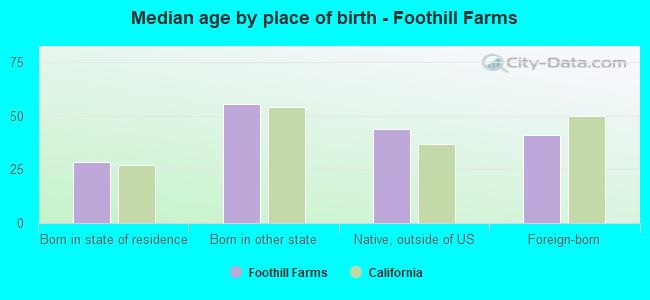
Median age by race in Foothill Farms
38.2 Median age for White residents36.8 39.6 29.3 Median age for Black or African American residents28.1 29.2 33.2 Median age for American Indian / Alaska Native residents35.2 34.8 45.0 Median age for Asian residents37.5 50.8 18.2 Median age for Native Hawaiian / Pacific Islander residents17.3 15.5 32.4 Median age for Other race residents32.7 32.4 23.3 Median age for Two or more races residents24.0 23.5 39.0 Median age for White alone residents37.3 40.3 29.1 Median age for Hispanic or Latino residents29.2 29.6
Owner/renter occupied households by race in Foothill Farms
House owners and renters - White residents 4,414 59.8% Owner occupied2,968 40.2% Renter occupiedHouse owners and renters - Black or African American residents 456 27.3% Owner occupied1,217 72.7% Renter occupiedHouse owners and renters - American Indian / Alaska Native residents 63 21.7% Owner occupied228 78.3% Renter occupiedHouse owners and renters - Asian residents 288 41.1% Owner occupied413 58.9% Renter occupiedHouse owners and renters - Native Hawaiian / Pacific Islander residents 7 16.9% Owner occupied34 83.1% Renter occupiedHouse owners and renters - Other race residents 182 28.6% Owner occupied454 71.4% Renter occupiedHouse owners and renters - Two or more races residents 635 31.3% Owner occupied1,394 68.7% Renter occupiedHouse owners and renters - White alone residents 4,268 63.4% Owner occupied2,468 36.6% Renter occupiedHouse owners and renters - Hispanic or Latino residents 823 31.5% Owner occupied1,785 68.5% Renter occupied
Language usage in Foothill Farms
English speakers - Total 66.8% of residents of Foothill Farms speak English at home.
15.2% of residents speak Spanish at home 3,360 66.6% Speak English very well1,684 33.4% Speak English less than very well18.2% of residents speak other language at home 2,768 45.8% Speak English very well3,273 54.2% Speak English less than very well
English speakers - Born in the United States 92.2% of residents of Foothill Farms speak English at home.
4.3% of residents speak Spanish at home 204 93.2% Speak English very well15 6.8% Speak English less than very well3.4% of residents speak other language at home 139 82.2% Speak English very well30 17.8% Speak English less than very well
English speakers - Native, born elsewhere 62.3% of residents of Foothill Farms speak English at home.
12.4% of residents speak Spanish at home 51 71.8% Speak English very well20 28.2% Speak English less than very well24.2% of residents speak other language at home 104 75.4% Speak English very well34 24.6% Speak English less than very well
English speakers - Foreign-born 7.0% of residents of Foothill Farms speak English at home.
32.0% of residents speak Spanish at home 1,029 40.9% Speak English very well1,484 59.1% Speak English less than very well61.1% of residents speak other language at home 1,769 36.8% Speak English very well3,034 63.2% Speak English less than very well
White (Caucasian) - Speak only English Native:
93.1% (13,423)Foreign-born:
8.5% (276)
White (Caucasian) - Speak another language Native:
9.1% (1,309)Foreign-born:
87.9% (2,841)
Black or African American - Speak only English Native:
95.7% (3,409)Foreign-born:
15.7% (46)
Black or African American - Speak another language Native:
4.6% (163)Foreign-born:
90.3% (263)
American Indian / Alaska Native - Speak another language Native:
19.1% (60)Foreign-born:
100.0% (55)
Asian - Speak only English Native:
46.4% (305)Foreign-born:
9.5% (136)
Asian - Speak another language Native:
53.5% (351)Foreign-born:
89.9% (1,283)
Native Hawaiian / Pacific Islander - Speak another language Native:
37.3% (49)Foreign-born:
98.8% (18)
Other race - Speak only English Native:
58.2% (873)Foreign-born:
2.8% (15)
Other race - Speak another language Native:
45.5% (682)Foreign-born:
96.7% (525)
Two or more races - Speak only English Native:
65.9% (3,926)Foreign-born:
1.2% (52)
Two or more races - Speak another language Native:
31.2% (1,858)Foreign-born:
100.0% (4,184)
White alone - Speak only English Native:
94.3% (12,450)Foreign-born:
9.2% (288)
White alone - Speak another language Native:
5.5% (732)Foreign-born:
91.0% (2,857)
Hispanic or Latino - Speak only English Native:
59.3% (3,371)Foreign-born:
2.8% (69)
Hispanic or Latino - Speak another language Native:
41.9% (2,383)Foreign-born:
96.7% (2,424)
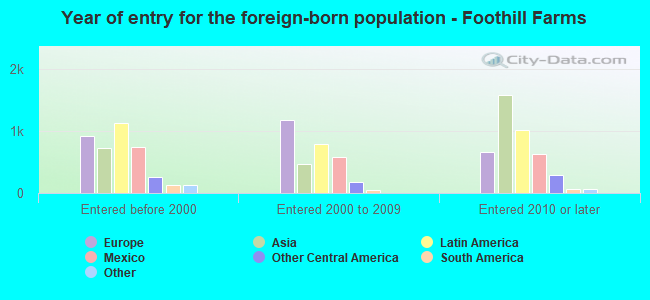
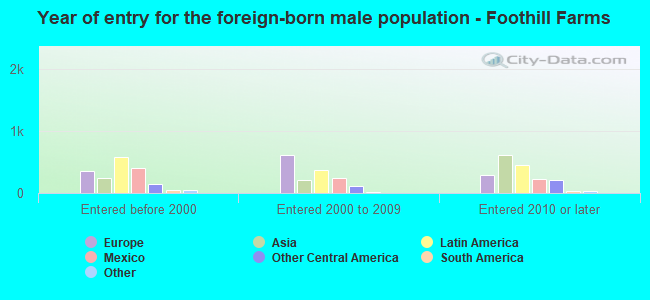
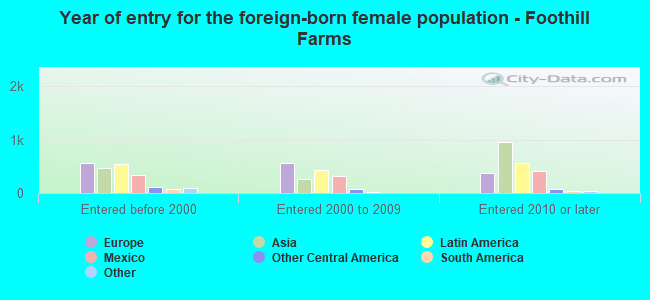
Foreign-born residents in Foothill Farms 8,139 residents are foreign born (7.7% Europe , 7.6% Latin America , 6.6% Asia ).
This city:
22.2%California:
100.0%
Marital status for residents in Foothill Farms Marital status - White (Caucasian) population 15 years and over
Males 36.0% Never married47.7% Now married1.9% Separated3.4% Widowed11.0% DivorcedFemales 31.1% Never married42.9% Now married3.2% Separated6.0% Widowed16.7% DivorcedWomen who gave birth in the past 12 months Now married:
57.5% (156)Unmarried:
42.5% (115)
Women who did not give birth in the past 12 months Now married:
42.5% (1,882)Unmarried:
57.5% (2,544)
Marital status - Black or African American population 15 years and over
Males 55.3% Never married29.6% Now married4.4% Separated3.6% Widowed7.0% DivorcedFemales 57.8% Never married20.6% Now married3.0% Separated6.1% Widowed12.5% DivorcedWomen who gave birth in the past 12 months Now married:
64.5% (45)Unmarried:
35.5% (25)
Women who did not give birth in the past 12 months Now married:
18.3% (246)Unmarried:
81.7% (1,098)
Marital status - American Indian / Alaska Native population 15 years and over
Males 0.0% Never married83.7% Now married0.0% Separated0.0% Widowed16.3% DivorcedFemales 18.3% Never married27.5% Now married9.2% Separated6.9% Widowed38.2% DivorcedWomen who did not give birth in the past 12 months Now married:
49.3% (52)Unmarried:
50.7% (54)
Marital status - Asian population 15 years and over
Males 51.1% Never married37.8% Now married1.7% Separated0.0% Widowed9.4% DivorcedFemales 16.1% Never married48.8% Now married1.6% Separated15.9% Widowed17.6% DivorcedWomen who gave birth in the past 12 months Now married:
50.0% (13)Unmarried:
50.0% (13)
Women who did not give birth in the past 12 months Now married:
48.5% (223)Unmarried:
51.5% (236)
Marital status - Native Hawaiian / Pacific Islander population 15 years and over
Males 72.7% Never married12.7% Now married0.0% Separated0.0% Widowed14.5% DivorcedFemales 78.8% Never married21.2% Now married0.0% Separated0.0% Widowed0.0% DivorcedWomen who gave birth in the past 12 months Now married:
100.0% (7)Unmarried:
0.0% (0)
Women who did not give birth in the past 12 months Now married:
0.0% (0)Unmarried:
100.0% (25)
Marital status - Other race population 15 years and over
Males 42.4% Never married52.0% Now married3.3% Separated0.0% Widowed2.3% DivorcedFemales 31.6% Never married54.5% Now married2.4% Separated1.4% Widowed10.1% DivorcedWomen who gave birth in the past 12 months Now married:
71.2% (57)Unmarried:
28.8% (23)
Women who did not give birth in the past 12 months Now married:
52.9% (285)Unmarried:
47.1% (253)
Marital status - Two or more races population 15 years and over
Males 37.3% Never married54.2% Now married0.0% Separated1.1% Widowed7.3% DivorcedFemales 42.8% Never married41.8% Now married5.6% Separated0.9% Widowed8.8% DivorcedWomen who gave birth in the past 12 months Now married:
33.3% (36)Unmarried:
66.7% (72)
Women who did not give birth in the past 12 months Now married:
47.7% (1,179)Unmarried:
52.3% (1,290)
Marital status - White alone, not Hispanic / Latino population 15 years and over
Males 31.9% Never married50.2% Now married2.4% Separated4.2% Widowed11.3% DivorcedFemales 29.2% Never married43.9% Now married2.4% Separated7.2% Widowed17.3% DivorcedWomen who gave birth in the past 12 months Now married:
78.9% (153)Unmarried:
21.1% (41)
Women who did not give birth in the past 12 months Now married:
42.4% (1,736)Unmarried:
57.6% (2,357)
Marital status - Hispanic or Latino population 15 years and over
Males 49.3% Never married40.0% Now married0.8% Separated0.7% Widowed9.1% DivorcedFemales 38.4% Never married40.5% Now married6.0% Separated1.5% Widowed13.6% DivorcedWomen who gave birth in the past 12 months Now married:
39.3% (86)Unmarried:
60.7% (133)
Women who did not give birth in the past 12 months Now married:
44.5% (1,011)Unmarried:
55.5% (1,259)
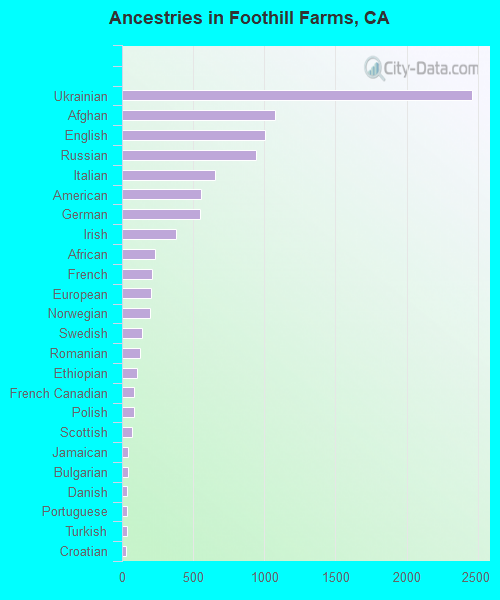
Ancestries in Foothill Farms
1,929 8.8% Ukrainian730 3.3% English722 3.3% American579 2.7% Afghan560 2.6% Russian463 2.1% German412 1.9% European323 1.5% Irish299 1.4% Italian218 1.0% African204 0.9% Eastern European198 0.9% Romanian162 0.7% Ethiopian127 0.6% Polish127 0.6% Norwegian91 0.4% Scottish89 0.4% Portuguese81 0.4% Iraqi56 0.3% Scotch-Irish56 0.3% Turkish50 0.2% Canadian43 0.2% Scandinavian43 0.2% Bulgarian39 0.2% Swedish35 0.2% French Canadian33 0.2% British33 0.2% French33 0.2% Greek21 0.10% Lithuanian21 0.10% Croatian21 0.10% Slavic19 0.09% Iranian15 0.07% South African14 0.06% Dutch13 0.06% Czech9 0.04% Armenian9 0.04% Jamaican8 0.04% Basque8 0.04% Welsh7 0.03% Syrian7 0.03% Danish6 0.03% Palestinian6 0.03% Arab5 0.02% Australian4 0.02% Slovak
Geographical mobility in Foothill Farms Same house 1 year ago 15,832 83.6% White (Caucasian)3,134 73.3% Black or African American254 64.9% American Indian / Alaska Native1,775 82.3% Asian157 95.1% Native Hawaiian / Pacific Islander1,899 90.1% Other race6,794 75.9% Two or more races14,262 82.1% White alone, not Hispanic / Latino7,280 85.9% Hispanic or LatinoMoved within same county 1,825 9.6% White / Caucasian461 10.8% Black or African American123 31.4% American Indian / Alaska Native268 12.4% Asian7 4.5% Native Hawaiian / Pacific Islander121 5.7% Other race812 9.1% Two or more races1,922 11.1% White alone, not Hispanic / Latino681 8.0% Hispanic or LatinoMoved within same state 899 4.7% White / Caucasian666 15.6% Black or African American8 1.9% American Indian / Alaska Native57 2.6% Asian54 2.6% Other race224 2.5% Two or more races725 4.2% White alone, not Hispanic / Latino328 3.9% Hispanic or LatinoMoved from different state 164 0.9% White / Caucasian85 2.0% Black or African American5 1.2% American Indian / Alaska Native227 2.5% Two or more races154 0.9% White alone, not Hispanic / Latino131 1.6% Hispanic or LatinoMoved from abroad 123 0.6% White16 0.4% Black or African American40 1.8% Asian419 4.7% Two or more races194 1.1% White alone, not Hispanic / Latino22 0.3% Hispanic or Latino
Children Nativity (place of birth) in Foothill Farms
Children under 6 years - Living with two parents Both parents native 733 100.0% NativeBoth parents foreign-born 592 88.3% Native78 11.7% Foreign-bornOne native, one foreign-born parent 154 100.0% NativeChildren under 6 years - Living with one parent Native parent 1,231 100.0% NativeForeign-born parent 176 50.0% Native176 50.0% Foreign-bornChildren 6 to 17 years - Living with two parents Both parents native 1,453 100.0% NativeBoth parents foreign-born 910 65.0% Native489 35.0% Foreign-bornOne native, one foreign-born parent 205 86.3% Native33 13.7% Foreign-bornChildren 6 to 17 years - Living with one parent Native parent 1,972 100.0% NativeForeign-born parent 501 59.9% Native336 40.1% Foreign-born
Grandparents responsible for own grandchildren in Foothill Farms
Grandparents (30 to 59 years) White / Caucasian 108 60.6% Responsible for grandchildren70 39.4% Not responsible for grandchildrenBlack or African American 8 100.0% Responsible for grandchildrenAmerican Indian / Alaska Native 10 100.0% Responsible for grandchildrenAsian 17 51.7% Responsible for grandchildren16 48.3% Not responsible for grandchildrenOther race 30 58.6% Responsible for grandchildren21 41.4% Not responsible for grandchildrenTwo or more races 34 100.0% Not responsible for grandchildrenWhite alone, not Hispanic / Latino 62 43.9% Responsible for grandchildren79 56.1% Not responsible for grandchildrenHispanic or Latino 129 73.0% Responsible for grandchildren48 27.0% Not responsible for grandchildrenGrandparents (60 years and over) White / Caucasian 19 7.9% Responsible for grandchildren226 92.1% Not responsible for grandchildrenBlack or African American 32 42.2% Responsible for grandchildren44 57.8% Not responsible for grandchildrenAsian 15 29.8% Responsible for grandchildren35 70.2% Not responsible for grandchildrenOther race 21 52.9% Responsible for grandchildren18 47.1% Not responsible for grandchildrenTwo or more races 66 100.0% Not responsible for grandchildrenWhite alone, not Hispanic / Latino 19 7.3% Responsible for grandchildren239 92.7% Not responsible for grandchildrenHispanic or Latino 22 16.0% Responsible for grandchildren117 84.0% Not responsible for grandchildren