Races in Fort Dix, New Jersey (NJ) Detailed Stats
Data:
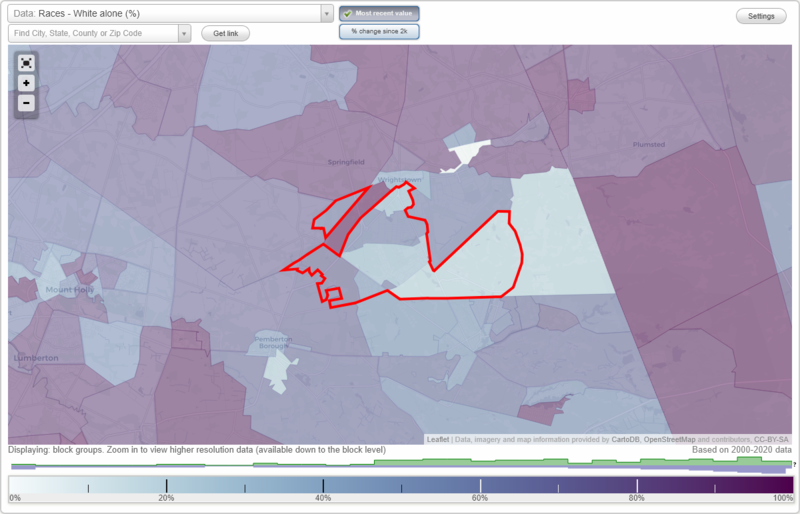
Races - White alone (%)
Races - White alone (% change since 2000)
Races - Black alone (%)
Races - Black alone (% change since 2000)
Races - American Indian alone (%)
Races - American Indian alone (% change since 2000)
Races - Asian alone (%)
Races - Asian alone (% change since 2000)
Races - Hispanic (%)
Races - Hispanic (% change since 2000)
Races - Native Hawaiian and Other Pacific Islander alone (%)
Races - Native Hawaiian and Other Pacific Islander alone (% change since 2000)
Races - Two or more races(%)
Races - Two or more races(% change since 2000)
Races - Other race alone (%)
Races - Other race alone (% change since 2000)
Racial diversity
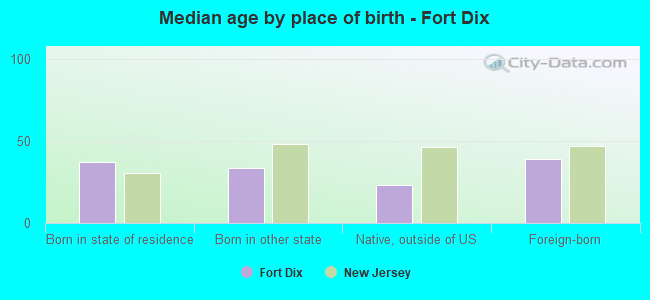
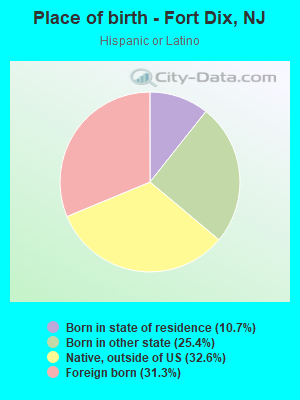
Place of birth - Born in state of residence (%)
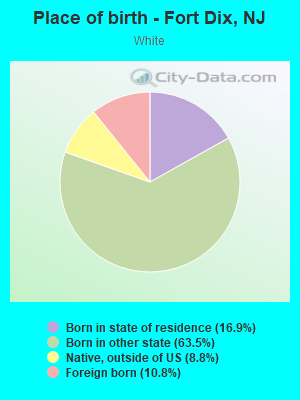
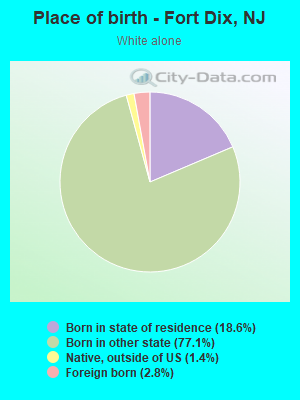
Place of birth - Born in state of residence (%) - White
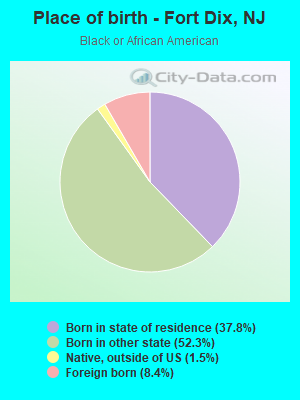
Place of birth - Born in state of residence (%) - Black or African American
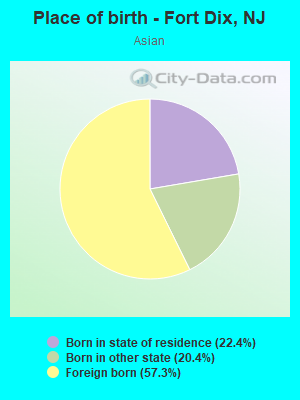
Place of birth - Born in state of residence (%) - Asian
Place of birth - Born in state of residence (%) - Hispanic or Latino
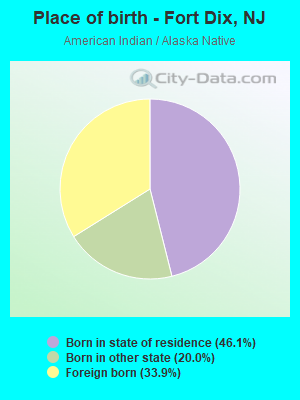
Place of birth - Born in state of residence (%) - American Indian and Alaska Native
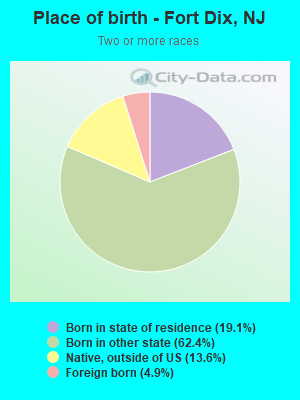
Place of birth - Born in state of residence (%) - Multirace
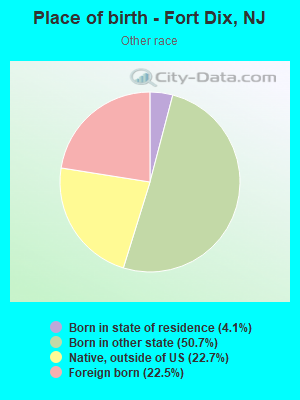
Place of birth - Born in state of residence (%) - Other Race
Place of birth - Born in other state (%)
Place of birth - Born in other state (%) - White
Place of birth - Born in other state (%) - Black or African American
Place of birth - Born in other state (%) - Asian
Place of birth - Born in other state (%) - Hispanic or Latino
Place of birth - Born in other state (%) - American Indian and Alaska Native
Place of birth - Born in other state (%) - Multirace
Place of birth - Born in other state (%) - Other Race
Place of birth - Native, outside of US (%)
Place of birth - Native, outside of US (%) - White
Place of birth - Native, outside of US (%) - Black or African American
Place of birth - Native, outside of US (%) - Asian
Place of birth - Native, outside of US (%) - Hispanic or Latino
Place of birth - Native, outside of US (%) - American Indian and Alaska Native
Place of birth - Native, outside of US (%) - Multirace
Place of birth - Native, outside of US (%) - Other Race
Place of birth - Foreign born (%)
Place of birth - Foreign born (%) - White
Place of birth - Foreign born (%) - Black or African American
Place of birth - Foreign born (%) - Asian
Place of birth - Foreign born (%) - Hispanic or Latino
Place of birth - Foreign born (%) - American Indian and Alaska Native
Place of birth - Foreign born (%) - Multirace
Place of birth - Foreign born (%) - Other Race
Residents speaking English at home (%)
Residents speaking English at home - Born in the United States (%)
Residents speaking English at home - Native, born elsewhere (%)
Residents speaking English at home - Foreign born (%)
Residents speaking Spanish at home (%)
Residents speaking Spanish at home - Born in the United States (%)
Residents speaking Spanish at home - Native, born elsewhere (%)
Residents speaking Spanish at home - Foreign born (%)
Residents speaking other language at home (%)
Residents speaking other language at home - Born in the United States (%)
Residents speaking other language at home - Native, born elsewhere (%)
Residents speaking other language at home - Foreign born (%)
Marital status - Never married (%)
Marital status - Now married (%)
Marital status - Separated (%)
Marital status - Widowed (%)
Marital status - Divorced (%)
Ancestries Reported - Arab (%)
Ancestries Reported - Czech (%)
Ancestries Reported - Danish (%)
Ancestries Reported - Dutch (%)
Ancestries Reported - English (%)
Ancestries Reported - French (%)
Ancestries Reported - French Canadian (%)
Ancestries Reported - German (%)
Ancestries Reported - Greek (%)
Ancestries Reported - Hungarian (%)
Ancestries Reported - Irish (%)
Ancestries Reported - Italian (%)
Ancestries Reported - Lithuanian (%)
Ancestries Reported - Norwegian (%)
Ancestries Reported - Polish (%)
Ancestries Reported - Portuguese (%)
Ancestries Reported - Russian (%)
Ancestries Reported - Scotch-Irish (%)
Ancestries Reported - Scottish (%)
Ancestries Reported - Slovak (%)
Ancestries Reported - Subsaharan African (%)
Ancestries Reported - Swedish (%)
Ancestries Reported - Swiss (%)
Ancestries Reported - Ukrainian (%)
Ancestries Reported - United States (%)
Ancestries Reported - Welsh (%)
Ancestries Reported - West Indian (%)
Ancestries Reported - Other (%)
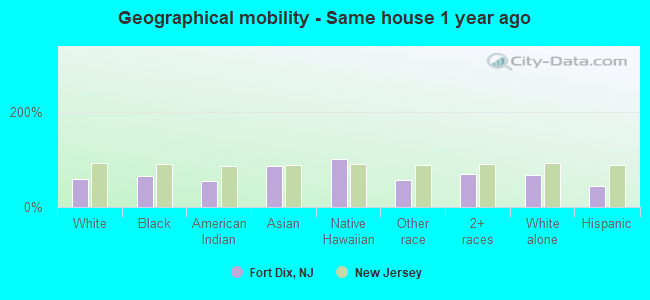
Geographical mobility - Same house 1 year ago (%)
Geographical mobility - Same house 1 year ago (%) - White
Geographical mobility - Same house 1 year ago (%) - Black or African American
Geographical mobility - Same house 1 year ago (%) - Asian
Geographical mobility - Same house 1 year ago (%) - Hispanic or Latino
Geographical mobility - Same house 1 year ago (%) - American Indian and Alaska Native
Geographical mobility - Same house 1 year ago (%) - Multirace
Geographical mobility - Same house 1 year ago (%) - Other Race
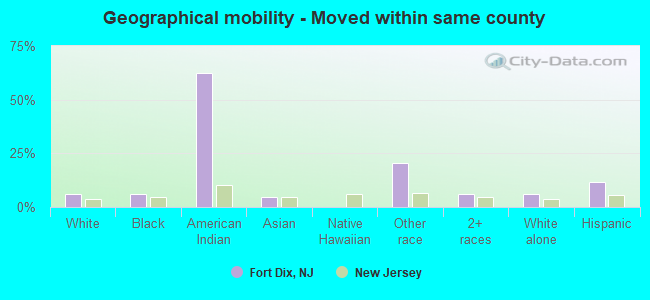
Geographical mobility - Moved within same county (%)
Geographical mobility - Moved within same county (%) - White
Geographical mobility - Moved within same county (%) - Black or African American
Geographical mobility - Moved within same county (%) - Asian
Geographical mobility - Moved within same county (%) - Hispanic or Latino
Geographical mobility - Moved within same county (%) - American Indian and Alaska Native
Geographical mobility - Moved within same county (%) - Multirace
Geographical mobility - Moved within same county (%) - Other Race
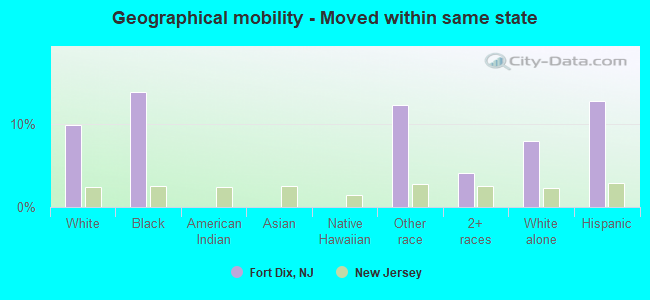
Geographical mobility - Moved from different county within same state (%)
Geographical mobility - Moved from different county within same state (%) - White
Geographical mobility - Moved from different county within same state (%) - Black or African American
Geographical mobility - Moved from different county within same state (%) - Asian
Geographical mobility - Moved from different county within same state (%) - Hispanic or Latino
Geographical mobility - Moved from different county within same state (%) - American Indian and Alaska Native
Geographical mobility - Moved from different county within same state (%) - Multirace
Geographical mobility - Moved from different county within same state (%) - Other Race
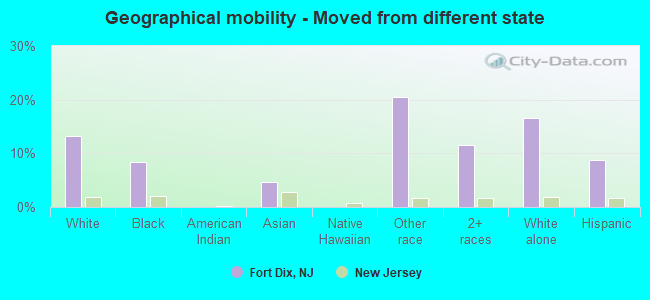
Geographical mobility - Moved from different state (%)
Geographical mobility - Moved from different state (%) - White
Geographical mobility - Moved from different state (%) - Black or African American
Geographical mobility - Moved from different state (%) - Asian
Geographical mobility - Moved from different state (%) - Hispanic or Latino
Geographical mobility - Moved from different state (%) - American Indian and Alaska Native
Geographical mobility - Moved from different state (%) - Multirace
Geographical mobility - Moved from different state (%) - Other Race
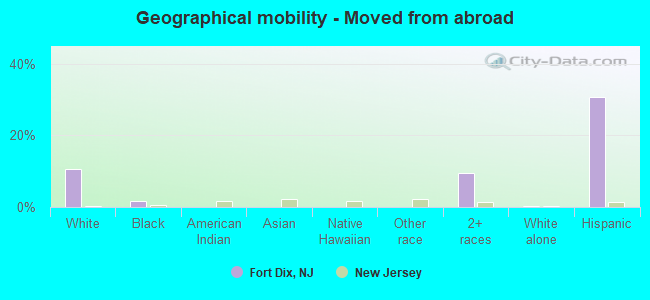
Geographical mobility - Moved from abroad (%)
Geographical mobility - Moved from abroad (%) - White
Geographical mobility - Moved from abroad (%) - Black or African American
Geographical mobility - Moved from abroad (%) - Asian
Geographical mobility - Moved from abroad (%) - Hispanic or Latino
Geographical mobility - Moved from abroad (%) - American Indian and Alaska Native
Geographical mobility - Moved from abroad (%) - Multirace
Geographical mobility - Moved from abroad (%) - Other Race
Place of birth for the foreign-born population - Ireland (%)
Place of birth for the foreign-born population - Denmark (%)
Place of birth for the foreign-born population - Norway (%)
Place of birth for the foreign-born population - Sweden (%)
Place of birth for the foreign-born population - United Kingdom (%)
Place of birth for the foreign-born population - England (%)
Place of birth for the foreign-born population - Scotland (%)
Place of birth for the foreign-born population - Other Northern Europe (%)
Place of birth for the foreign-born population - Austria (%)
Place of birth for the foreign-born population - Belgium (%)
Place of birth for the foreign-born population - France (%)
Place of birth for the foreign-born population - Germany (%)
Place of birth for the foreign-born population - Netherlands (%)
Place of birth for the foreign-born population - Switzerland (%)
Place of birth for the foreign-born population - Other Western Europe (%)
Place of birth for the foreign-born population - Greece (%)
Place of birth for the foreign-born population - Italy (%)
Place of birth for the foreign-born population - Portugal (%)
Place of birth for the foreign-born population - Spain (%)
Place of birth for the foreign-born population - Other Southern Europe (%)
Place of birth for the foreign-born population - Albania (%)
Place of birth for the foreign-born population - Belarus (%)
Place of birth for the foreign-born population - Bosnia and Herzegovina (%)
Place of birth for the foreign-born population - Bulgaria (%)
Place of birth for the foreign-born population - Croatia (%)
Place of birth for the foreign-born population - Czechoslovakia (%)
Place of birth for the foreign-born population - Hungary (%)
Place of birth for the foreign-born population - Latvia (%)
Place of birth for the foreign-born population - Lithuania (%)
Place of birth for the foreign-born population - North Macedonia (Macedonia) (%)
Place of birth for the foreign-born population - Moldova (%)
Place of birth for the foreign-born population - Poland (%)
Place of birth for the foreign-born population - Romania (%)
Place of birth for the foreign-born population - Russia (%)
Place of birth for the foreign-born population - Serbia (%)
Place of birth for the foreign-born population - Ukraine (%)
Place of birth for the foreign-born population - Other Eastern Europe (%)
Place of birth for the foreign-born population - China (%)
Place of birth for the foreign-born population - Hong Kong (%)
Place of birth for the foreign-born population - Taiwan (%)
Place of birth for the foreign-born population - Japan (%)
Place of birth for the foreign-born population - Korea (%)
Place of birth for the foreign-born population - Other Eastern Asia (%)
Place of birth for the foreign-born population - Afghanistan (%)
Place of birth for the foreign-born population - Bangladesh (%)
Place of birth for the foreign-born population - India (%)
Place of birth for the foreign-born population - Iran (%)
Place of birth for the foreign-born population - Kazakhstan (%)
Place of birth for the foreign-born population - Nepal (%)
Place of birth for the foreign-born population - Pakistan (%)
Place of birth for the foreign-born population - Sri Lanka (%)
Place of birth for the foreign-born population - Uzbekistan (%)
Place of birth for the foreign-born population - Other South Central Asia (%)
Place of birth for the foreign-born population - Burma (%)
Place of birth for the foreign-born population - Cambodia (%)
Place of birth for the foreign-born population - Indonesia (%)
Place of birth for the foreign-born population - Laos (%)
Place of birth for the foreign-born population - Malaysia (%)
Place of birth for the foreign-born population - Philippines (%)
Place of birth for the foreign-born population - Singapore (%)
Place of birth for the foreign-born population - Thailand (%)
Place of birth for the foreign-born population - Vietnam (%)
Place of birth for the foreign-born population - Other South Eastern Asia (%)
Place of birth for the foreign-born population - Armenia (%)
Place of birth for the foreign-born population - Iraq (%)
Place of birth for the foreign-born population - Israel (%)
Place of birth for the foreign-born population - Jordan (%)
Place of birth for the foreign-born population - Kuwait (%)
Place of birth for the foreign-born population - Lebanon (%)
Place of birth for the foreign-born population - Saudi Arabia (%)
Place of birth for the foreign-born population - Syria (%)
Place of birth for the foreign-born population - Turkey (%)
Place of birth for the foreign-born population - Yemen (%)
Place of birth for the foreign-born population - Other Western Asia (%)
Place of birth for the foreign-born population - Eritrea (%)
Place of birth for the foreign-born population - Ethiopia (%)
Place of birth for the foreign-born population - Kenya (%)
Place of birth for the foreign-born population - Somalia (%)
Place of birth for the foreign-born population - Uganda (%)
Place of birth for the foreign-born population - Zimbabwe (%)
Place of birth for the foreign-born population - Other Eastern Africa (%)
Place of birth for the foreign-born population - Cameroon (%)
Place of birth for the foreign-born population - Congo (%)
Place of birth for the foreign-born population - Democratic Republic of Congo (Zaire) (%)
Place of birth for the foreign-born population - Other Middle Africa (%)
Place of birth for the foreign-born population - Egypt (%)
Place of birth for the foreign-born population - Morocco (%)
Place of birth for the foreign-born population - Sudan (%)
Place of birth for the foreign-born population - Other Northern Africa (%)
Place of birth for the foreign-born population - South Africa (%)
Place of birth for the foreign-born population - Other Southern Africa (%)
Place of birth for the foreign-born population - Cabo Verde (%)
Place of birth for the foreign-born population - Ghana (%)
Place of birth for the foreign-born population - Liberia (%)
Place of birth for the foreign-born population - Nigeria (%)
Place of birth for the foreign-born population - Senegal (%)
Place of birth for the foreign-born population - Sierra Leone (%)
Place of birth for the foreign-born population - Other Western Africa (%)
Place of birth for the foreign-born population - Australia (%)
Place of birth for the foreign-born population - New Zealand (%)
Place of birth for the foreign-born population - Fiji (%)
Place of birth for the foreign-born population - Micronesia (%)
Place of birth for the foreign-born population - Bahamas (%)
Place of birth for the foreign-born population - Barbados (%)
Place of birth for the foreign-born population - Cuba (%)
Place of birth for the foreign-born population - Dominica (%)
Place of birth for the foreign-born population - Dominican Republic (%)
Place of birth for the foreign-born population - Grenada (%)
Place of birth for the foreign-born population - Haiti (%)
Place of birth for the foreign-born population - Jamaica (%)
Place of birth for the foreign-born population - St. Vincent and the Grenadines (%)
Place of birth for the foreign-born population - Trinidad and Tobago (%)
Place of birth for the foreign-born population - West Indies (%)
Place of birth for the foreign-born population - Other Caribbean (%)
Place of birth for the foreign-born population - Belize (%)
Place of birth for the foreign-born population - Costa Rica (%)
Place of birth for the foreign-born population - El Salvador (%)
Place of birth for the foreign-born population - Guatemala (%)
Place of birth for the foreign-born population - Honduras (%)
Place of birth for the foreign-born population - Mexico (%)
Place of birth for the foreign-born population - Nicaragua (%)
Place of birth for the foreign-born population - Panama (%)
Place of birth for the foreign-born population - Other Central America (%)
Place of birth for the foreign-born population - Argentina (%)
Place of birth for the foreign-born population - Bolivia (%)
Place of birth for the foreign-born population - Brazil (%)
Place of birth for the foreign-born population - Chile (%)
Place of birth for the foreign-born population - Colombia (%)
Place of birth for the foreign-born population - Ecuador (%)
Place of birth for the foreign-born population - Guyana (%)
Place of birth for the foreign-born population - Peru (%)
Place of birth for the foreign-born population - Uruguay (%)
Place of birth for the foreign-born population - Venezuela (%)
Place of birth for the foreign-born population - Other South America (%)
Place of birth for the foreign-born population - Canada (%)
Place of birth for the foreign-born population - Other Northern America (%)
Place of birth for the foreign-born population - Other (%)
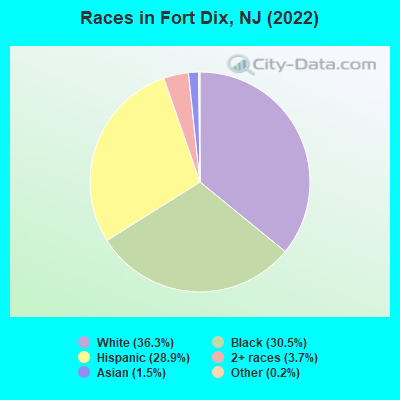
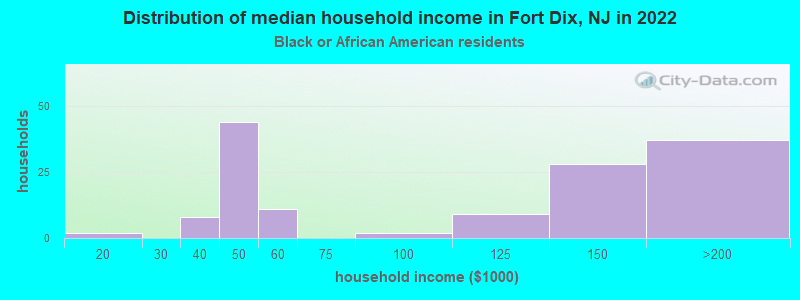
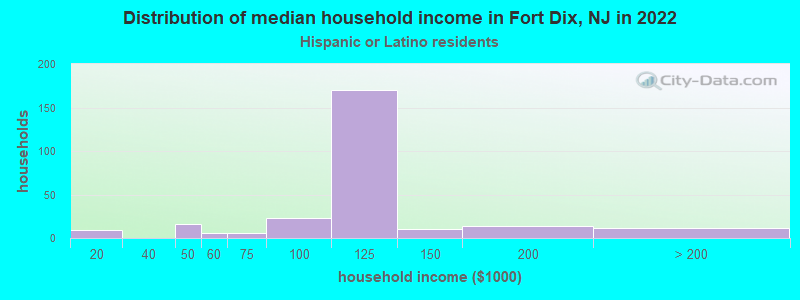
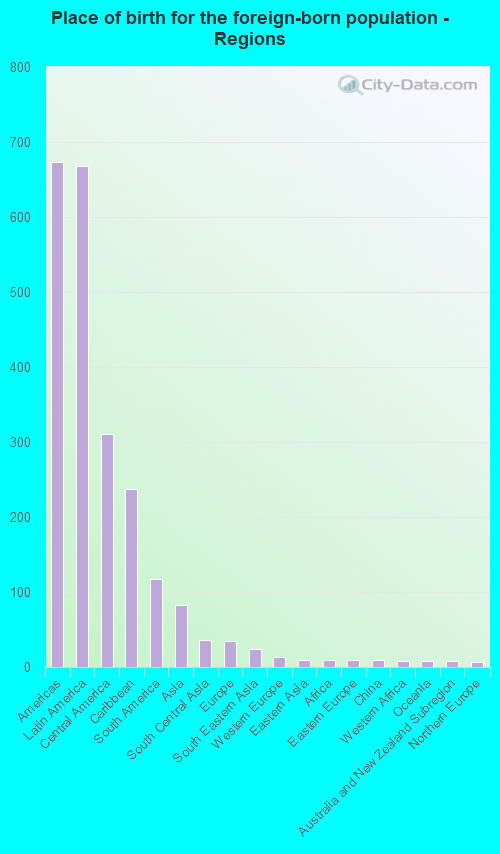
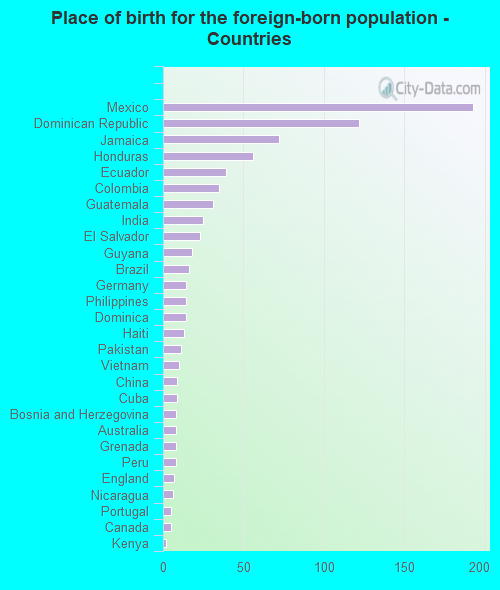
According to 2022 data, the most numerous races in Fort Dix, NJ are White alone (2,847 residents), Hispanic (2,266 residents), and Black alone (2,398 residents). 75.0% of Fort Dix residents speak English at home. 10.3% of Fort Dix, NJ residents are foreign-born (8.5% born in Latin America, 1.0% born in Asia), which is 122.7% less than the foreign-born rate of 23.0% across the entire state of New Jersey.
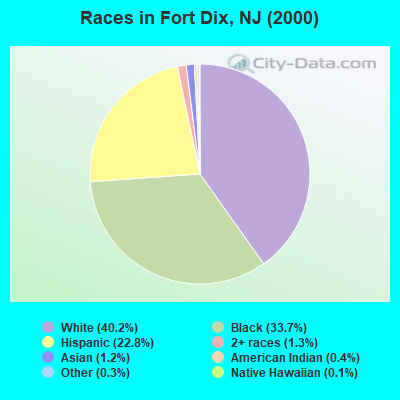
Race distribution in Fort Dix
2000 2022
5,557,209 66.0% White alone 1,117,191 13.3% Hispanic 1,096,171 13.0% Black alone 477,012 5.7% Asian alone 133,689 1.6% Two or more races 19,565 0.2% Other race alone 11,338 0.1% American Indian alone 2,175 0.03% Native Hawaiian and Other
4,766,476 51.5% White alone 2,028,470 21.9% Hispanic 1,111,632 12.0% Black alone 923,546 10.0% Asian alone 332,237 3.6% Two or more races 89,847 1.0% Other race alone 8,557 0.09% American Indian alone 934 0.01% Native Hawaiian and Other
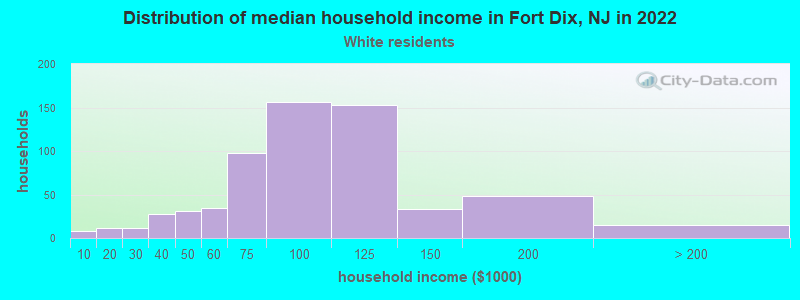
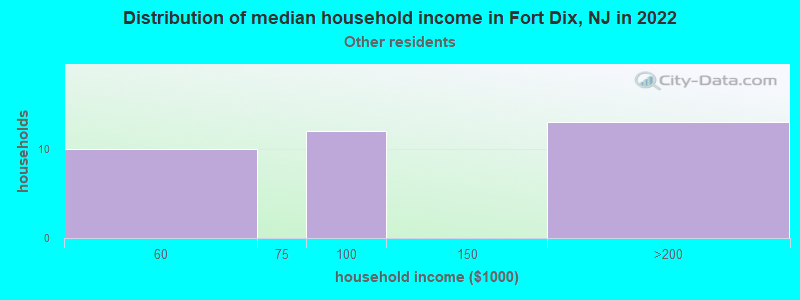
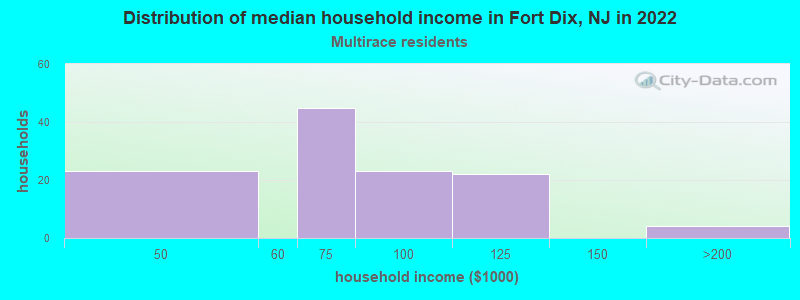
Income and house value in Fort Dix Median household income in 2022 $77,444 White non-Hispanic householders$59,901 Two or more races householders$126,925 Hispanic or Latino race householdersMedian 2022 house value $-725,221,811 White Non-Hispanic householders$-636,816,673 Black or African American householders
Median age by race in Fort Dix
34.7 Median age for White residents36.4 22.4 38.2 Median age for Black or African American residents37.2 27.4 27.7 Median age for American Indian / Alaska Native residents27.5 -688,298,917.7 36.3 Median age for Asian residents35.2 23.3 -866,479,924.4 Median age for Native Hawaiian / Pacific Islander residents-866,479,924.4 -713,070,378.3 34.4 Median age for Other race residents36.0 29.3 27.9 Median age for Two or more races residents28.4 25.2 34.3 Median age for White alone residents36.8 23.3 34.5 Median age for Hispanic or Latino residents35.9 28.1
Owner/renter occupied households by race in Fort Dix
House owners and renters - White residents 2 0.3% Owner occupied638 99.7% Renter occupiedHouse owners and renters - Black or African American residents 117 100.0% Renter occupiedHouse owners and renters - Asian residents 2 100.0% Renter occupiedHouse owners and renters - Other race residents 19 100.0% Renter occupiedHouse owners and renters - Two or more races residents 125 100.0% Renter occupiedHouse owners and renters - White alone residents 2 0.4% Owner occupied491 99.6% Renter occupiedHouse owners and renters - Hispanic or Latino residents 216 100.0% Renter occupied
Language usage in Fort Dix
English speakers - Total 75.0% of residents of Fort Dix speak English at home.
23.2% of residents speak Spanish at home 681 38.7% Speak English very well1,078 61.3% Speak English less than very well2.7% of residents speak other language at home 166 80.6% Speak English very well40 19.4% Speak English less than very well
English speakers - Born in the United States 91.9% of residents of Fort Dix speak English at home.
8.3% of residents speak Spanish at home 272 80.7% Speak English very well65 19.3% Speak English less than very well0.5% of residents speak other language at home 18 90.0% Speak English very well2 10.0% Speak English less than very well
English speakers - Native, born elsewhere 14.6% of residents of Fort Dix speak English at home.
66.1% of residents speak Spanish at home 120 23.9% Speak English very well383 76.1% Speak English less than very well1.2% of residents speak other language at home 9 100.0% Speak English very well
English speakers - Foreign-born 27.9% of residents of Fort Dix speak English at home.
63.8% of residents speak Spanish at home 172 29.6% Speak English very well409 70.4% Speak English less than very well15.6% of residents speak other language at home 115 81.0% Speak English very well27 19.0% Speak English less than very well
White (Caucasian) - Speak only English Native:
75.7% (2,748)Foreign-born:
19.2% (80)
White (Caucasian) - Speak another language Native:
16.0% (582)Foreign-born:
81.9% (341)
Black or African American - Speak only English Native:
95.7% (2,196)Foreign-born:
59.8% (125)
Black or African American - Speak another language Native:
3.7% (85)Foreign-born:
40.1% (84)
American Indian / Alaska Native - Speak another language Native:
83.6% (24)Foreign-born:
97.6% (14)
Asian - Speak only English Native:
80.4% (40)Foreign-born:
24.1% (16)
Asian - Speak another language Native:
24.9% (12)Foreign-born:
77.3% (51)
Other race - Speak another language Native:
53.7% (106)Foreign-born:
100.0% (64)
Two or more races - Speak another language Native:
28.1% (115)Foreign-born:
100.0% (26)
White alone - Speak only English Native:
99.2% (2,594)Foreign-born:
39.6% (32)
White alone - Speak another language Native:
1.0% (26)Foreign-born:
59.6% (48)
Hispanic or Latino - Speak only English Native:
26.6% (411)Foreign-born:
27.5% (192)
Hispanic or Latino - Speak another language Native:
72.4% (1,116)Foreign-born:
75.0% (523)
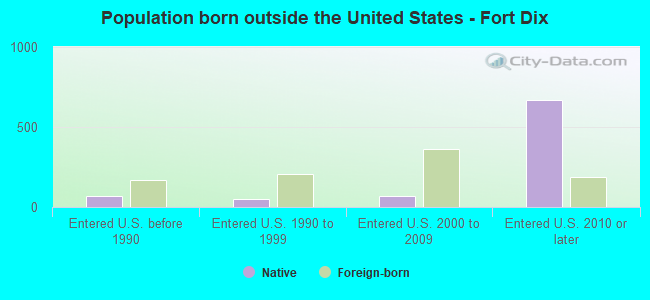
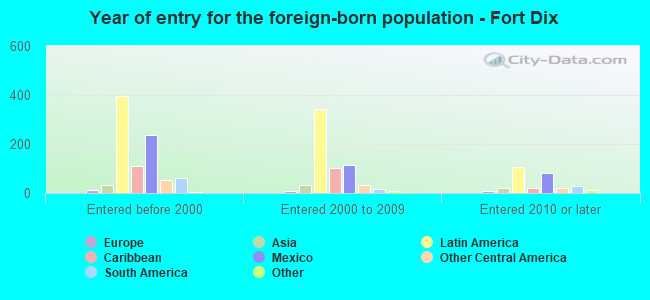
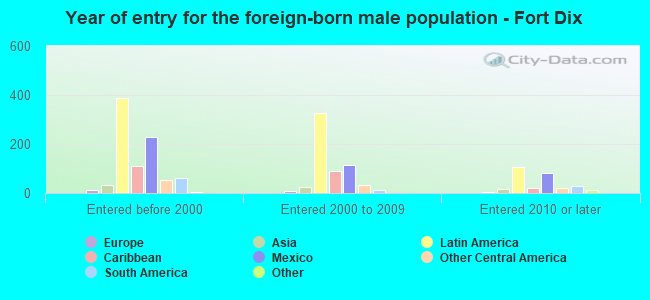
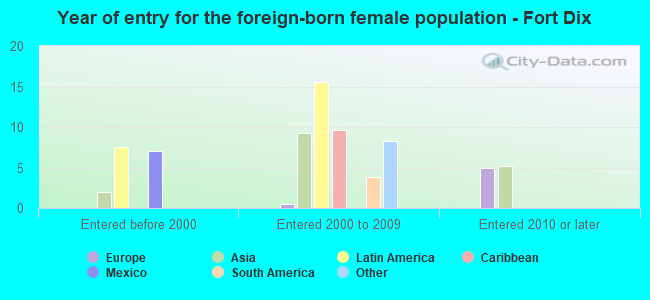
Foreign-born residents in Fort Dix 811 residents are foreign born (8.5% Latin America , 1.0% Asia ).
This city:
10.3%New Jersey:
23.2%
Marital status for residents in Fort Dix Marital status - White (Caucasian) population 15 years and over
Males 53.6% Never married31.5% Now married4.1% Separated0.6% Widowed10.3% DivorcedFemales 16.4% Never married77.5% Now married0.5% Separated0.5% Widowed5.0% DivorcedWomen who gave birth in the past 12 months Now married:
100.0% (26)Unmarried:
0.0% (0)
Women who did not give birth in the past 12 months Now married:
78.4% (389)Unmarried:
21.6% (107)
Marital status - Black or African American population 15 years and over
Males 73.0% Never married14.4% Now married8.3% Separated0.0% Widowed4.3% DivorcedFemales 14.8% Never married85.2% Now married0.0% Separated0.0% Widowed0.0% DivorcedWomen who gave birth in the past 12 months Now married:
100.0% (10)Unmarried:
0.0% (0)
Women who did not give birth in the past 12 months Now married:
83.7% (83)Unmarried:
16.3% (16)
Marital status - Asian population 15 years and over
Males 86.0% Never married2.3% Now married0.0% Separated0.0% Widowed11.6% DivorcedFemales 42.9% Never married57.1% Now married0.0% Separated0.0% Widowed0.0% DivorcedWomen who did not give birth in the past 12 months Now married:
57.1% (9)Unmarried:
42.9% (6)
Marital status - Other race population 15 years and over
Males 78.2% Never married14.8% Now married0.0% Separated0.0% Widowed7.0% DivorcedFemales 31.5% Never married55.6% Now married13.0% Separated0.0% Widowed0.0% DivorcedWomen who did not give birth in the past 12 months Now married:
68.5% (47)Unmarried:
31.5% (21)
Marital status - Two or more races population 15 years and over
Males 56.2% Never married26.8% Now married6.2% Separated0.0% Widowed10.8% DivorcedFemales 20.3% Never married77.2% Now married0.0% Separated0.0% Widowed2.5% DivorcedWomen who did not give birth in the past 12 months Now married:
79.2% (81)Unmarried:
20.8% (21)
Marital status - White alone, not Hispanic / Latino population 15 years and over
Males 52.8% Never married31.1% Now married1.7% Separated0.8% Widowed13.5% DivorcedFemales 20.1% Never married74.3% Now married0.6% Separated0.6% Widowed4.3% DivorcedWomen who gave birth in the past 12 months Now married:
100.0% (26)Unmarried:
0.0% (0)
Women who did not give birth in the past 12 months Now married:
73.5% (298)Unmarried:
26.5% (107)
Marital status - Hispanic or Latino population 15 years and over
Males 59.7% Never married28.1% Now married8.4% Separated0.0% Widowed3.7% DivorcedFemales 12.1% Never married80.2% Now married3.4% Separated0.0% Widowed4.3% DivorcedWomen who gave birth in the past 12 months Now married:
100.0% (2)Unmarried:
0.0% (0)
Women who did not give birth in the past 12 months Now married:
87.2% (194)Unmarried:
12.8% (28)
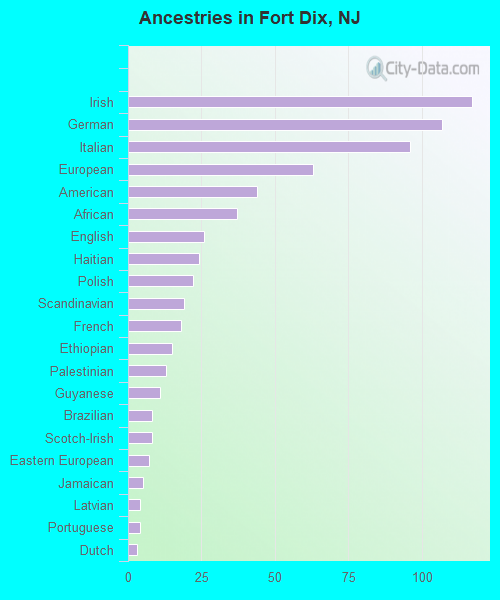
Ancestries in Fort Dix
117 3.8% Irish107 3.5% German96 3.1% Italian63 2.1% European44 1.4% American37 1.2% African26 0.8% English24 0.8% Haitian22 0.7% Polish19 0.6% Scandinavian18 0.6% French15 0.5% Ethiopian13 0.4% Palestinian11 0.4% Guyanese8 0.3% Brazilian8 0.3% Scotch-Irish7 0.2% Eastern European5 0.2% Jamaican4 0.1% Latvian4 0.1% Portuguese3 0.10% Dutch1 0.03% French Canadian1 0.03% Norwegian1 0.03% Scottish1 0.03% Kenyan1 0.03% Trinidadian and Tobagonian
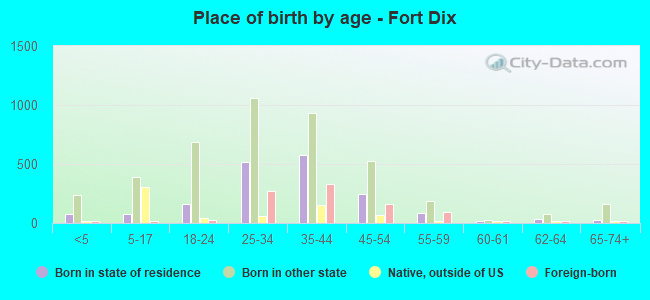
Children Nativity (place of birth) in Fort Dix
Children under 6 years - Living with two parents Both parents native 257 100.0% NativeBoth parents foreign-born 2 100.0% NativeOne native, one foreign-born parent 33 100.0% NativeChildren under 6 years - Living with one parent Native parent 40 100.0% NativeChildren 6 to 17 years - Living with two parents Both parents native 733 100.0% Native0 0.0% Foreign-bornBoth parents foreign-born 3 100.0% Foreign-bornOne native, one foreign-born parent 54 100.0% NativeChildren 6 to 17 years - Living with one parent Native parent 22 100.0% NativeForeign-born parent 8 52.6% Native7 47.4% Foreign-born