Races in Franklin, Wisconsin (WI) Detailed Stats
Data:
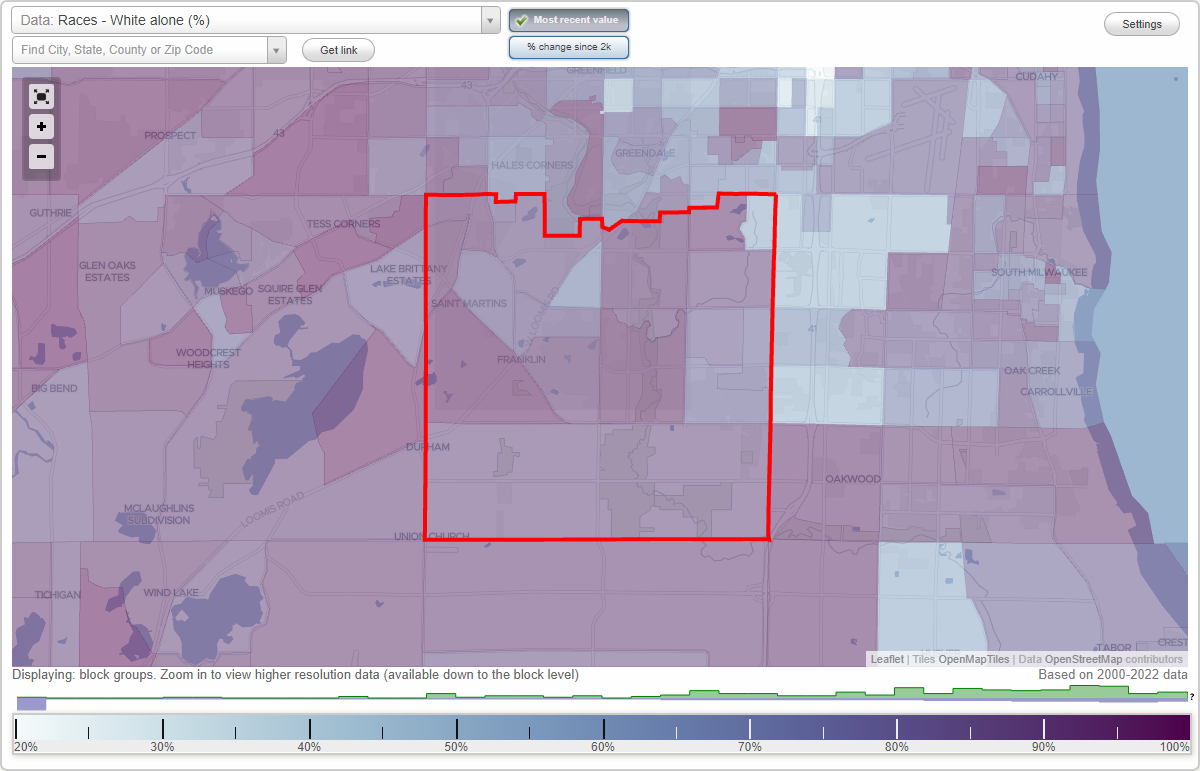
Races - White alone (%)
Races - White alone (% change since 2000)
Races - Black alone (%)
Races - Black alone (% change since 2000)
Races - American Indian alone (%)
Races - American Indian alone (% change since 2000)
Races - Asian alone (%)
Races - Asian alone (% change since 2000)
Races - Hispanic (%)
Races - Hispanic (% change since 2000)
Races - Native Hawaiian and Other Pacific Islander alone (%)
Races - Native Hawaiian and Other Pacific Islander alone (% change since 2000)
Races - Two or more races(%)
Races - Two or more races(% change since 2000)
Races - Other race alone (%)
Races - Other race alone (% change since 2000)
Racial diversity
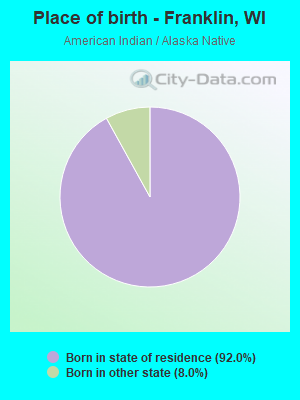
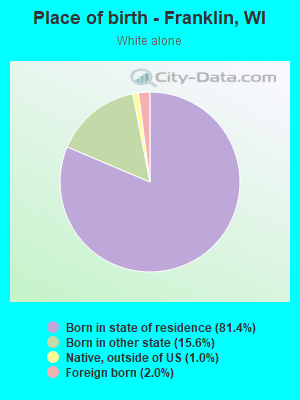
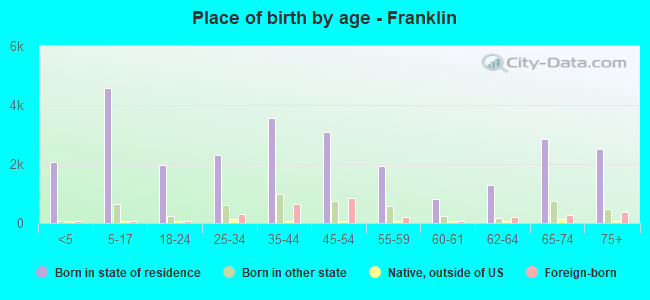
Place of birth - Born in state of residence (%)
Place of birth - Born in state of residence (%) - White
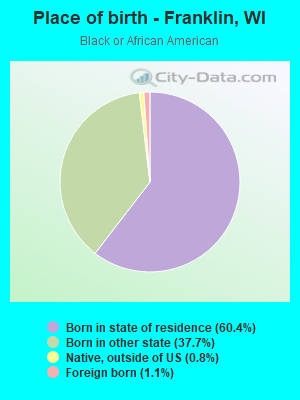
Place of birth - Born in state of residence (%) - Black or African American
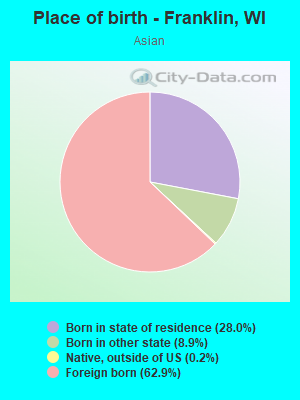
Place of birth - Born in state of residence (%) - Asian
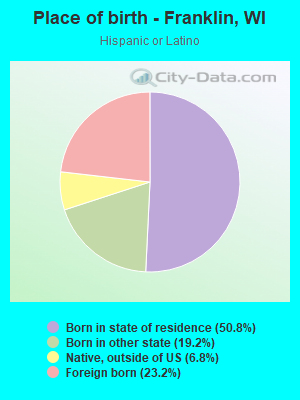
Place of birth - Born in state of residence (%) - Hispanic or Latino
Place of birth - Born in state of residence (%) - American Indian and Alaska Native
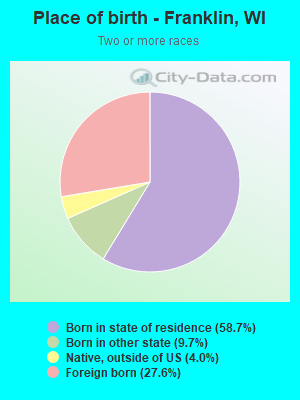
Place of birth - Born in state of residence (%) - Multirace
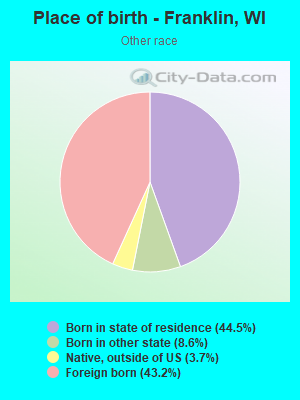
Place of birth - Born in state of residence (%) - Other Race
Place of birth - Born in other state (%)
Place of birth - Born in other state (%) - White
Place of birth - Born in other state (%) - Black or African American
Place of birth - Born in other state (%) - Asian
Place of birth - Born in other state (%) - Hispanic or Latino
Place of birth - Born in other state (%) - American Indian and Alaska Native
Place of birth - Born in other state (%) - Multirace
Place of birth - Born in other state (%) - Other Race
Place of birth - Native, outside of US (%)
Place of birth - Native, outside of US (%) - White
Place of birth - Native, outside of US (%) - Black or African American
Place of birth - Native, outside of US (%) - Asian
Place of birth - Native, outside of US (%) - Hispanic or Latino
Place of birth - Native, outside of US (%) - American Indian and Alaska Native
Place of birth - Native, outside of US (%) - Multirace
Place of birth - Native, outside of US (%) - Other Race
Place of birth - Foreign born (%)
Place of birth - Foreign born (%) - White
Place of birth - Foreign born (%) - Black or African American
Place of birth - Foreign born (%) - Asian
Place of birth - Foreign born (%) - Hispanic or Latino
Place of birth - Foreign born (%) - American Indian and Alaska Native
Place of birth - Foreign born (%) - Multirace
Place of birth - Foreign born (%) - Other Race
Residents speaking English at home (%)
Residents speaking English at home - Born in the United States (%)
Residents speaking English at home - Native, born elsewhere (%)
Residents speaking English at home - Foreign born (%)
Residents speaking Spanish at home (%)
Residents speaking Spanish at home - Born in the United States (%)
Residents speaking Spanish at home - Native, born elsewhere (%)
Residents speaking Spanish at home - Foreign born (%)
Residents speaking other language at home (%)
Residents speaking other language at home - Born in the United States (%)
Residents speaking other language at home - Native, born elsewhere (%)
Residents speaking other language at home - Foreign born (%)
Marital status - Never married (%)
Marital status - Now married (%)
Marital status - Separated (%)
Marital status - Widowed (%)
Marital status - Divorced (%)
Ancestries Reported - Arab (%)
Ancestries Reported - Czech (%)
Ancestries Reported - Danish (%)
Ancestries Reported - Dutch (%)
Ancestries Reported - English (%)
Ancestries Reported - French (%)
Ancestries Reported - French Canadian (%)
Ancestries Reported - German (%)
Ancestries Reported - Greek (%)
Ancestries Reported - Hungarian (%)
Ancestries Reported - Irish (%)
Ancestries Reported - Italian (%)
Ancestries Reported - Lithuanian (%)
Ancestries Reported - Norwegian (%)
Ancestries Reported - Polish (%)
Ancestries Reported - Portuguese (%)
Ancestries Reported - Russian (%)
Ancestries Reported - Scotch-Irish (%)
Ancestries Reported - Scottish (%)
Ancestries Reported - Slovak (%)
Ancestries Reported - Subsaharan African (%)
Ancestries Reported - Swedish (%)
Ancestries Reported - Swiss (%)
Ancestries Reported - Ukrainian (%)
Ancestries Reported - United States (%)
Ancestries Reported - Welsh (%)
Ancestries Reported - West Indian (%)
Ancestries Reported - Other (%)
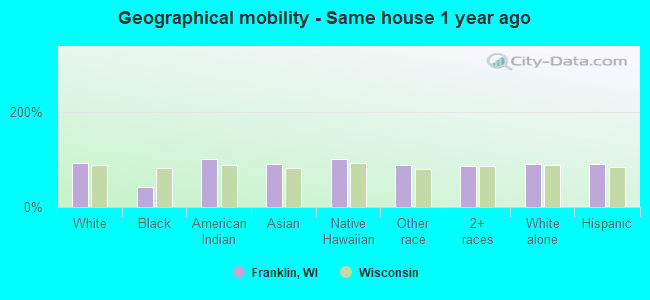
Geographical mobility - Same house 1 year ago (%)
Geographical mobility - Same house 1 year ago (%) - White
Geographical mobility - Same house 1 year ago (%) - Black or African American
Geographical mobility - Same house 1 year ago (%) - Asian
Geographical mobility - Same house 1 year ago (%) - Hispanic or Latino
Geographical mobility - Same house 1 year ago (%) - American Indian and Alaska Native
Geographical mobility - Same house 1 year ago (%) - Multirace
Geographical mobility - Same house 1 year ago (%) - Other Race
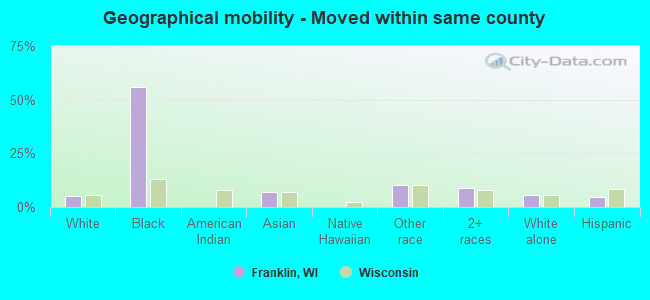
Geographical mobility - Moved within same county (%)
Geographical mobility - Moved within same county (%) - White
Geographical mobility - Moved within same county (%) - Black or African American
Geographical mobility - Moved within same county (%) - Asian
Geographical mobility - Moved within same county (%) - Hispanic or Latino
Geographical mobility - Moved within same county (%) - American Indian and Alaska Native
Geographical mobility - Moved within same county (%) - Multirace
Geographical mobility - Moved within same county (%) - Other Race
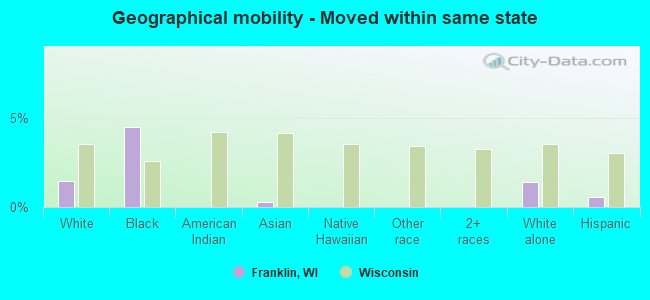
Geographical mobility - Moved from different county within same state (%)
Geographical mobility - Moved from different county within same state (%) - White
Geographical mobility - Moved from different county within same state (%) - Black or African American
Geographical mobility - Moved from different county within same state (%) - Asian
Geographical mobility - Moved from different county within same state (%) - Hispanic or Latino
Geographical mobility - Moved from different county within same state (%) - American Indian and Alaska Native
Geographical mobility - Moved from different county within same state (%) - Multirace
Geographical mobility - Moved from different county within same state (%) - Other Race
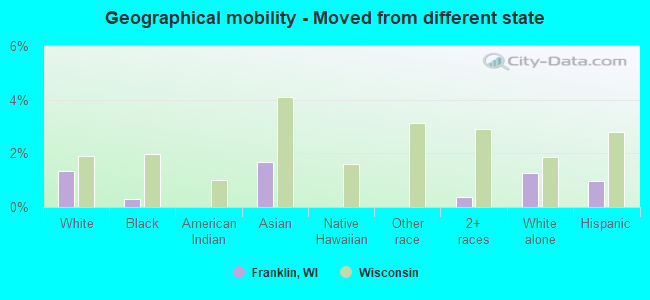
Geographical mobility - Moved from different state (%)
Geographical mobility - Moved from different state (%) - White
Geographical mobility - Moved from different state (%) - Black or African American
Geographical mobility - Moved from different state (%) - Asian
Geographical mobility - Moved from different state (%) - Hispanic or Latino
Geographical mobility - Moved from different state (%) - American Indian and Alaska Native
Geographical mobility - Moved from different state (%) - Multirace
Geographical mobility - Moved from different state (%) - Other Race
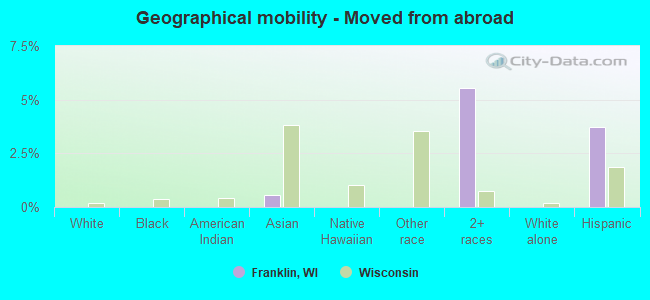
Geographical mobility - Moved from abroad (%)
Geographical mobility - Moved from abroad (%) - White
Geographical mobility - Moved from abroad (%) - Black or African American
Geographical mobility - Moved from abroad (%) - Asian
Geographical mobility - Moved from abroad (%) - Hispanic or Latino
Geographical mobility - Moved from abroad (%) - American Indian and Alaska Native
Geographical mobility - Moved from abroad (%) - Multirace
Geographical mobility - Moved from abroad (%) - Other Race
Place of birth for the foreign-born population - Ireland (%)
Place of birth for the foreign-born population - Denmark (%)
Place of birth for the foreign-born population - Norway (%)
Place of birth for the foreign-born population - Sweden (%)
Place of birth for the foreign-born population - United Kingdom (%)
Place of birth for the foreign-born population - England (%)
Place of birth for the foreign-born population - Scotland (%)
Place of birth for the foreign-born population - Other Northern Europe (%)
Place of birth for the foreign-born population - Austria (%)
Place of birth for the foreign-born population - Belgium (%)
Place of birth for the foreign-born population - France (%)
Place of birth for the foreign-born population - Germany (%)
Place of birth for the foreign-born population - Netherlands (%)
Place of birth for the foreign-born population - Switzerland (%)
Place of birth for the foreign-born population - Other Western Europe (%)
Place of birth for the foreign-born population - Greece (%)
Place of birth for the foreign-born population - Italy (%)
Place of birth for the foreign-born population - Portugal (%)
Place of birth for the foreign-born population - Spain (%)
Place of birth for the foreign-born population - Other Southern Europe (%)
Place of birth for the foreign-born population - Albania (%)
Place of birth for the foreign-born population - Belarus (%)
Place of birth for the foreign-born population - Bosnia and Herzegovina (%)
Place of birth for the foreign-born population - Bulgaria (%)
Place of birth for the foreign-born population - Croatia (%)
Place of birth for the foreign-born population - Czechoslovakia (%)
Place of birth for the foreign-born population - Hungary (%)
Place of birth for the foreign-born population - Latvia (%)
Place of birth for the foreign-born population - Lithuania (%)
Place of birth for the foreign-born population - North Macedonia (Macedonia) (%)
Place of birth for the foreign-born population - Moldova (%)
Place of birth for the foreign-born population - Poland (%)
Place of birth for the foreign-born population - Romania (%)
Place of birth for the foreign-born population - Russia (%)
Place of birth for the foreign-born population - Serbia (%)
Place of birth for the foreign-born population - Ukraine (%)
Place of birth for the foreign-born population - Other Eastern Europe (%)
Place of birth for the foreign-born population - China (%)
Place of birth for the foreign-born population - Hong Kong (%)
Place of birth for the foreign-born population - Taiwan (%)
Place of birth for the foreign-born population - Japan (%)
Place of birth for the foreign-born population - Korea (%)
Place of birth for the foreign-born population - Other Eastern Asia (%)
Place of birth for the foreign-born population - Afghanistan (%)
Place of birth for the foreign-born population - Bangladesh (%)
Place of birth for the foreign-born population - India (%)
Place of birth for the foreign-born population - Iran (%)
Place of birth for the foreign-born population - Kazakhstan (%)
Place of birth for the foreign-born population - Nepal (%)
Place of birth for the foreign-born population - Pakistan (%)
Place of birth for the foreign-born population - Sri Lanka (%)
Place of birth for the foreign-born population - Uzbekistan (%)
Place of birth for the foreign-born population - Other South Central Asia (%)
Place of birth for the foreign-born population - Burma (%)
Place of birth for the foreign-born population - Cambodia (%)
Place of birth for the foreign-born population - Indonesia (%)
Place of birth for the foreign-born population - Laos (%)
Place of birth for the foreign-born population - Malaysia (%)
Place of birth for the foreign-born population - Philippines (%)
Place of birth for the foreign-born population - Singapore (%)
Place of birth for the foreign-born population - Thailand (%)
Place of birth for the foreign-born population - Vietnam (%)
Place of birth for the foreign-born population - Other South Eastern Asia (%)
Place of birth for the foreign-born population - Armenia (%)
Place of birth for the foreign-born population - Iraq (%)
Place of birth for the foreign-born population - Israel (%)
Place of birth for the foreign-born population - Jordan (%)
Place of birth for the foreign-born population - Kuwait (%)
Place of birth for the foreign-born population - Lebanon (%)
Place of birth for the foreign-born population - Saudi Arabia (%)
Place of birth for the foreign-born population - Syria (%)
Place of birth for the foreign-born population - Turkey (%)
Place of birth for the foreign-born population - Yemen (%)
Place of birth for the foreign-born population - Other Western Asia (%)
Place of birth for the foreign-born population - Eritrea (%)
Place of birth for the foreign-born population - Ethiopia (%)
Place of birth for the foreign-born population - Kenya (%)
Place of birth for the foreign-born population - Somalia (%)
Place of birth for the foreign-born population - Uganda (%)
Place of birth for the foreign-born population - Zimbabwe (%)
Place of birth for the foreign-born population - Other Eastern Africa (%)
Place of birth for the foreign-born population - Cameroon (%)
Place of birth for the foreign-born population - Congo (%)
Place of birth for the foreign-born population - Democratic Republic of Congo (Zaire) (%)
Place of birth for the foreign-born population - Other Middle Africa (%)
Place of birth for the foreign-born population - Egypt (%)
Place of birth for the foreign-born population - Morocco (%)
Place of birth for the foreign-born population - Sudan (%)
Place of birth for the foreign-born population - Other Northern Africa (%)
Place of birth for the foreign-born population - South Africa (%)
Place of birth for the foreign-born population - Other Southern Africa (%)
Place of birth for the foreign-born population - Cabo Verde (%)
Place of birth for the foreign-born population - Ghana (%)
Place of birth for the foreign-born population - Liberia (%)
Place of birth for the foreign-born population - Nigeria (%)
Place of birth for the foreign-born population - Senegal (%)
Place of birth for the foreign-born population - Sierra Leone (%)
Place of birth for the foreign-born population - Other Western Africa (%)
Place of birth for the foreign-born population - Australia (%)
Place of birth for the foreign-born population - New Zealand (%)
Place of birth for the foreign-born population - Fiji (%)
Place of birth for the foreign-born population - Micronesia (%)
Place of birth for the foreign-born population - Bahamas (%)
Place of birth for the foreign-born population - Barbados (%)
Place of birth for the foreign-born population - Cuba (%)
Place of birth for the foreign-born population - Dominica (%)
Place of birth for the foreign-born population - Dominican Republic (%)
Place of birth for the foreign-born population - Grenada (%)
Place of birth for the foreign-born population - Haiti (%)
Place of birth for the foreign-born population - Jamaica (%)
Place of birth for the foreign-born population - St. Vincent and the Grenadines (%)
Place of birth for the foreign-born population - Trinidad and Tobago (%)
Place of birth for the foreign-born population - West Indies (%)
Place of birth for the foreign-born population - Other Caribbean (%)
Place of birth for the foreign-born population - Belize (%)
Place of birth for the foreign-born population - Costa Rica (%)
Place of birth for the foreign-born population - El Salvador (%)
Place of birth for the foreign-born population - Guatemala (%)
Place of birth for the foreign-born population - Honduras (%)
Place of birth for the foreign-born population - Mexico (%)
Place of birth for the foreign-born population - Nicaragua (%)
Place of birth for the foreign-born population - Panama (%)
Place of birth for the foreign-born population - Other Central America (%)
Place of birth for the foreign-born population - Argentina (%)
Place of birth for the foreign-born population - Bolivia (%)
Place of birth for the foreign-born population - Brazil (%)
Place of birth for the foreign-born population - Chile (%)
Place of birth for the foreign-born population - Colombia (%)
Place of birth for the foreign-born population - Ecuador (%)
Place of birth for the foreign-born population - Guyana (%)
Place of birth for the foreign-born population - Peru (%)
Place of birth for the foreign-born population - Uruguay (%)
Place of birth for the foreign-born population - Venezuela (%)
Place of birth for the foreign-born population - Other South America (%)
Place of birth for the foreign-born population - Canada (%)
Place of birth for the foreign-born population - Other Northern America (%)
Place of birth for the foreign-born population - Other (%)
Latest news about races in Franklin, WI collected exclusively by city-data.com from local newspapers, TV, and radio stations
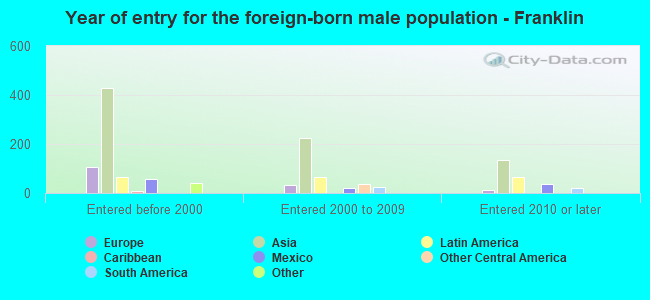
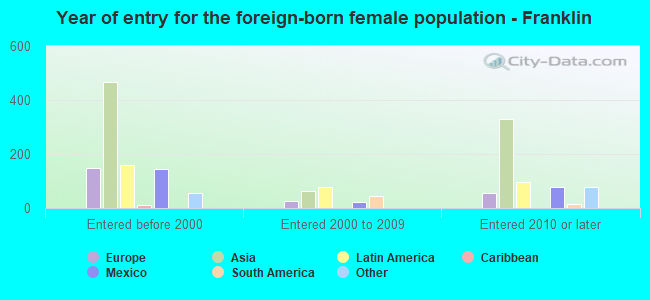
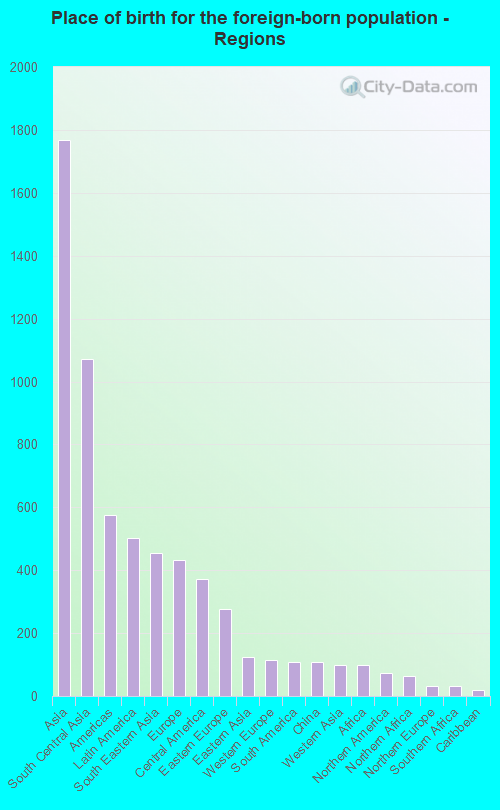
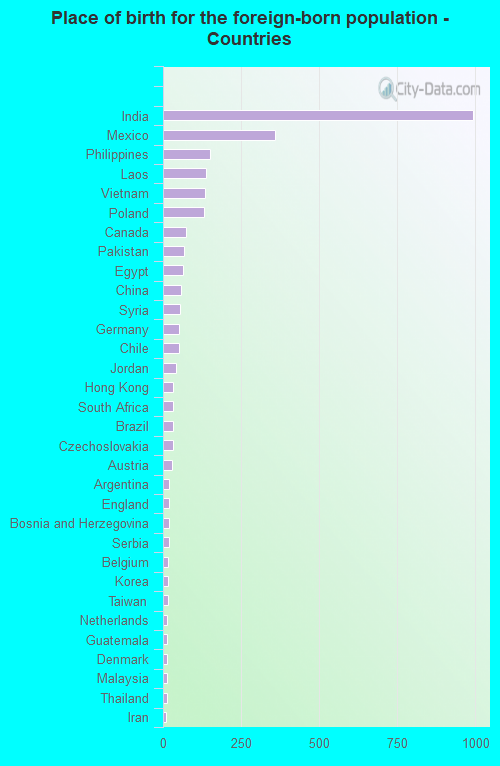
According to 2022 data, the most numerous races in Franklin, WI are White alone (28,645 residents), Hispanic (2,058 residents), and Black alone (1,338 residents). 87.7% of Franklin residents speak English at home. 8.0% of Franklin, WI residents are foreign-born (4.8% born in Asia, 1.4% born in Latin America, 1.2% born in Europe), which is 37.5% greater than the foreign-born rate of 5.0% across the entire state of Wisconsin.
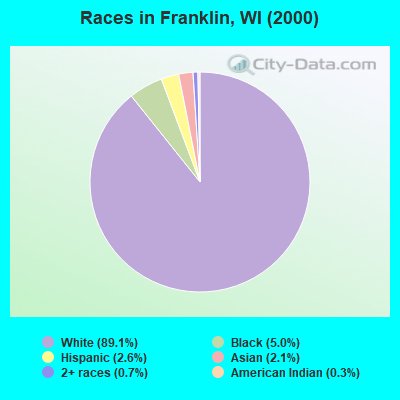
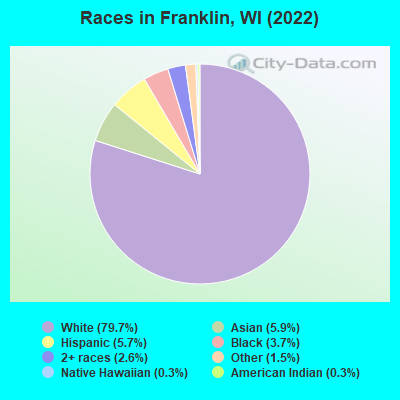
Race distribution in Franklin
2000 2022
4,681,630 87.3% White alone 300,245 5.6% Black alone 192,921 3.6% Hispanic 87,995 1.6% Asian alone 51,921 1.0% Two or more races 43,980 0.8% American Indian alone 3,637 0.07% Other race alone 1,346 0.03% Native Hawaiian and Other
4,654,031 79.0% White alone 447,022 7.6% Hispanic 345,678 5.9% Black alone 217,532 3.7% Two or more races 172,242 2.9% Asian alone 33,762 0.6% American Indian alone 19,680 0.3% Other race alone 2,592 0.04% Native Hawaiian and Other
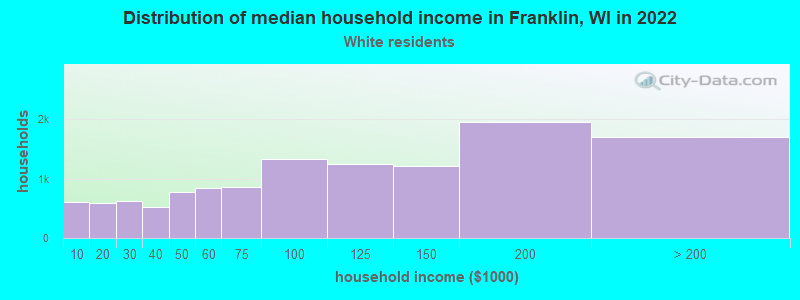
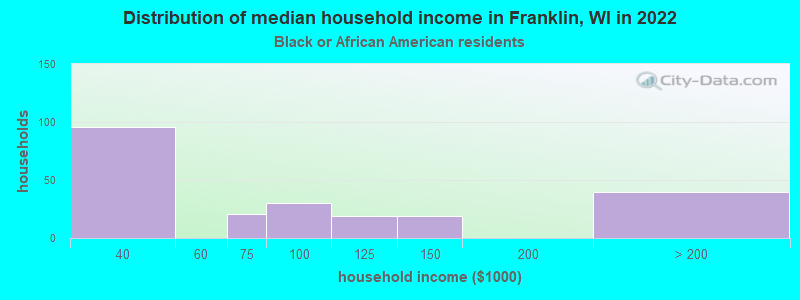
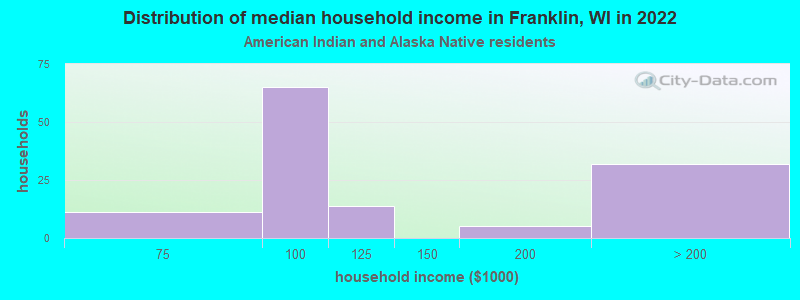
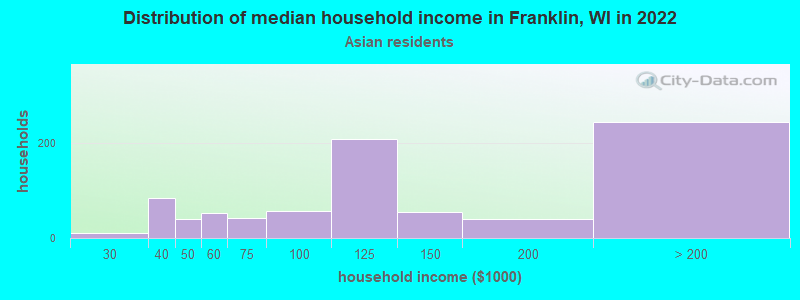
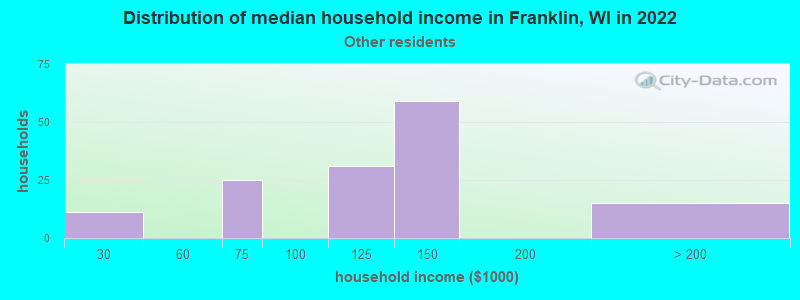
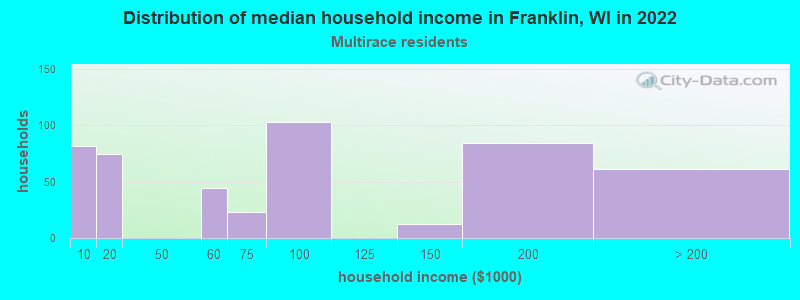
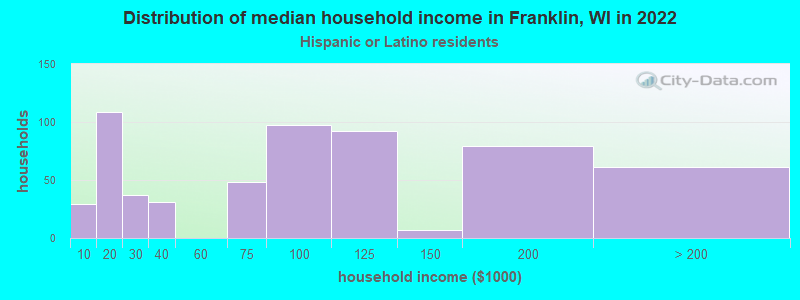
Income and house value in Franklin Median household income in 2022 $96,082 White non-Hispanic householders$92,901 Black householders$104,213 American Indian and Alaska Native householders$122,274 Asian householders$110,285 Some other race householders$85,305 Two or more races householders$90,225 Hispanic or Latino race householdersMedian 2022 house value $365,274 White Non-Hispanic householders$364,806 Black or African American householders$384,708 American Indian or Alaska Native householders $376,513 Asian householders$643,913 Some other race householders$439,031 Two or more races householders$394,543 Hispanic or Latino householders
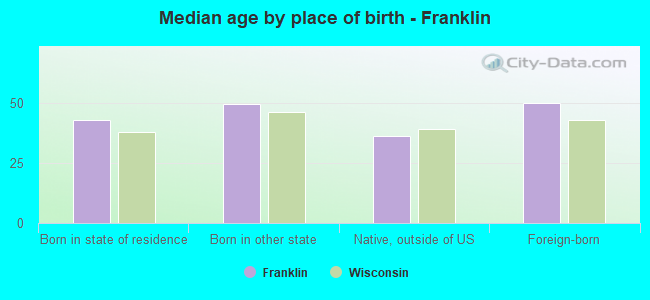
Median age by race in Franklin
47.1 Median age for White residents46.4 49.3 35.9 Median age for Black or African American residents31.3 53.6 28.8 Median age for American Indian / Alaska Native residents33.4 53.3 43.2 Median age for Asian residents44.7 40.8 14.2 Median age for Native Hawaiian / Pacific Islander residents-862,745,097.2 -732,444,443.7 38.3 Median age for Other race residents46.2 20.7 28.8 Median age for Two or more races residents19.9 30.7 47.5 Median age for White alone residents46.1 49.5 28.2 Median age for Hispanic or Latino residents27.6 29.3
Owner/renter occupied households by race in Franklin
House owners and renters - White residents 9,705 78.8% Owner occupied2,604 21.2% Renter occupiedHouse owners and renters - Black or African American residents 79 32.3% Owner occupied166 67.7% Renter occupiedHouse owners and renters - American Indian / Alaska Native residents 47 38.6% Owner occupied75 61.4% Renter occupiedHouse owners and renters - Asian residents 744 87.3% Owner occupied108 12.7% Renter occupiedHouse owners and renters - Native Hawaiian / Pacific Islander residents 15 100.0% Owner occupiedHouse owners and renters - Other race residents 126 91.5% Owner occupied12 8.5% Renter occupiedHouse owners and renters - Two or more races residents 267 56.7% Owner occupied204 43.3% Renter occupiedHouse owners and renters - White alone residents 9,745 78.9% Owner occupied2,604 21.1% Renter occupiedHouse owners and renters - Hispanic or Latino residents 308 53.5% Owner occupied268 46.5% Renter occupied
Language usage in Franklin
English speakers - Total 87.7% of residents of Franklin speak English at home.
3.1% of residents speak Spanish at home 697 65.4% Speak English very well369 34.6% Speak English less than very well9.1% of residents speak other language at home 2,244 72.5% Speak English very well853 27.5% Speak English less than very well
English speakers - Born in the United States 93.2% of residents of Franklin speak English at home.
2.4% of residents speak Spanish at home 133 100.0% Speak English very well3.8% of residents speak other language at home 209 100.0% Speak English very well
English speakers - Native, born elsewhere 41.0% of residents of Franklin speak English at home.
30.5% of residents speak Spanish at home 39 28.5% Speak English very well98 71.5% Speak English less than very well30.7% of residents speak other language at home 138 100.0% Speak English very well
English speakers - Foreign-born 14.2% of residents of Franklin speak English at home.
12.3% of residents speak Spanish at home 143 39.3% Speak English very well221 60.7% Speak English less than very well71.8% of residents speak other language at home 1,326 62.5% Speak English very well794 37.5% Speak English less than very well
White (Caucasian) - Speak only English Native:
98.3% (26,015)Foreign-born:
37.3% (177)
White (Caucasian) - Speak another language Native:
2.6% (676)Foreign-born:
65.3% (310)
Black or African American - Speak only English Native:
100.0% (1,321)Foreign-born:
92.5% (13)
Asian - Speak only English Native:
57.8% (387)Foreign-born:
9.3% (127)
Asian - Speak another language Native:
41.2% (276)Foreign-born:
91.0% (1,238)
Other race - Speak only English Native:
82.1% (212)Foreign-born:
7.5% (18)
Other race - Speak another language Native:
32.2% (83)Foreign-born:
90.9% (222)
Two or more races - Speak only English Native:
72.5% (958)Foreign-born:
5.5% (34)
Two or more races - Speak another language Native:
15.2% (201)Foreign-born:
94.4% (589)
White alone - Speak only English Native:
97.2% (25,788)Foreign-born:
25.9% (151)
White alone - Speak another language Native:
2.8% (730)Foreign-born:
74.5% (434)
Hispanic or Latino - Speak only English Native:
62.7% (902)Foreign-born:
18.0% (87)
Hispanic or Latino - Speak another language Native:
38.0% (547)Foreign-born:
83.6% (402)
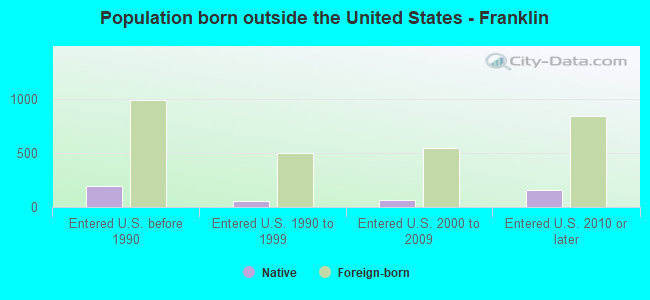
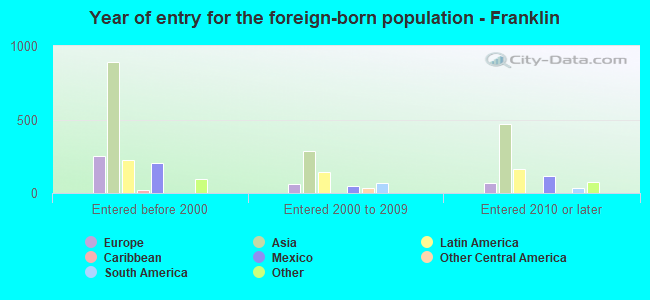
Foreign-born residents in Franklin 2,874 residents are foreign born (4.8% Asia , 1.4% Latin America , 1.2% Europe ).
This city:
8.0%Wisconsin:
5.0%
Marital status for residents in Franklin Marital status - White (Caucasian) population 15 years and over
Males 26.5% Never married64.0% Now married0.3% Separated2.8% Widowed6.4% DivorcedFemales 20.8% Never married56.9% Now married0.7% Separated10.3% Widowed11.2% DivorcedWomen who gave birth in the past 12 months Now married:
89.8% (227)Unmarried:
10.2% (26)
Women who did not give birth in the past 12 months Now married:
53.0% (2,730)Unmarried:
47.0% (2,425)
Marital status - Black or African American population 15 years and over
Males 82.1% Never married16.2% Now married1.1% Separated0.0% Widowed0.6% DivorcedFemales 30.8% Never married41.9% Now married22.4% Separated4.9% Widowed0.0% DivorcedWomen who gave birth in the past 12 months Now married:
100.0% (25)Unmarried:
0.0% (0)
Women who did not give birth in the past 12 months Now married:
42.8% (59)Unmarried:
57.2% (79)
Marital status - American Indian / Alaska Native population 15 years and over
Males 78.6% Never married21.4% Now married0.0% Separated0.0% Widowed0.0% DivorcedFemales 33.8% Never married46.2% Now married0.0% Separated0.0% Widowed20.0% DivorcedWomen who did not give birth in the past 12 months Now married:
0.0% (0)Unmarried:
100.0% (30)
Marital status - Asian population 15 years and over
Males 16.1% Never married72.7% Now married0.0% Separated5.1% Widowed6.1% DivorcedFemales 11.0% Never married71.3% Now married0.0% Separated7.1% Widowed10.6% DivorcedWomen who gave birth in the past 12 months Now married:
100.0% (32)Unmarried:
0.0% (0)
Women who did not give birth in the past 12 months Now married:
76.0% (394)Unmarried:
24.0% (124)
Marital status - Native Hawaiian / Pacific Islander population 15 years and over
Males 0.0% Never married100.0% Now married0.0% Separated0.0% Widowed0.0% DivorcedFemales 58.6% Never married41.4% Now married0.0% Separated0.0% Widowed0.0% DivorcedWomen who did not give birth in the past 12 months Now married:
41.4% (13)Unmarried:
58.6% (18)
Marital status - Other race population 15 years and over
Males 31.8% Never married58.4% Now married0.0% Separated5.7% Widowed4.1% DivorcedFemales 15.2% Never married84.8% Now married0.0% Separated0.0% Widowed0.0% DivorcedWomen who did not give birth in the past 12 months Now married:
77.4% (94)Unmarried:
22.6% (27)
Marital status - Two or more races population 15 years and over
Males 40.4% Never married57.0% Now married0.0% Separated0.0% Widowed2.6% DivorcedFemales 23.8% Never married70.3% Now married0.0% Separated0.0% Widowed5.9% DivorcedWomen who gave birth in the past 12 months Now married:
100.0% (172)Unmarried:
0.0% (0)
Women who did not give birth in the past 12 months Now married:
54.7% (171)Unmarried:
45.3% (141)
Marital status - White alone, not Hispanic / Latino population 15 years and over
Males 26.6% Never married63.7% Now married0.3% Separated2.9% Widowed6.5% DivorcedFemales 20.5% Never married57.3% Now married0.7% Separated10.5% Widowed10.9% DivorcedWomen who gave birth in the past 12 months Now married:
89.4% (230)Unmarried:
10.6% (27)
Women who did not give birth in the past 12 months Now married:
53.3% (2,793)Unmarried:
46.7% (2,446)
Marital status - Hispanic or Latino population 15 years and over
Males 40.8% Never married57.0% Now married0.0% Separated0.0% Widowed2.2% DivorcedFemales 32.1% Never married56.8% Now married0.0% Separated0.0% Widowed11.1% DivorcedWomen who gave birth in the past 12 months Now married:
100.0% (31)Unmarried:
0.0% (0)
Women who did not give birth in the past 12 months Now married:
61.4% (275)Unmarried:
38.6% (173)
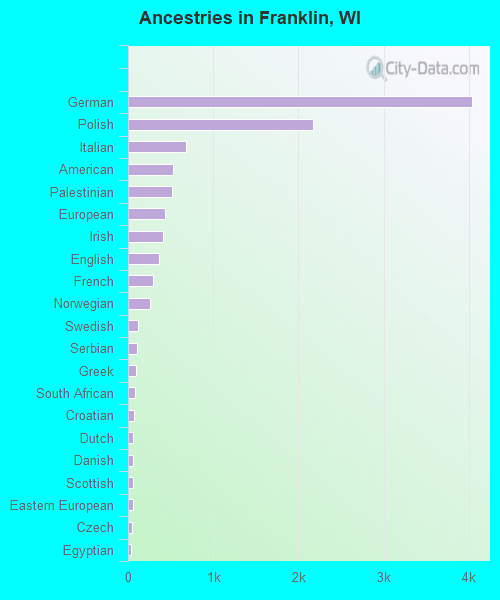
Ancestries in Franklin
4,033 25.3% German2,174 13.6% Polish680 4.3% Italian524 3.3% American520 3.3% Palestinian438 2.7% European409 2.6% Irish361 2.3% English294 1.8% French257 1.6% Norwegian115 0.7% Swedish102 0.6% Serbian93 0.6% Greek83 0.5% South African68 0.4% Croatian62 0.4% Dutch56 0.4% Danish55 0.3% Scottish54 0.3% Eastern European52 0.3% Czech37 0.2% Egyptian33 0.2% Slovak30 0.2% Syrian29 0.2% Welsh27 0.2% Belgian27 0.2% French Canadian26 0.2% Slavic26 0.2% Arab25 0.2% Ukrainian22 0.1% Lithuanian21 0.1% Scandinavian21 0.1% Albanian20 0.1% Armenian20 0.1% Slovene18 0.1% Portuguese16 0.1% Finnish16 0.1% Hungarian12 0.08% British12 0.08% Austrian12 0.08% Russian12 0.08% Iranian11 0.07% Jamaican10 0.06% Luxembourger10 0.06% Trinidadian and Tobagonian
Geographical mobility in Franklin Same house 1 year ago 25,555 91.5% White (Caucasian)547 40.7% Black or African American218 100.0% American Indian / Alaska Native1,971 91.1% Asian86 100.0% Native Hawaiian / Pacific Islander488 87.3% Other race1,793 85.0% Two or more races26,001 91.5% White alone, not Hispanic / Latino1,844 91.2% Hispanic or LatinoMoved within same county 1,470 5.3% White / Caucasian751 55.9% Black or African American155 7.2% Asian58 10.5% Other race187 8.9% Two or more races1,543 5.4% White alone, not Hispanic / Latino97 4.8% Hispanic or LatinoMoved within same state 403 1.4% White / Caucasian60 4.5% Black or African American6 0.3% Asian399 1.4% White alone, not Hispanic / Latino11 0.6% Hispanic or LatinoMoved from different state 380 1.4% White / Caucasian4 0.3% Black or African American36 1.7% Asian8 0.4% Two or more races363 1.3% White alone, not Hispanic / Latino19 1.0% Hispanic or LatinoMoved from abroad 12 0.6% Asian116 5.5% Two or more races75 3.7% Hispanic or Latino
Children Nativity (place of birth) in Franklin
Children under 6 years - Living with two parents Both parents native 2,115 100.0% NativeBoth parents foreign-born 285 100.0% NativeOne native, one foreign-born parent 39 100.0% NativeChildren under 6 years - Living with one parent Native parent 90 100.0% NativeForeign-born parent 5 100.0% NativeChildren 6 to 17 years - Living with two parents Both parents native 3,130 98.9% Native36 1.1% Foreign-bornBoth parents foreign-born 637 98.0% Native13 2.0% Foreign-bornOne native, one foreign-born parent 144 100.0% NativeChildren 6 to 17 years - Living with one parent Native parent 825 100.0% NativeForeign-born parent 131 48.9% Native137 51.1% Foreign-born
Grandparents responsible for own grandchildren in Franklin
Grandparents (30 to 59 years) White / Caucasian 67 100.0% Responsible for grandchildrenNative Hawaiian / Pacific Islander 30 100.0% Responsible for grandchildrenWhite alone, not Hispanic / Latino 91 100.0% Responsible for grandchildrenGrandparents (60 years and over) White / Caucasian 9 5.5% Responsible for grandchildren147 94.5% Not responsible for grandchildrenWhite alone, not Hispanic / Latino 9 5.3% Responsible for grandchildren169 94.7% Not responsible for grandchildren