Races in Gibbsboro, New Jersey (NJ) Detailed Stats
Data:
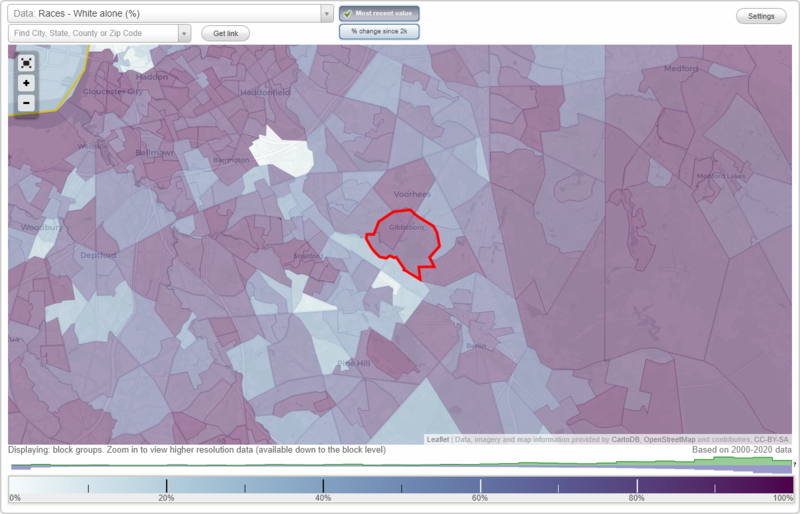
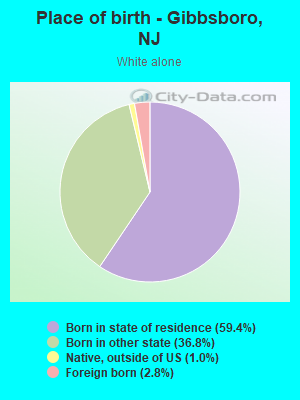
Races - White alone (%)
Races - White alone (% change since 2000)
Races - Black alone (%)
Races - Black alone (% change since 2000)
Races - American Indian alone (%)
Races - American Indian alone (% change since 2000)
Races - Asian alone (%)
Races - Asian alone (% change since 2000)
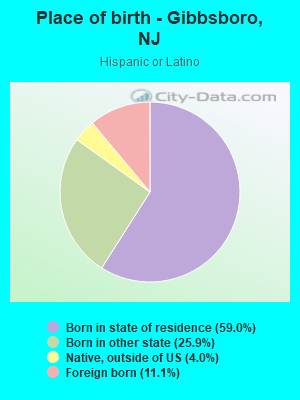
Races - Hispanic (%)
Races - Hispanic (% change since 2000)
Races - Native Hawaiian and Other Pacific Islander alone (%)
Races - Native Hawaiian and Other Pacific Islander alone (% change since 2000)
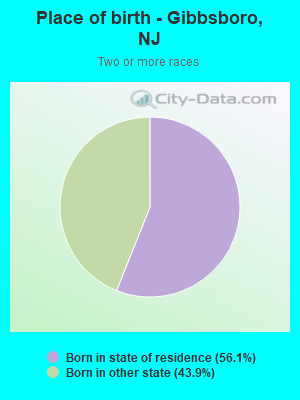
Races - Two or more races(%)
Races - Two or more races(% change since 2000)
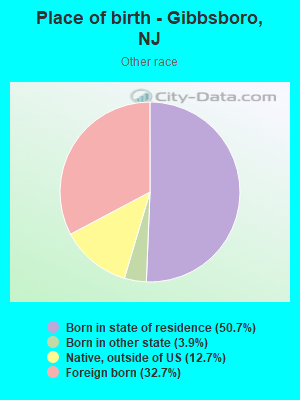
Races - Other race alone (%)
Races - Other race alone (% change since 2000)
Racial diversity
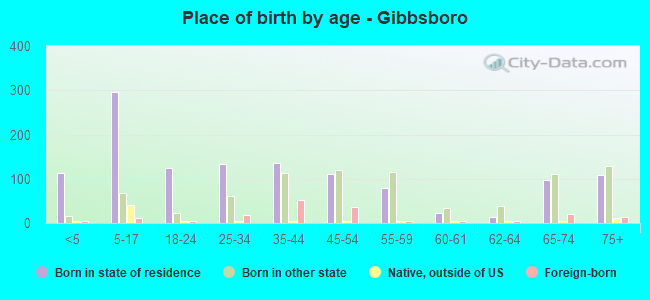
Place of birth - Born in state of residence (%)
Place of birth - Born in state of residence (%) - White
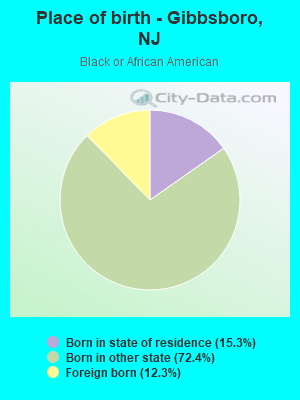
Place of birth - Born in state of residence (%) - Black or African American
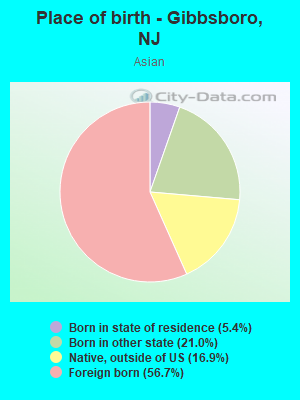
Place of birth - Born in state of residence (%) - Asian
Place of birth - Born in state of residence (%) - Hispanic or Latino
Place of birth - Born in state of residence (%) - American Indian and Alaska Native
Place of birth - Born in state of residence (%) - Multirace
Place of birth - Born in state of residence (%) - Other Race
Place of birth - Born in other state (%)
Place of birth - Born in other state (%) - White
Place of birth - Born in other state (%) - Black or African American
Place of birth - Born in other state (%) - Asian
Place of birth - Born in other state (%) - Hispanic or Latino
Place of birth - Born in other state (%) - American Indian and Alaska Native
Place of birth - Born in other state (%) - Multirace
Place of birth - Born in other state (%) - Other Race
Place of birth - Native, outside of US (%)
Place of birth - Native, outside of US (%) - White
Place of birth - Native, outside of US (%) - Black or African American
Place of birth - Native, outside of US (%) - Asian
Place of birth - Native, outside of US (%) - Hispanic or Latino
Place of birth - Native, outside of US (%) - American Indian and Alaska Native
Place of birth - Native, outside of US (%) - Multirace
Place of birth - Native, outside of US (%) - Other Race
Place of birth - Foreign born (%)
Place of birth - Foreign born (%) - White
Place of birth - Foreign born (%) - Black or African American
Place of birth - Foreign born (%) - Asian
Place of birth - Foreign born (%) - Hispanic or Latino
Place of birth - Foreign born (%) - American Indian and Alaska Native
Place of birth - Foreign born (%) - Multirace
Place of birth - Foreign born (%) - Other Race
Residents speaking English at home (%)
Residents speaking English at home - Born in the United States (%)
Residents speaking English at home - Native, born elsewhere (%)
Residents speaking English at home - Foreign born (%)
Residents speaking Spanish at home (%)
Residents speaking Spanish at home - Born in the United States (%)
Residents speaking Spanish at home - Native, born elsewhere (%)
Residents speaking Spanish at home - Foreign born (%)
Residents speaking other language at home (%)
Residents speaking other language at home - Born in the United States (%)
Residents speaking other language at home - Native, born elsewhere (%)
Residents speaking other language at home - Foreign born (%)
Marital status - Never married (%)
Marital status - Now married (%)
Marital status - Separated (%)
Marital status - Widowed (%)
Marital status - Divorced (%)
Ancestries Reported - Arab (%)
Ancestries Reported - Czech (%)
Ancestries Reported - Danish (%)
Ancestries Reported - Dutch (%)
Ancestries Reported - English (%)
Ancestries Reported - French (%)
Ancestries Reported - French Canadian (%)
Ancestries Reported - German (%)
Ancestries Reported - Greek (%)
Ancestries Reported - Hungarian (%)
Ancestries Reported - Irish (%)
Ancestries Reported - Italian (%)
Ancestries Reported - Lithuanian (%)
Ancestries Reported - Norwegian (%)
Ancestries Reported - Polish (%)
Ancestries Reported - Portuguese (%)
Ancestries Reported - Russian (%)
Ancestries Reported - Scotch-Irish (%)
Ancestries Reported - Scottish (%)
Ancestries Reported - Slovak (%)
Ancestries Reported - Subsaharan African (%)
Ancestries Reported - Swedish (%)
Ancestries Reported - Swiss (%)
Ancestries Reported - Ukrainian (%)
Ancestries Reported - United States (%)
Ancestries Reported - Welsh (%)
Ancestries Reported - West Indian (%)
Ancestries Reported - Other (%)
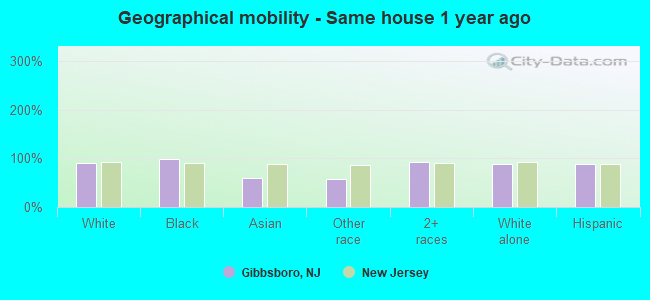
Geographical mobility - Same house 1 year ago (%)
Geographical mobility - Same house 1 year ago (%) - White
Geographical mobility - Same house 1 year ago (%) - Black or African American
Geographical mobility - Same house 1 year ago (%) - Asian
Geographical mobility - Same house 1 year ago (%) - Hispanic or Latino
Geographical mobility - Same house 1 year ago (%) - American Indian and Alaska Native
Geographical mobility - Same house 1 year ago (%) - Multirace
Geographical mobility - Same house 1 year ago (%) - Other Race
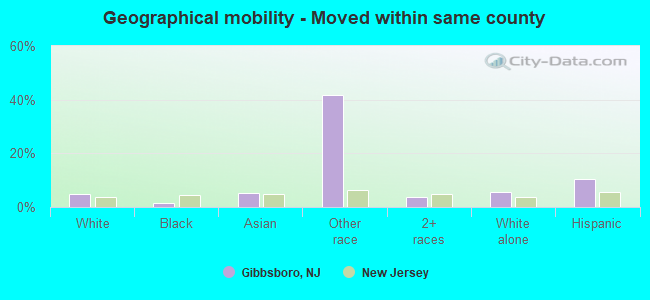
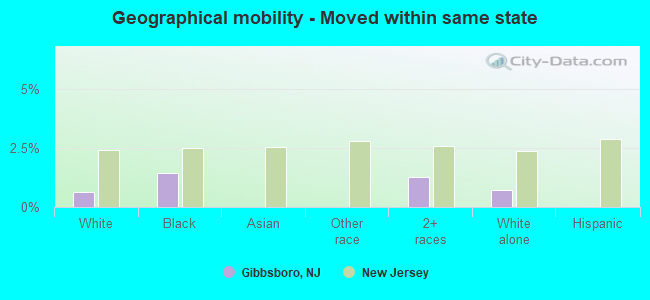
Geographical mobility - Moved within same county (%)
Geographical mobility - Moved within same county (%) - White
Geographical mobility - Moved within same county (%) - Black or African American
Geographical mobility - Moved within same county (%) - Asian
Geographical mobility - Moved within same county (%) - Hispanic or Latino
Geographical mobility - Moved within same county (%) - American Indian and Alaska Native
Geographical mobility - Moved within same county (%) - Multirace
Geographical mobility - Moved within same county (%) - Other Race
Geographical mobility - Moved from different county within same state (%)
Geographical mobility - Moved from different county within same state (%) - White
Geographical mobility - Moved from different county within same state (%) - Black or African American
Geographical mobility - Moved from different county within same state (%) - Asian
Geographical mobility - Moved from different county within same state (%) - Hispanic or Latino
Geographical mobility - Moved from different county within same state (%) - American Indian and Alaska Native
Geographical mobility - Moved from different county within same state (%) - Multirace
Geographical mobility - Moved from different county within same state (%) - Other Race
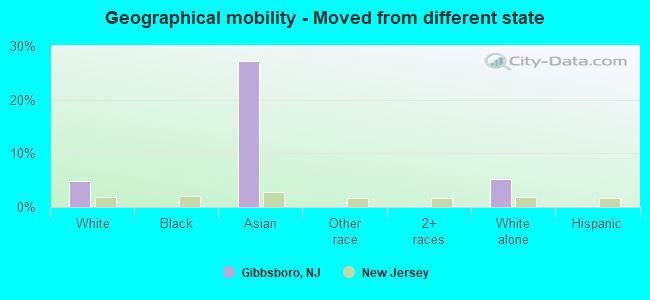
Geographical mobility - Moved from different state (%)
Geographical mobility - Moved from different state (%) - White
Geographical mobility - Moved from different state (%) - Black or African American
Geographical mobility - Moved from different state (%) - Asian
Geographical mobility - Moved from different state (%) - Hispanic or Latino
Geographical mobility - Moved from different state (%) - American Indian and Alaska Native
Geographical mobility - Moved from different state (%) - Multirace
Geographical mobility - Moved from different state (%) - Other Race
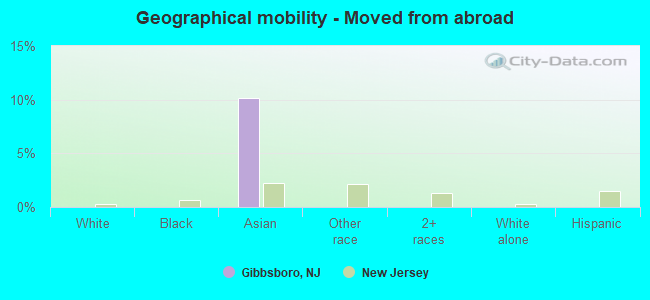
Geographical mobility - Moved from abroad (%)
Geographical mobility - Moved from abroad (%) - White
Geographical mobility - Moved from abroad (%) - Black or African American
Geographical mobility - Moved from abroad (%) - Asian
Geographical mobility - Moved from abroad (%) - Hispanic or Latino
Geographical mobility - Moved from abroad (%) - American Indian and Alaska Native
Geographical mobility - Moved from abroad (%) - Multirace
Geographical mobility - Moved from abroad (%) - Other Race
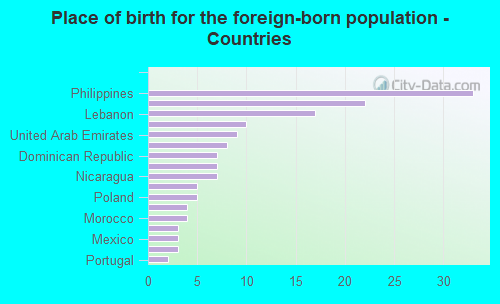
Place of birth for the foreign-born population - Ireland (%)
Place of birth for the foreign-born population - Denmark (%)
Place of birth for the foreign-born population - Norway (%)
Place of birth for the foreign-born population - Sweden (%)
Place of birth for the foreign-born population - United Kingdom (%)
Place of birth for the foreign-born population - England (%)
Place of birth for the foreign-born population - Scotland (%)
Place of birth for the foreign-born population - Other Northern Europe (%)
Place of birth for the foreign-born population - Austria (%)
Place of birth for the foreign-born population - Belgium (%)
Place of birth for the foreign-born population - France (%)
Place of birth for the foreign-born population - Germany (%)
Place of birth for the foreign-born population - Netherlands (%)
Place of birth for the foreign-born population - Switzerland (%)
Place of birth for the foreign-born population - Other Western Europe (%)
Place of birth for the foreign-born population - Greece (%)
Place of birth for the foreign-born population - Italy (%)
Place of birth for the foreign-born population - Portugal (%)
Place of birth for the foreign-born population - Spain (%)
Place of birth for the foreign-born population - Other Southern Europe (%)
Place of birth for the foreign-born population - Albania (%)
Place of birth for the foreign-born population - Belarus (%)
Place of birth for the foreign-born population - Bosnia and Herzegovina (%)
Place of birth for the foreign-born population - Bulgaria (%)
Place of birth for the foreign-born population - Croatia (%)
Place of birth for the foreign-born population - Czechoslovakia (%)
Place of birth for the foreign-born population - Hungary (%)
Place of birth for the foreign-born population - Latvia (%)
Place of birth for the foreign-born population - Lithuania (%)
Place of birth for the foreign-born population - North Macedonia (Macedonia) (%)
Place of birth for the foreign-born population - Moldova (%)
Place of birth for the foreign-born population - Poland (%)
Place of birth for the foreign-born population - Romania (%)
Place of birth for the foreign-born population - Russia (%)
Place of birth for the foreign-born population - Serbia (%)
Place of birth for the foreign-born population - Ukraine (%)
Place of birth for the foreign-born population - Other Eastern Europe (%)
Place of birth for the foreign-born population - China (%)
Place of birth for the foreign-born population - Hong Kong (%)
Place of birth for the foreign-born population - Taiwan (%)
Place of birth for the foreign-born population - Japan (%)
Place of birth for the foreign-born population - Korea (%)
Place of birth for the foreign-born population - Other Eastern Asia (%)
Place of birth for the foreign-born population - Afghanistan (%)
Place of birth for the foreign-born population - Bangladesh (%)
Place of birth for the foreign-born population - India (%)
Place of birth for the foreign-born population - Iran (%)
Place of birth for the foreign-born population - Kazakhstan (%)
Place of birth for the foreign-born population - Nepal (%)
Place of birth for the foreign-born population - Pakistan (%)
Place of birth for the foreign-born population - Sri Lanka (%)
Place of birth for the foreign-born population - Uzbekistan (%)
Place of birth for the foreign-born population - Other South Central Asia (%)
Place of birth for the foreign-born population - Burma (%)
Place of birth for the foreign-born population - Cambodia (%)
Place of birth for the foreign-born population - Indonesia (%)
Place of birth for the foreign-born population - Laos (%)
Place of birth for the foreign-born population - Malaysia (%)
Place of birth for the foreign-born population - Philippines (%)
Place of birth for the foreign-born population - Singapore (%)
Place of birth for the foreign-born population - Thailand (%)
Place of birth for the foreign-born population - Vietnam (%)
Place of birth for the foreign-born population - Other South Eastern Asia (%)
Place of birth for the foreign-born population - Armenia (%)
Place of birth for the foreign-born population - Iraq (%)
Place of birth for the foreign-born population - Israel (%)
Place of birth for the foreign-born population - Jordan (%)
Place of birth for the foreign-born population - Kuwait (%)
Place of birth for the foreign-born population - Lebanon (%)
Place of birth for the foreign-born population - Saudi Arabia (%)
Place of birth for the foreign-born population - Syria (%)
Place of birth for the foreign-born population - Turkey (%)
Place of birth for the foreign-born population - Yemen (%)
Place of birth for the foreign-born population - Other Western Asia (%)
Place of birth for the foreign-born population - Eritrea (%)
Place of birth for the foreign-born population - Ethiopia (%)
Place of birth for the foreign-born population - Kenya (%)
Place of birth for the foreign-born population - Somalia (%)
Place of birth for the foreign-born population - Uganda (%)
Place of birth for the foreign-born population - Zimbabwe (%)
Place of birth for the foreign-born population - Other Eastern Africa (%)
Place of birth for the foreign-born population - Cameroon (%)
Place of birth for the foreign-born population - Congo (%)
Place of birth for the foreign-born population - Democratic Republic of Congo (Zaire) (%)
Place of birth for the foreign-born population - Other Middle Africa (%)
Place of birth for the foreign-born population - Egypt (%)
Place of birth for the foreign-born population - Morocco (%)
Place of birth for the foreign-born population - Sudan (%)
Place of birth for the foreign-born population - Other Northern Africa (%)
Place of birth for the foreign-born population - South Africa (%)
Place of birth for the foreign-born population - Other Southern Africa (%)
Place of birth for the foreign-born population - Cabo Verde (%)
Place of birth for the foreign-born population - Ghana (%)
Place of birth for the foreign-born population - Liberia (%)
Place of birth for the foreign-born population - Nigeria (%)
Place of birth for the foreign-born population - Senegal (%)
Place of birth for the foreign-born population - Sierra Leone (%)
Place of birth for the foreign-born population - Other Western Africa (%)
Place of birth for the foreign-born population - Australia (%)
Place of birth for the foreign-born population - New Zealand (%)
Place of birth for the foreign-born population - Fiji (%)
Place of birth for the foreign-born population - Micronesia (%)
Place of birth for the foreign-born population - Bahamas (%)
Place of birth for the foreign-born population - Barbados (%)
Place of birth for the foreign-born population - Cuba (%)
Place of birth for the foreign-born population - Dominica (%)
Place of birth for the foreign-born population - Dominican Republic (%)
Place of birth for the foreign-born population - Grenada (%)
Place of birth for the foreign-born population - Haiti (%)
Place of birth for the foreign-born population - Jamaica (%)
Place of birth for the foreign-born population - St. Vincent and the Grenadines (%)
Place of birth for the foreign-born population - Trinidad and Tobago (%)
Place of birth for the foreign-born population - West Indies (%)
Place of birth for the foreign-born population - Other Caribbean (%)
Place of birth for the foreign-born population - Belize (%)
Place of birth for the foreign-born population - Costa Rica (%)
Place of birth for the foreign-born population - El Salvador (%)
Place of birth for the foreign-born population - Guatemala (%)
Place of birth for the foreign-born population - Honduras (%)
Place of birth for the foreign-born population - Mexico (%)
Place of birth for the foreign-born population - Nicaragua (%)
Place of birth for the foreign-born population - Panama (%)
Place of birth for the foreign-born population - Other Central America (%)
Place of birth for the foreign-born population - Argentina (%)
Place of birth for the foreign-born population - Bolivia (%)
Place of birth for the foreign-born population - Brazil (%)
Place of birth for the foreign-born population - Chile (%)
Place of birth for the foreign-born population - Colombia (%)
Place of birth for the foreign-born population - Ecuador (%)
Place of birth for the foreign-born population - Guyana (%)
Place of birth for the foreign-born population - Peru (%)
Place of birth for the foreign-born population - Uruguay (%)
Place of birth for the foreign-born population - Venezuela (%)
Place of birth for the foreign-born population - Other South America (%)
Place of birth for the foreign-born population - Canada (%)
Place of birth for the foreign-born population - Other Northern America (%)
Place of birth for the foreign-born population - Other (%)
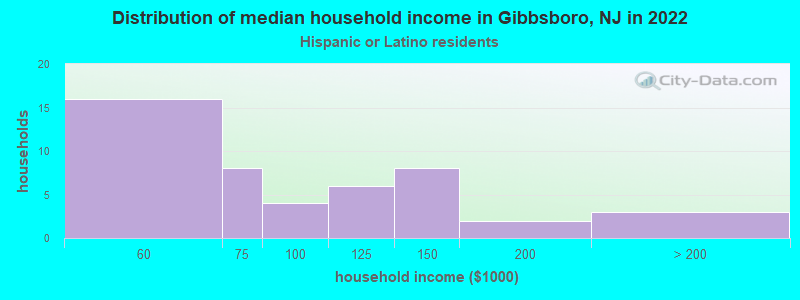
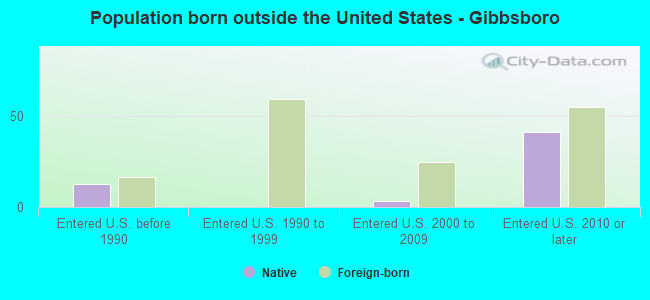
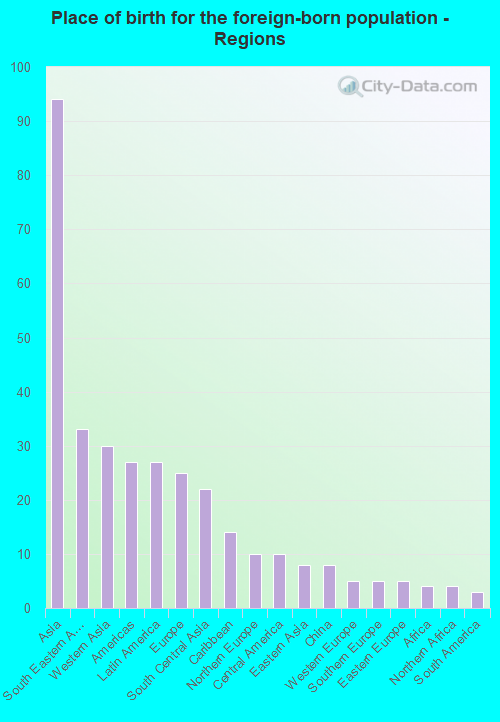
According to 2022 data, the most numerous races in Gibbsboro, NJ are White alone (1,759 residents), Hispanic (229 residents), and Black alone (51 residents). 88.2% of Gibbsboro residents speak English at home. 6.6% of Gibbsboro, NJ residents are foreign-born (4.1% born in Asia, 1.2% born in Latin America, 1.1% born in Europe), which is 248.5% less than the foreign-born rate of 23.0% across the entire state of New Jersey.
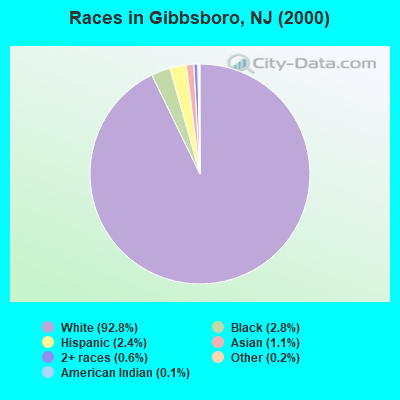
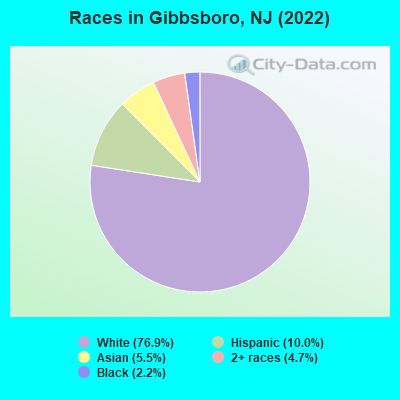
Race distribution in Gibbsboro
2000 2022
5,557,209 66.0% White alone 1,117,191 13.3% Hispanic 1,096,171 13.0% Black alone 477,012 5.7% Asian alone 133,689 1.6% Two or more races 19,565 0.2% Other race alone 11,338 0.1% American Indian alone 2,175 0.03% Native Hawaiian and Other
4,766,476 51.5% White alone 2,028,470 21.9% Hispanic 1,111,632 12.0% Black alone 923,546 10.0% Asian alone 332,237 3.6% Two or more races 89,847 1.0% Other race alone 8,557 0.09% American Indian alone 934 0.01% Native Hawaiian and Other
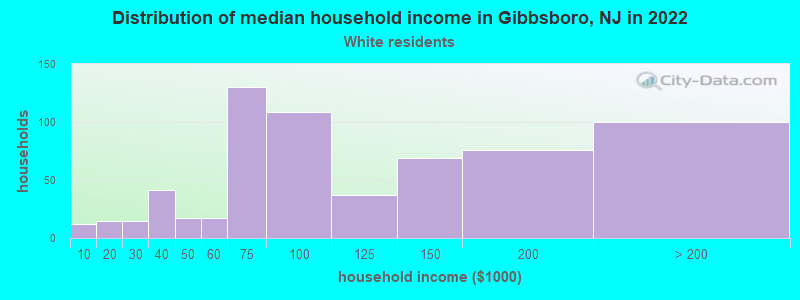
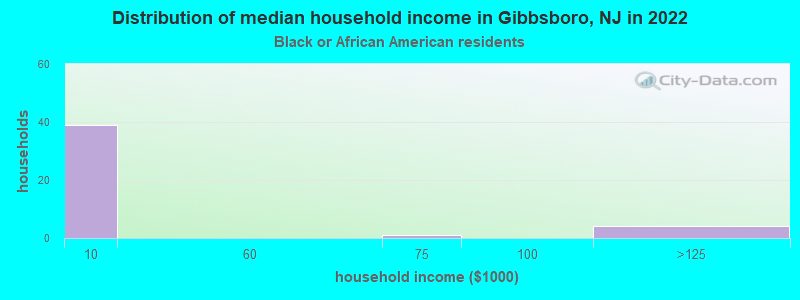
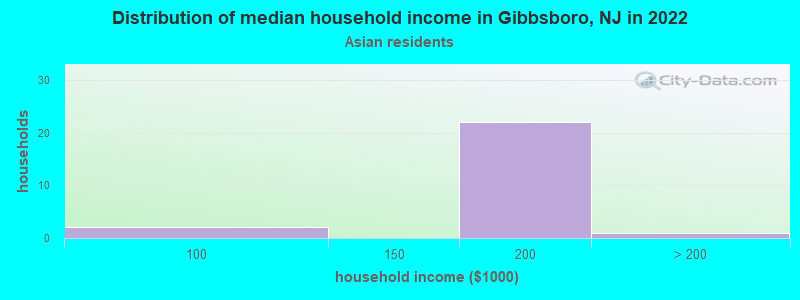
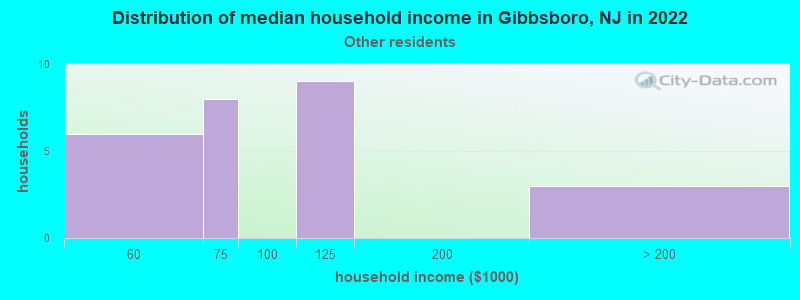
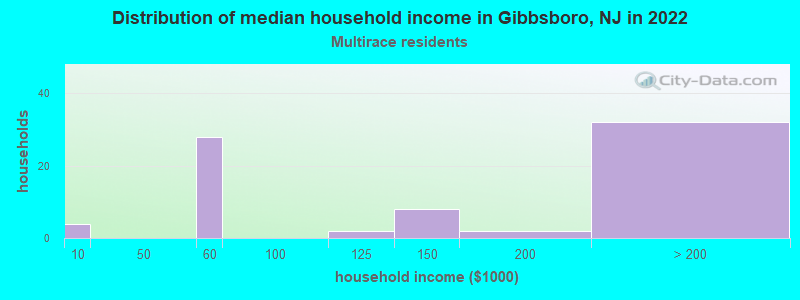
Income and house value in Gibbsboro Median household income in 2022 $91,584 White non-Hispanic householders$8,673 Black householders$191,527 Asian householders$72,170 Some other race householders$93,124 Hispanic or Latino race householdersMedian 2022 house value $297,212 White Non-Hispanic householders$831,330 Black or African American householders $699,773 Asian householders$286,270 Two or more races householders$241,739 Hispanic or Latino householders
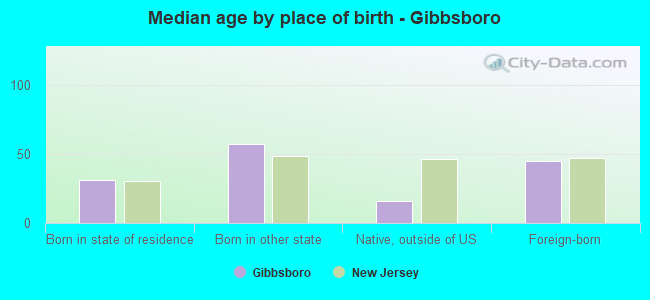
Median age by race in Gibbsboro
47.7 Median age for White residents48.4 47.0 38.8 Median age for Black or African American residents38.5 40.5 -676,272,813.9 Median age for American Indian / Alaska Native residents-670,465,336.5 -688,298,917.7 40.0 Median age for Asian residents48.2 17.2 -701,509,871.5 Median age for Native Hawaiian / Pacific Islander residents-860,335,194.7 -668,881,505.4 38.3 Median age for Other race residents53.2 25.5 18.2 Median age for Two or more races residents7.2 22.3 48.9 Median age for White alone residents48.1 50.4 16.5 Median age for Hispanic or Latino residents9.3 16.8
Owner/renter occupied households by race in Gibbsboro
House owners and renters - White residents 624 95.2% Owner occupied31 4.8% Renter occupiedHouse owners and renters - Black or African American residents 4 9.9% Owner occupied39 90.1% Renter occupiedHouse owners and renters - Asian residents 31 100.0% Owner occupiedHouse owners and renters - Other race residents 21 100.0% Owner occupiedHouse owners and renters - Two or more races residents 74 100.0% Owner occupiedHouse owners and renters - White alone residents 631 95.7% Owner occupied29 4.3% Renter occupiedHouse owners and renters - Hispanic or Latino residents 38 88.4% Owner occupied5 11.6% Renter occupied
Language usage in Gibbsboro
English speakers - Total 88.2% of residents of Gibbsboro speak English at home.
2.8% of residents speak Spanish at home 41 67.2% Speak English very well20 32.8% Speak English less than very well7.5% of residents speak other language at home 107 66.0% Speak English very well55 34.0% Speak English less than very well
English speakers - Born in the United States 92.9% of residents of Gibbsboro speak English at home.
0.9% of residents speak Spanish at home 7 100.0% Speak English very well6.6% of residents speak other language at home 54 100.0% Speak English very well
English speakers - Native, born elsewhere 83.0% of residents of Gibbsboro speak English at home.
15.1% of residents speak other language at home 8 100.0% Speak English very well
English speakers - Foreign-born 27.1% of residents of Gibbsboro speak English at home.
12.9% of residents speak Spanish at home 7 35.0% Speak English very well13 65.0% Speak English less than very well51.0% of residents speak other language at home 27 34.2% Speak English very well52 65.8% Speak English less than very well
White (Caucasian) - Speak only English Native:
98.2% (1,636)Foreign-born:
37.8% (15)
White (Caucasian) - Speak another language Native:
2.0% (34)Foreign-born:
61.7% (25)
Black or African American - Speak only English Native:
19.8% (9)Foreign-born:
100.0% (7)
Asian - Speak only English Native:
79.6% (44)Foreign-born:
20.5% (13)
Asian - Speak another language Native:
27.0% (15)Foreign-born:
81.1% (51)
Other race - Speak only English Native:
81.7% (37)Foreign-born:
15.4% (4)
Other race - Speak another language Native:
23.6% (11)Foreign-born:
84.8% (21)
White alone - Speak only English Native:
97.1% (1,595)Foreign-born:
36.1% (18)
White alone - Speak another language Native:
2.8% (47)Foreign-born:
63.2% (31)
Hispanic or Latino - Speak only English Native:
81.2% (129)Foreign-born:
10.9% (3)
Hispanic or Latino - Speak another language Native:
17.1% (27)Foreign-born:
87.0% (21)
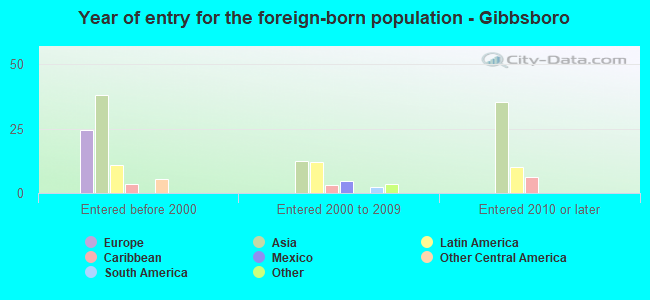
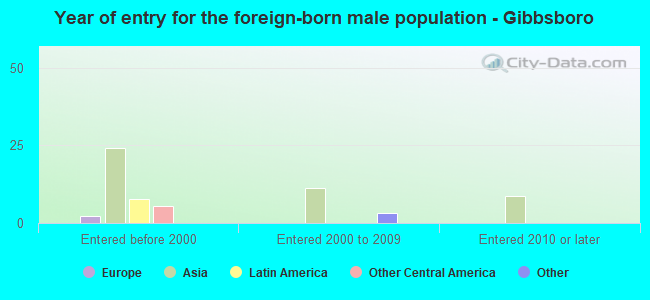
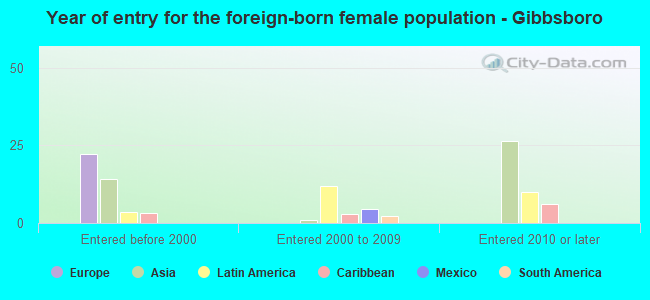
Foreign-born residents in Gibbsboro 151 residents are foreign born (4.1% Asia , 1.2% Latin America , 1.1% Europe ).
This city:
6.6%New Jersey:
23.2%
Marital status for residents in Gibbsboro Marital status - White (Caucasian) population 15 years and over
Males 36.9% Never married56.7% Now married0.0% Separated1.0% Widowed5.5% DivorcedFemales 30.1% Never married50.8% Now married0.9% Separated11.4% Widowed6.9% DivorcedWomen who gave birth in the past 12 months Now married:
76.9% (19)Unmarried:
23.1% (6)
Women who did not give birth in the past 12 months Now married:
38.9% (133)Unmarried:
61.1% (209)
Marital status - Black or African American population 15 years and over
Males 91.1% Never married0.0% Now married0.0% Separated0.0% Widowed8.9% DivorcedFemales 0.0% Never married87.5% Now married0.0% Separated0.0% Widowed12.5% DivorcedWomen who did not give birth in the past 12 months Now married:
100.0% (4)Unmarried:
0.0% (0)
Marital status - Asian population 15 years and over
Males 0.0% Never married80.8% Now married0.0% Separated19.2% Widowed0.0% DivorcedFemales 46.7% Never married37.3% Now married0.0% Separated16.0% Widowed0.0% DivorcedWomen who did not give birth in the past 12 months Now married:
43.1% (26)Unmarried:
56.9% (34)
Marital status - Other race population 15 years and over
Males 12.5% Never married87.5% Now married0.0% Separated0.0% Widowed0.0% DivorcedFemales 0.0% Never married100.0% Now married0.0% Separated0.0% Widowed0.0% DivorcedWomen who did not give birth in the past 12 months Now married:
100.0% (21)Unmarried:
0.0% (0)
Marital status - Two or more races population 15 years and over
Males 7.7% Never married57.7% Now married0.0% Separated0.0% Widowed34.6% DivorcedFemales 65.6% Never married7.8% Now married0.0% Separated3.1% Widowed23.4% DivorcedWomen who gave birth in the past 12 months Now married:
0.0% (0)Unmarried:
100.0% (14)
Women who did not give birth in the past 12 months Now married:
10.5% (5)Unmarried:
89.5% (47)
Marital status - White alone, not Hispanic / Latino population 15 years and over
Males 37.1% Never married56.4% Now married0.0% Separated1.0% Widowed5.6% DivorcedFemales 26.5% Never married53.4% Now married0.9% Separated12.0% Widowed7.2% DivorcedWomen who gave birth in the past 12 months Now married:
76.9% (19)Unmarried:
23.1% (6)
Women who did not give birth in the past 12 months Now married:
43.2% (135)Unmarried:
56.8% (178)
Marital status - Hispanic or Latino population 15 years and over
Males 9.5% Never married90.5% Now married0.0% Separated0.0% Widowed0.0% DivorcedFemales 72.2% Never married26.7% Now married0.0% Separated0.0% Widowed1.1% DivorcedWomen who gave birth in the past 12 months Now married:
0.0% (0)Unmarried:
100.0% (7)
Women who did not give birth in the past 12 months Now married:
28.0% (24)Unmarried:
72.0% (61)
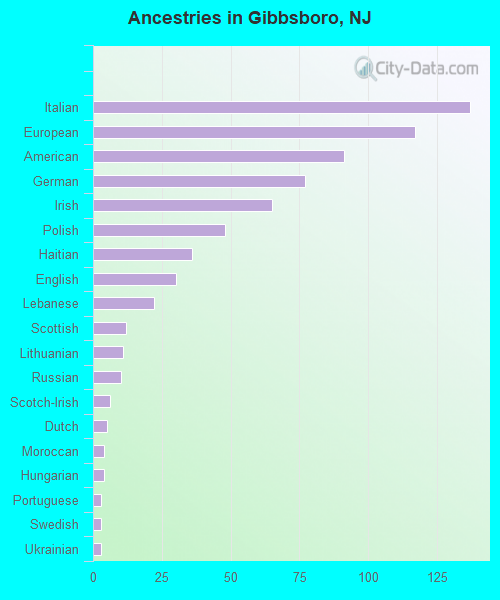
Ancestries in Gibbsboro
137 17.5% Italian117 14.9% European91 11.6% American77 9.8% German65 8.3% Irish48 6.1% Polish36 4.6% Haitian30 3.8% English22 2.8% Lebanese12 1.5% Scottish11 1.4% Lithuanian10 1.3% Russian6 0.8% Scotch-Irish5 0.6% Dutch4 0.5% Moroccan4 0.5% Hungarian3 0.4% Portuguese3 0.4% Swedish3 0.4% Ukrainian
Children Nativity (place of birth) in Gibbsboro
Children under 6 years - Living with two parents Both parents native 60 100.0% NativeBoth parents foreign-born 35 100.0% NativeOne native, one foreign-born parent 14 100.0% NativeChildren under 6 years - Living with one parent Native parent 50 100.0% NativeChildren 6 to 17 years - Living with two parents Both parents native 201 100.0% NativeOne native, one foreign-born parent 57 86.4% Native9 13.6% Foreign-bornChildren 6 to 17 years - Living with one parent Native parent 97 100.0% Native
Grandparents responsible for own grandchildren in Gibbsboro
Grandparents (30 to 59 years) White / Caucasian 17 100.0% Not responsible for grandchildrenOther race 7 100.0% Not responsible for grandchildrenWhite alone, not Hispanic / Latino 17 100.0% Not responsible for grandchildrenHispanic or Latino 6 100.0% Not responsible for grandchildren
Grandparents (60 years and over) White / Caucasian 30 100.0% Not responsible for grandchildrenOther race 20 100.0% Not responsible for grandchildrenWhite alone, not Hispanic / Latino 35 100.0% Not responsible for grandchildrenHispanic or Latino 6 100.0% Not responsible for grandchildren