Races in Grafton, New York (NY) Detailed Stats
Ancestries, Foreign-born residents, place of birth

Recent posts about races in Grafton, New York on our local forum with over 2,400,000 registered users:
 | Potentially moving to Albany very soon (24 replies) |
1.7% of Grafton, NY residents are foreign-born , which is 1224.7% less than the foreign-born rate of 22.0% across the entire state of New York.
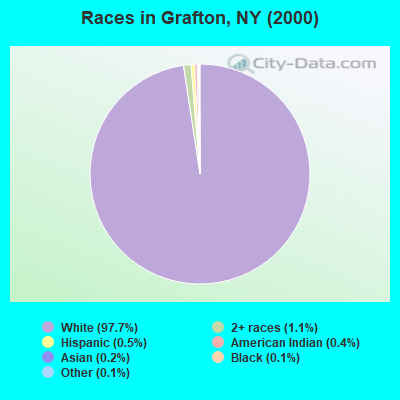
Race distribution in Grafton

- 1,94297.7%White alone
- 211.1%Two or more races
- 90.5%Hispanic
- 70.4%American Indian alone
- 40.2%Asian alone
- 20.1%Black alone
- 20.1%Other race alone
2000
2022
-
- 11,760,98162.0%White alone
- 2,867,58315.1%Hispanic
- 2,812,62314.8%Black alone
- 1,035,9265.5%Asian alone
- 366,1161.9%Two or more races
- 75,4990.4%Other race alone
- 52,4990.3%American Indian alone
- 5,2300.03%Native Hawaiian and Other
Pacific Islander alone

-
- 10,408,93352.9%White alone
- 3,867,29919.7%Hispanic
- 2,633,84013.4%Black alone
- 1,776,2869.0%Asian alone
- 732,6703.7%Two or more races
- 216,1101.1%Other race alone
- 35,0820.2%American Indian alone
- 6,9310.04%Native Hawaiian and Other
Pacific Islander alone

Income and house value in Grafton
- Median household income in 2022
- $96,873White non-Hispanic householders
- $5,993Asian householders
- $100,913Some other race householders
- $175,372Two or more races householders
- over $200,000Hispanic or Latino race householders
- Median 2022 house value
- $238,979White Non-Hispanic householders
- $236,736American Indian or Alaska Native householders
- $280,346Two or more races householders
- over $1,000,000Hispanic or Latino householders
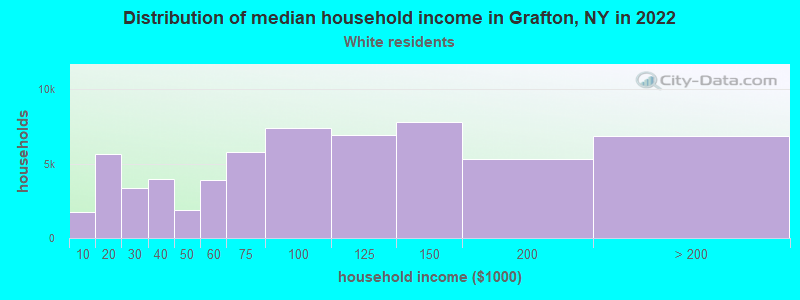
Household income for White non-Hispanic householders
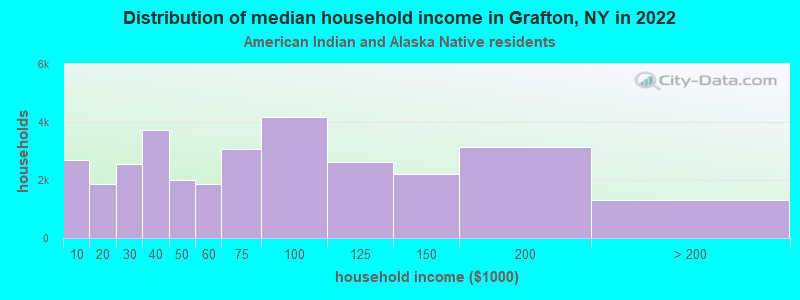
Household income for American Indian and Alaska Native householders
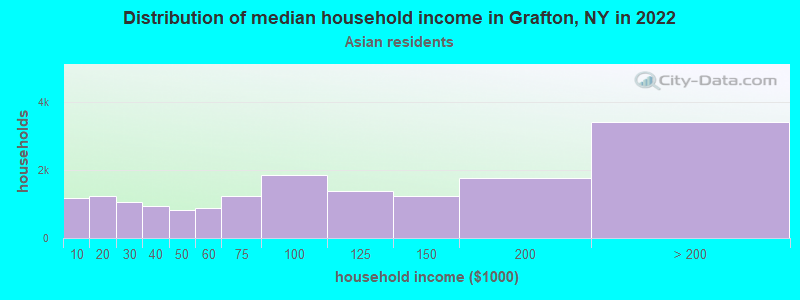
Household income for Asian householders
Household income for Two or more races householders
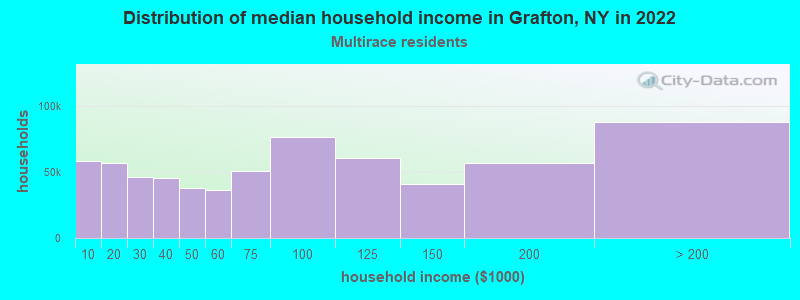
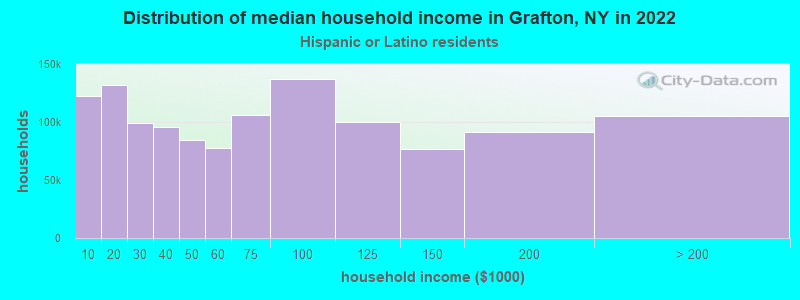
Household income for Hispanic or Latino race householders
Foreign-born residents in Grafton
33 residents are foreign born
| This city: | 1.7% |
| New York: | 20.4% |
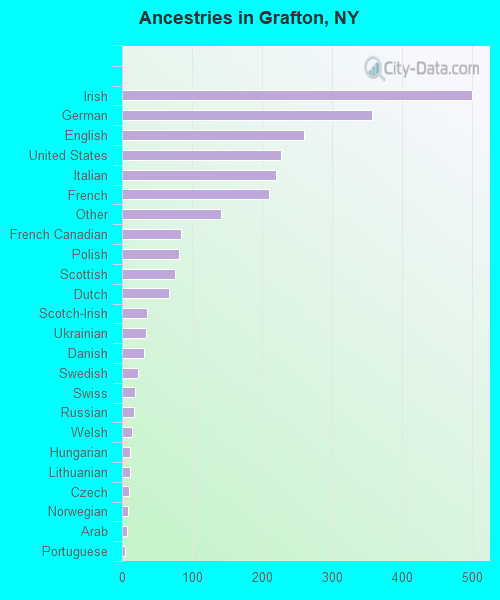
Ancestries in Grafton

- 50020.3%Irish
- 35814.5%German
- 26010.6%English
- 2289.3%United States
- 2219.0%Italian
- 2108.5%French
- 1415.7%Other
- 843.4%French Canadian
- 813.3%Polish
- 763.1%Scottish
- 672.7%Dutch
- 361.5%Scotch-Irish
- 341.4%Ukrainian
- 311.3%Danish
- 230.9%Swedish
- 180.7%Swiss
- 170.7%Russian
- 150.6%Welsh
- 120.5%Hungarian
- 120.5%Lithuanian
- 100.4%Czech
- 90.4%Norwegian
- 70.3%Arab
- 50.2%Portuguese
- 40.2%Slovak
- 30.1%Greek
Zip codes: 12052.