Races in Graniteville-East Barre, Vermont (VT) Detailed Stats
Ancestries, Foreign-born residents, place of birth

Discuss Graniteville-East Barre, Vermont races on our local forum with over 2,400,000 registered users
3.3% of Graniteville-East Barre, VT residents are foreign-born (2.4% born in North America, 0.5% born in Europe, 0.4% born in Asia), which is 22.1% less than the foreign-born rate of 4.0% across the entire state of Vermont.
Race distribution in Graniteville-East Barre

- 2,05896.3%White alone
- 371.7%Hispanic
- 251.2%Two or more races
- 90.4%Asian alone
- 40.2%Black alone
- 30.1%American Indian alone
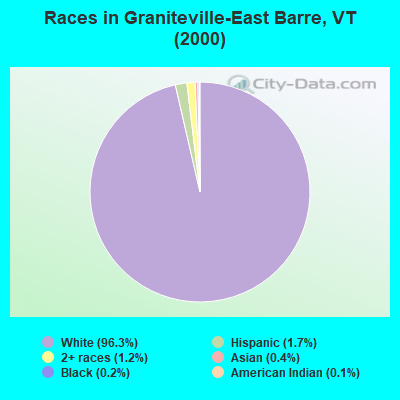
2000
2022
-
- 585,43196.2%White alone
- 6,8091.1%Two or more races
- 5,5040.9%Hispanic
- 5,1600.8%Asian alone
- 2,9210.5%Black alone
- 2,3250.4%American Indian alone
- 5570.09%Other race alone
- 1200.02%Native Hawaiian and Other
Pacific Islander alone

-
- 583,54690.2%White alone
- 27,3404.2%Two or more races
- 14,7702.3%Hispanic
- 11,5121.8%Asian alone
- 6,2641.0%Black alone
- 2,5210.4%Other race alone
- 1,0520.2%American Indian alone
- 590.01%Native Hawaiian and Other
Pacific Islander alone

Income and house value in Graniteville-East Barre
- Median household income in 2022
- $65,415White non-Hispanic householders
- $174,275Two or more races householders
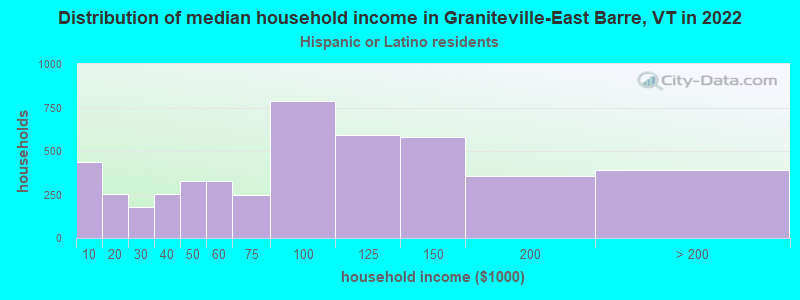
- $78,279Hispanic or Latino race householders
- Median 2022 house value
- $248,889White Non-Hispanic householders
- $192,135American Indian or Alaska Native householders
- $192,135Two or more races householders
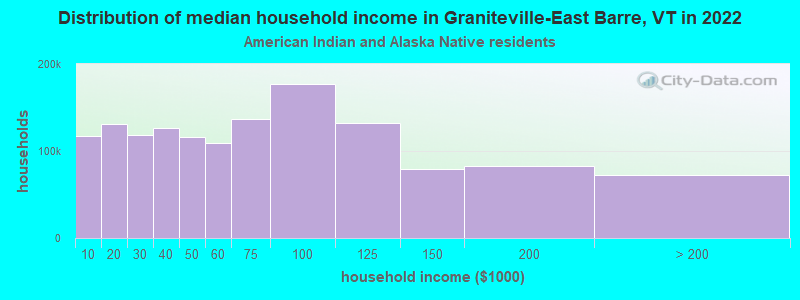
Household income for White non-Hispanic householders
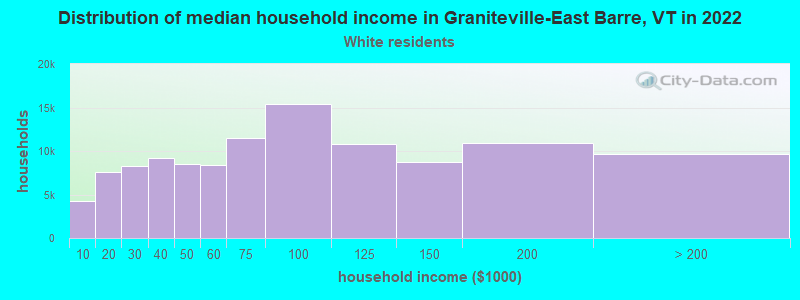
Household income for American Indian and Alaska Native householders
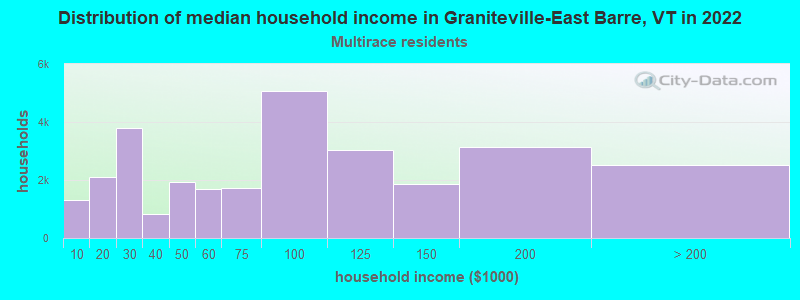
Household income for Two or more races householders
Household income for Hispanic or Latino race householders
Foreign-born residents in Graniteville-East Barre
70 residents are foreign born (2.4% North America, 0.5% Europe, 0.4% Asia).
| This city: | 3.3% |
| Vermont: | 3.8% |
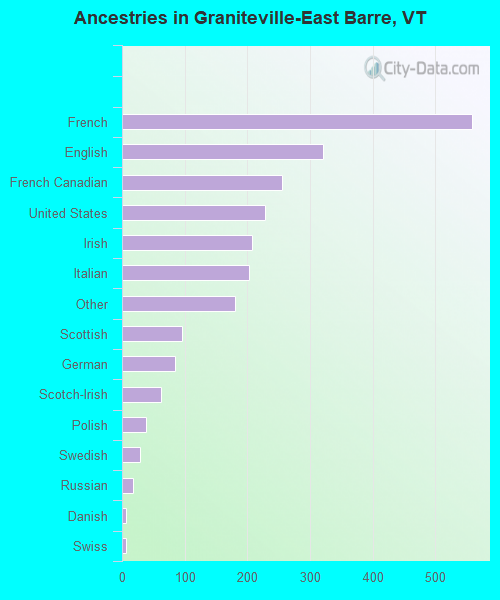
Ancestries in Graniteville-East Barre

- 55824.3%French
- 32114.0%English
- 25611.1%French Canadian
- 2289.9%United States
- 2079.0%Irish
- 2028.8%Italian
- 1807.8%Other
- 964.2%Scottish
- 843.7%German
- 632.7%Scotch-Irish
- 391.7%Polish
- 281.2%Swedish
- 170.7%Russian
- 60.3%Danish
- 60.3%Swiss
- 50.2%Portuguese
Zip codes: 05678.