Races in Gulfport, Mississippi (MS) Detailed Stats
Data:
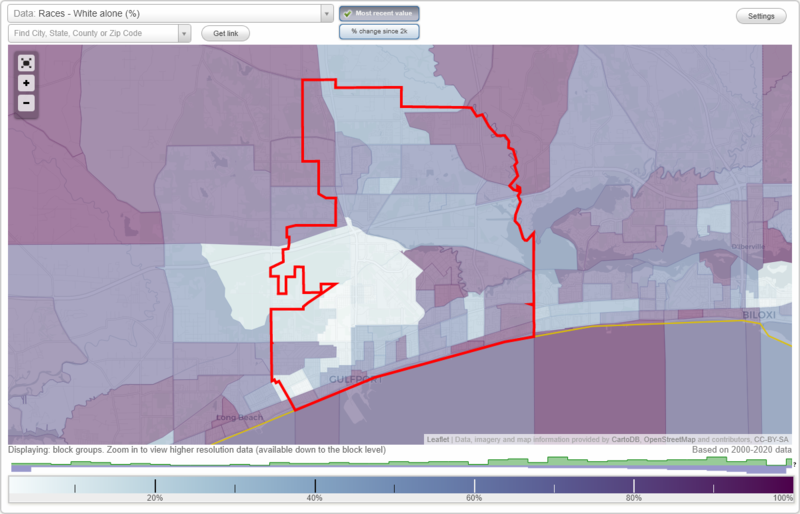
Races - White alone (%)
Races - White alone (% change since 2000)
Races - Black alone (%)
Races - Black alone (% change since 2000)
Races - American Indian alone (%)
Races - American Indian alone (% change since 2000)
Races - Asian alone (%)
Races - Asian alone (% change since 2000)
Races - Hispanic (%)
Races - Hispanic (% change since 2000)
Races - Native Hawaiian and Other Pacific Islander alone (%)
Races - Native Hawaiian and Other Pacific Islander alone (% change since 2000)
Races - Two or more races(%)
Races - Two or more races(% change since 2000)
Races - Other race alone (%)
Races - Other race alone (% change since 2000)
Racial diversity
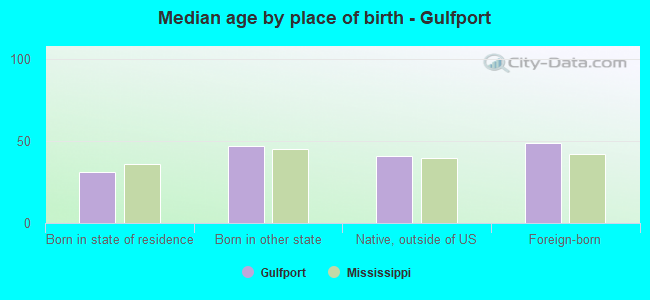
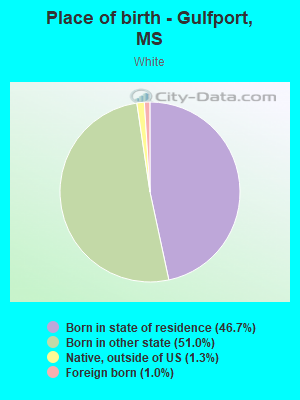
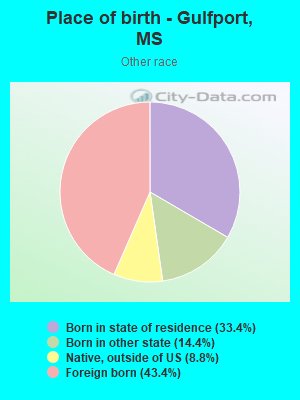
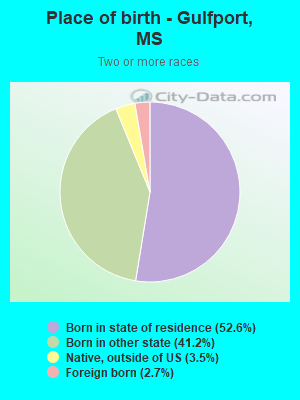
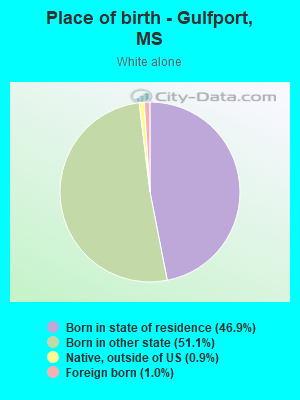
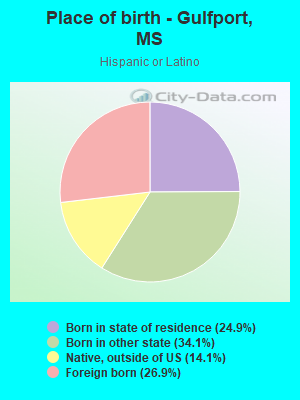
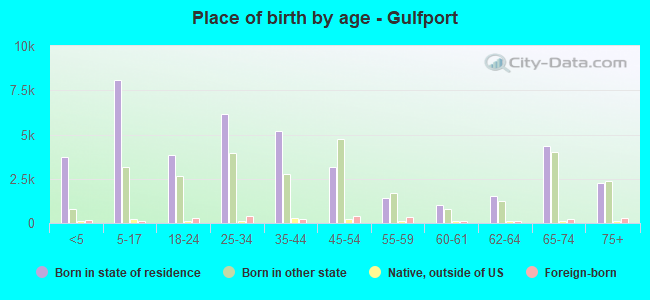
Place of birth - Born in state of residence (%)
Place of birth - Born in state of residence (%) - White
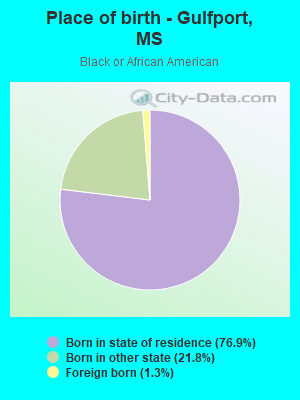
Place of birth - Born in state of residence (%) - Black or African American
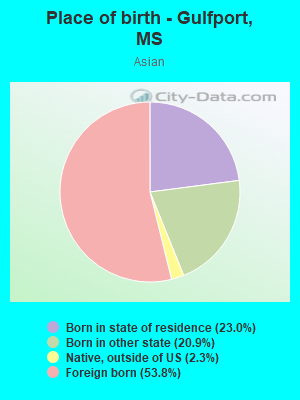
Place of birth - Born in state of residence (%) - Asian
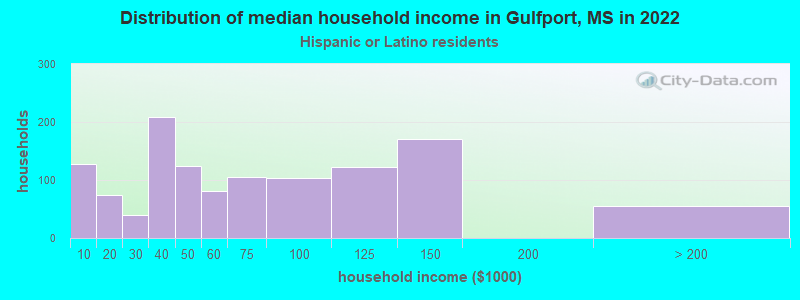
Place of birth - Born in state of residence (%) - Hispanic or Latino
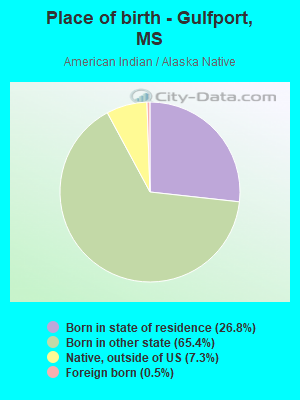
Place of birth - Born in state of residence (%) - American Indian and Alaska Native
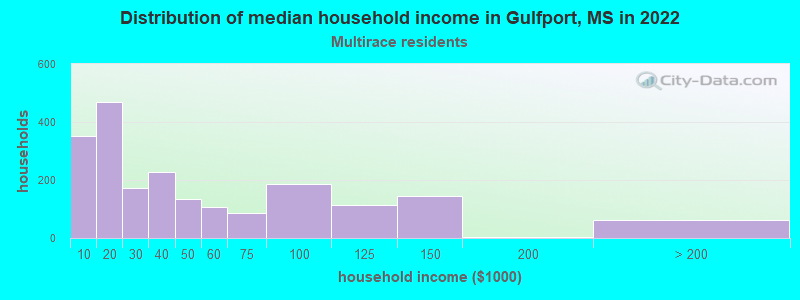
Place of birth - Born in state of residence (%) - Multirace
Place of birth - Born in state of residence (%) - Other Race
Place of birth - Born in other state (%)
Place of birth - Born in other state (%) - White
Place of birth - Born in other state (%) - Black or African American
Place of birth - Born in other state (%) - Asian
Place of birth - Born in other state (%) - Hispanic or Latino
Place of birth - Born in other state (%) - American Indian and Alaska Native
Place of birth - Born in other state (%) - Multirace
Place of birth - Born in other state (%) - Other Race
Place of birth - Native, outside of US (%)
Place of birth - Native, outside of US (%) - White
Place of birth - Native, outside of US (%) - Black or African American
Place of birth - Native, outside of US (%) - Asian
Place of birth - Native, outside of US (%) - Hispanic or Latino
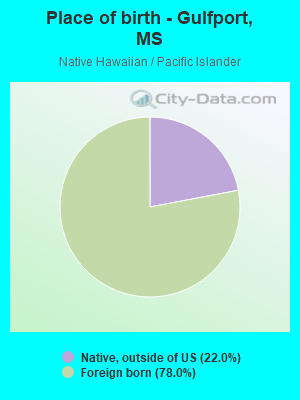
Place of birth - Native, outside of US (%) - American Indian and Alaska Native
Place of birth - Native, outside of US (%) - Multirace
Place of birth - Native, outside of US (%) - Other Race
Place of birth - Foreign born (%)
Place of birth - Foreign born (%) - White
Place of birth - Foreign born (%) - Black or African American
Place of birth - Foreign born (%) - Asian
Place of birth - Foreign born (%) - Hispanic or Latino
Place of birth - Foreign born (%) - American Indian and Alaska Native
Place of birth - Foreign born (%) - Multirace
Place of birth - Foreign born (%) - Other Race
Residents speaking English at home (%)
Residents speaking English at home - Born in the United States (%)
Residents speaking English at home - Native, born elsewhere (%)
Residents speaking English at home - Foreign born (%)
Residents speaking Spanish at home (%)
Residents speaking Spanish at home - Born in the United States (%)
Residents speaking Spanish at home - Native, born elsewhere (%)
Residents speaking Spanish at home - Foreign born (%)
Residents speaking other language at home (%)
Residents speaking other language at home - Born in the United States (%)
Residents speaking other language at home - Native, born elsewhere (%)
Residents speaking other language at home - Foreign born (%)
Marital status - Never married (%)
Marital status - Now married (%)
Marital status - Separated (%)
Marital status - Widowed (%)
Marital status - Divorced (%)
Ancestries Reported - Arab (%)
Ancestries Reported - Czech (%)
Ancestries Reported - Danish (%)
Ancestries Reported - Dutch (%)
Ancestries Reported - English (%)
Ancestries Reported - French (%)
Ancestries Reported - French Canadian (%)
Ancestries Reported - German (%)
Ancestries Reported - Greek (%)
Ancestries Reported - Hungarian (%)
Ancestries Reported - Irish (%)
Ancestries Reported - Italian (%)
Ancestries Reported - Lithuanian (%)
Ancestries Reported - Norwegian (%)
Ancestries Reported - Polish (%)
Ancestries Reported - Portuguese (%)
Ancestries Reported - Russian (%)
Ancestries Reported - Scotch-Irish (%)
Ancestries Reported - Scottish (%)
Ancestries Reported - Slovak (%)
Ancestries Reported - Subsaharan African (%)
Ancestries Reported - Swedish (%)
Ancestries Reported - Swiss (%)
Ancestries Reported - Ukrainian (%)
Ancestries Reported - United States (%)
Ancestries Reported - Welsh (%)
Ancestries Reported - West Indian (%)
Ancestries Reported - Other (%)
Geographical mobility - Same house 1 year ago (%)
Geographical mobility - Same house 1 year ago (%) - White
Geographical mobility - Same house 1 year ago (%) - Black or African American
Geographical mobility - Same house 1 year ago (%) - Asian
Geographical mobility - Same house 1 year ago (%) - Hispanic or Latino
Geographical mobility - Same house 1 year ago (%) - American Indian and Alaska Native
Geographical mobility - Same house 1 year ago (%) - Multirace
Geographical mobility - Same house 1 year ago (%) - Other Race
Geographical mobility - Moved within same county (%)
Geographical mobility - Moved within same county (%) - White
Geographical mobility - Moved within same county (%) - Black or African American
Geographical mobility - Moved within same county (%) - Asian
Geographical mobility - Moved within same county (%) - Hispanic or Latino
Geographical mobility - Moved within same county (%) - American Indian and Alaska Native
Geographical mobility - Moved within same county (%) - Multirace
Geographical mobility - Moved within same county (%) - Other Race
Geographical mobility - Moved from different county within same state (%)
Geographical mobility - Moved from different county within same state (%) - White
Geographical mobility - Moved from different county within same state (%) - Black or African American
Geographical mobility - Moved from different county within same state (%) - Asian
Geographical mobility - Moved from different county within same state (%) - Hispanic or Latino
Geographical mobility - Moved from different county within same state (%) - American Indian and Alaska Native
Geographical mobility - Moved from different county within same state (%) - Multirace
Geographical mobility - Moved from different county within same state (%) - Other Race
Geographical mobility - Moved from different state (%)
Geographical mobility - Moved from different state (%) - White
Geographical mobility - Moved from different state (%) - Black or African American
Geographical mobility - Moved from different state (%) - Asian
Geographical mobility - Moved from different state (%) - Hispanic or Latino
Geographical mobility - Moved from different state (%) - American Indian and Alaska Native
Geographical mobility - Moved from different state (%) - Multirace
Geographical mobility - Moved from different state (%) - Other Race
Geographical mobility - Moved from abroad (%)
Geographical mobility - Moved from abroad (%) - White
Geographical mobility - Moved from abroad (%) - Black or African American
Geographical mobility - Moved from abroad (%) - Asian
Geographical mobility - Moved from abroad (%) - Hispanic or Latino
Geographical mobility - Moved from abroad (%) - American Indian and Alaska Native
Geographical mobility - Moved from abroad (%) - Multirace
Geographical mobility - Moved from abroad (%) - Other Race
Place of birth for the foreign-born population - Ireland (%)
Place of birth for the foreign-born population - Denmark (%)
Place of birth for the foreign-born population - Norway (%)
Place of birth for the foreign-born population - Sweden (%)
Place of birth for the foreign-born population - United Kingdom (%)
Place of birth for the foreign-born population - England (%)
Place of birth for the foreign-born population - Scotland (%)
Place of birth for the foreign-born population - Other Northern Europe (%)
Place of birth for the foreign-born population - Austria (%)
Place of birth for the foreign-born population - Belgium (%)
Place of birth for the foreign-born population - France (%)
Place of birth for the foreign-born population - Germany (%)
Place of birth for the foreign-born population - Netherlands (%)
Place of birth for the foreign-born population - Switzerland (%)
Place of birth for the foreign-born population - Other Western Europe (%)
Place of birth for the foreign-born population - Greece (%)
Place of birth for the foreign-born population - Italy (%)
Place of birth for the foreign-born population - Portugal (%)
Place of birth for the foreign-born population - Spain (%)
Place of birth for the foreign-born population - Other Southern Europe (%)
Place of birth for the foreign-born population - Albania (%)
Place of birth for the foreign-born population - Belarus (%)
Place of birth for the foreign-born population - Bosnia and Herzegovina (%)
Place of birth for the foreign-born population - Bulgaria (%)
Place of birth for the foreign-born population - Croatia (%)
Place of birth for the foreign-born population - Czechoslovakia (%)
Place of birth for the foreign-born population - Hungary (%)
Place of birth for the foreign-born population - Latvia (%)
Place of birth for the foreign-born population - Lithuania (%)
Place of birth for the foreign-born population - North Macedonia (Macedonia) (%)
Place of birth for the foreign-born population - Moldova (%)
Place of birth for the foreign-born population - Poland (%)
Place of birth for the foreign-born population - Romania (%)
Place of birth for the foreign-born population - Russia (%)
Place of birth for the foreign-born population - Serbia (%)
Place of birth for the foreign-born population - Ukraine (%)
Place of birth for the foreign-born population - Other Eastern Europe (%)
Place of birth for the foreign-born population - China (%)
Place of birth for the foreign-born population - Hong Kong (%)
Place of birth for the foreign-born population - Taiwan (%)
Place of birth for the foreign-born population - Japan (%)
Place of birth for the foreign-born population - Korea (%)
Place of birth for the foreign-born population - Other Eastern Asia (%)
Place of birth for the foreign-born population - Afghanistan (%)
Place of birth for the foreign-born population - Bangladesh (%)
Place of birth for the foreign-born population - India (%)
Place of birth for the foreign-born population - Iran (%)
Place of birth for the foreign-born population - Kazakhstan (%)
Place of birth for the foreign-born population - Nepal (%)
Place of birth for the foreign-born population - Pakistan (%)
Place of birth for the foreign-born population - Sri Lanka (%)
Place of birth for the foreign-born population - Uzbekistan (%)
Place of birth for the foreign-born population - Other South Central Asia (%)
Place of birth for the foreign-born population - Burma (%)
Place of birth for the foreign-born population - Cambodia (%)
Place of birth for the foreign-born population - Indonesia (%)
Place of birth for the foreign-born population - Laos (%)
Place of birth for the foreign-born population - Malaysia (%)
Place of birth for the foreign-born population - Philippines (%)
Place of birth for the foreign-born population - Singapore (%)
Place of birth for the foreign-born population - Thailand (%)
Place of birth for the foreign-born population - Vietnam (%)
Place of birth for the foreign-born population - Other South Eastern Asia (%)
Place of birth for the foreign-born population - Armenia (%)
Place of birth for the foreign-born population - Iraq (%)
Place of birth for the foreign-born population - Israel (%)
Place of birth for the foreign-born population - Jordan (%)
Place of birth for the foreign-born population - Kuwait (%)
Place of birth for the foreign-born population - Lebanon (%)
Place of birth for the foreign-born population - Saudi Arabia (%)
Place of birth for the foreign-born population - Syria (%)
Place of birth for the foreign-born population - Turkey (%)
Place of birth for the foreign-born population - Yemen (%)
Place of birth for the foreign-born population - Other Western Asia (%)
Place of birth for the foreign-born population - Eritrea (%)
Place of birth for the foreign-born population - Ethiopia (%)
Place of birth for the foreign-born population - Kenya (%)
Place of birth for the foreign-born population - Somalia (%)
Place of birth for the foreign-born population - Uganda (%)
Place of birth for the foreign-born population - Zimbabwe (%)
Place of birth for the foreign-born population - Other Eastern Africa (%)
Place of birth for the foreign-born population - Cameroon (%)
Place of birth for the foreign-born population - Congo (%)
Place of birth for the foreign-born population - Democratic Republic of Congo (Zaire) (%)
Place of birth for the foreign-born population - Other Middle Africa (%)
Place of birth for the foreign-born population - Egypt (%)
Place of birth for the foreign-born population - Morocco (%)
Place of birth for the foreign-born population - Sudan (%)
Place of birth for the foreign-born population - Other Northern Africa (%)
Place of birth for the foreign-born population - South Africa (%)
Place of birth for the foreign-born population - Other Southern Africa (%)
Place of birth for the foreign-born population - Cabo Verde (%)
Place of birth for the foreign-born population - Ghana (%)
Place of birth for the foreign-born population - Liberia (%)
Place of birth for the foreign-born population - Nigeria (%)
Place of birth for the foreign-born population - Senegal (%)
Place of birth for the foreign-born population - Sierra Leone (%)
Place of birth for the foreign-born population - Other Western Africa (%)
Place of birth for the foreign-born population - Australia (%)
Place of birth for the foreign-born population - New Zealand (%)
Place of birth for the foreign-born population - Fiji (%)
Place of birth for the foreign-born population - Micronesia (%)
Place of birth for the foreign-born population - Bahamas (%)
Place of birth for the foreign-born population - Barbados (%)
Place of birth for the foreign-born population - Cuba (%)
Place of birth for the foreign-born population - Dominica (%)
Place of birth for the foreign-born population - Dominican Republic (%)
Place of birth for the foreign-born population - Grenada (%)
Place of birth for the foreign-born population - Haiti (%)
Place of birth for the foreign-born population - Jamaica (%)
Place of birth for the foreign-born population - St. Vincent and the Grenadines (%)
Place of birth for the foreign-born population - Trinidad and Tobago (%)
Place of birth for the foreign-born population - West Indies (%)
Place of birth for the foreign-born population - Other Caribbean (%)
Place of birth for the foreign-born population - Belize (%)
Place of birth for the foreign-born population - Costa Rica (%)
Place of birth for the foreign-born population - El Salvador (%)
Place of birth for the foreign-born population - Guatemala (%)
Place of birth for the foreign-born population - Honduras (%)
Place of birth for the foreign-born population - Mexico (%)
Place of birth for the foreign-born population - Nicaragua (%)
Place of birth for the foreign-born population - Panama (%)
Place of birth for the foreign-born population - Other Central America (%)
Place of birth for the foreign-born population - Argentina (%)
Place of birth for the foreign-born population - Bolivia (%)
Place of birth for the foreign-born population - Brazil (%)
Place of birth for the foreign-born population - Chile (%)
Place of birth for the foreign-born population - Colombia (%)
Place of birth for the foreign-born population - Ecuador (%)
Place of birth for the foreign-born population - Guyana (%)
Place of birth for the foreign-born population - Peru (%)
Place of birth for the foreign-born population - Uruguay (%)
Place of birth for the foreign-born population - Venezuela (%)
Place of birth for the foreign-born population - Other South America (%)
Place of birth for the foreign-born population - Canada (%)
Place of birth for the foreign-born population - Other Northern America (%)
Place of birth for the foreign-born population - Other (%)
Latest news about races in Gulfport, MS collected exclusively by city-data.com from local newspapers, TV, and radio stations
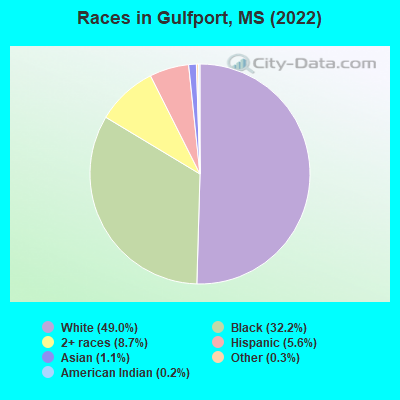
According to 2022 data, the most numerous races in Gulfport, MS are White alone (35,956 residents), Black alone (23,582 residents), and Hispanic (4,114 residents). 93.2% of Gulfport residents speak English at home. 3.7% of Gulfport, MS residents are foreign-born (2.3% born in Latin America, 0.8% born in Asia), which is 45.9% greater than the foreign-born rate of 2.0% across the entire state of Mississippi.
Race distribution in Gulfport
2000 2022
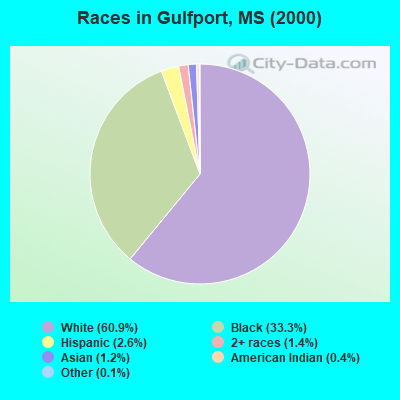
1,727,908 60.7% White alone 1,028,473 36.2% Black alone 39,569 1.4% Hispanic 17,272 0.6% Two or more races 18,349 0.6% Asian alone 11,224 0.4% American Indian alone 1,294 0.05% Other race alone 569 0.02% Native Hawaiian and Other
1,625,979 55.3% White alone 1,072,962 36.5% Black alone 97,177 3.3% Hispanic 96,367 3.3% Two or more races 25,217 0.9% Asian alone 12,457 0.4% American Indian alone 9,501 0.3% Other race alone 397 0.01% Native Hawaiian and Other
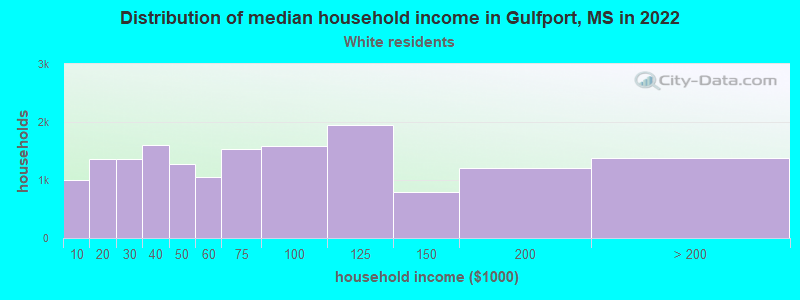
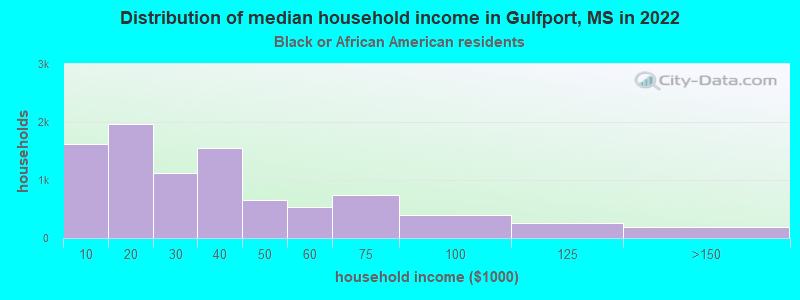
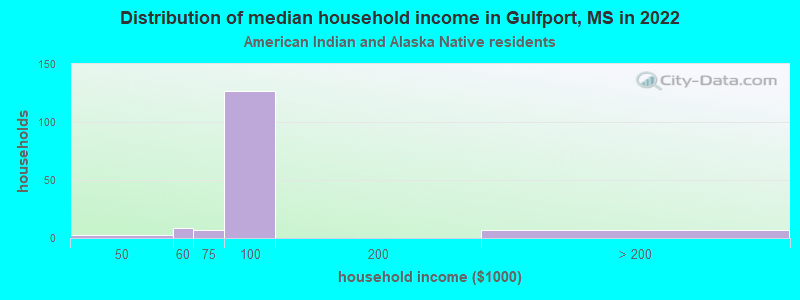
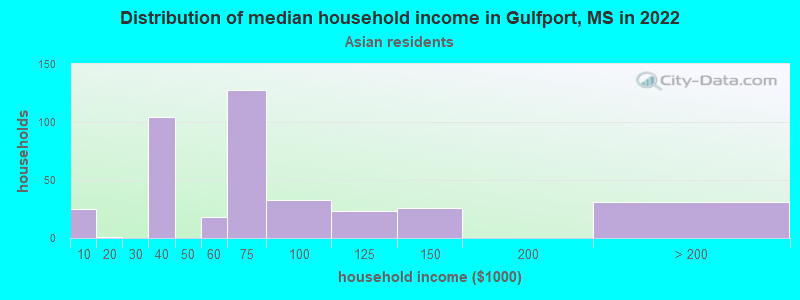
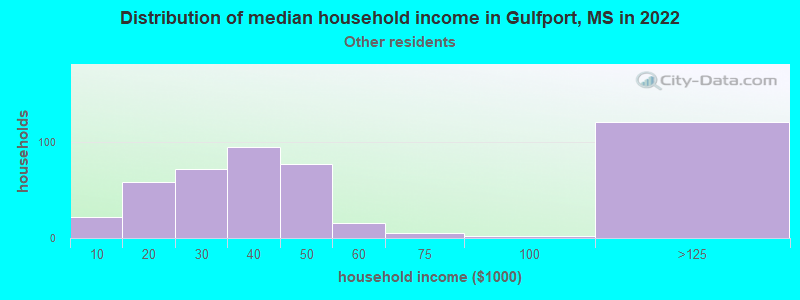
Income and house value in Gulfport Median household income in 2022 $61,460 White non-Hispanic householders$25,954 Black householders$76,264 American Indian and Alaska Native householders$53,386 Asian householders$30,518 Some other race householders$36,415 Two or more races householders$43,538 Hispanic or Latino race householdersMedian 2022 house value $190,325 White Non-Hispanic householders$141,359 Black or African American householders$116,322 American Indian or Alaska Native householders $195,199 Asian householders$130,724 Some other race householders$207,385 Two or more races householders$175,037 Hispanic or Latino householders
Median age by race in Gulfport
44.8 Median age for White residents44.2 46.1 33.8 Median age for Black or African American residents28.9 37.9 32.5 Median age for American Indian / Alaska Native residents-666,666,666.0 32.5 35.8 Median age for Asian residents30.3 44.3 -666,666,666.0 Median age for Native Hawaiian / Pacific Islander residents-666,666,666.0 -666,666,666.0 22.1 Median age for Other race residents28.3 20.0 26.6 Median age for Two or more races residents26.6 26.5 44.8 Median age for White alone residents44.3 46.0 28.4 Median age for Hispanic or Latino residents28.5 28.2
Owner/renter occupied households by race in Gulfport
House owners and renters - White residents 11,187 69.4% Owner occupied4,922 30.6% Renter occupiedHouse owners and renters - Black or African American residents 3,712 41.2% Owner occupied5,296 58.8% Renter occupiedHouse owners and renters - American Indian / Alaska Native residents 119 93.6% Owner occupied8 6.4% Renter occupiedHouse owners and renters - Asian residents 212 52.5% Owner occupied192 47.5% Renter occupiedHouse owners and renters - Native Hawaiian / Pacific Islander residents 5 100.0% Owner occupiedHouse owners and renters - Other race residents 152 28.0% Owner occupied391 72.0% Renter occupiedHouse owners and renters - Two or more races residents 1,309 49.9% Owner occupied1,316 50.1% Renter occupiedHouse owners and renters - White alone residents 11,135 70.6% Owner occupied4,648 29.4% Renter occupiedHouse owners and renters - Hispanic or Latino residents 443 42.2% Owner occupied608 57.8% Renter occupied
Language usage in Gulfport
English speakers - Total 93.2% of residents of Gulfport speak English at home.
3.1% of residents speak Spanish at home 1,288 60.4% Speak English very well844 39.6% Speak English less than very well3.5% of residents speak other language at home 1,905 79.7% Speak English very well485 20.3% Speak English less than very well
English speakers - Born in the United States 92.5% of residents of Gulfport speak English at home.
2.6% of residents speak Spanish at home 646 91.1% Speak English very well63 8.9% Speak English less than very well3.0% of residents speak other language at home 736 89.8% Speak English very well84 10.2% Speak English less than very well
English speakers - Native, born elsewhere 59.7% of residents of Gulfport speak English at home.
40.9% of residents speak Spanish at home 138 39.9% Speak English very well208 60.1% Speak English less than very well6.0% of residents speak other language at home 51 100.0% Speak English very well
English speakers - Foreign-born 28.4% of residents of Gulfport speak English at home.
39.1% of residents speak Spanish at home 317 41.1% Speak English very well455 58.9% Speak English less than very well30.9% of residents speak other language at home 384 63.0% Speak English very well226 37.0% Speak English less than very well
White (Caucasian) - Speak only English Native:
97.3% (33,891)Foreign-born:
35.8% (194)
White (Caucasian) - Speak another language Native:
2.6% (896)Foreign-born:
58.3% (316)
Black or African American - Speak only English Native:
98.9% (21,683)Foreign-born:
62.6% (195)
Black or African American - Speak another language Native:
0.8% (176)Foreign-born:
97.9% (305)
American Indian / Alaska Native - Speak another language Native:
51.4% (70)Foreign-born:
100.0% (1)
Asian - Speak only English Native:
41.9% (111)Foreign-born:
24.3% (114)
Asian - Speak another language Native:
57.7% (153)Foreign-born:
74.0% (349)
Native Hawaiian / Pacific Islander - Speak another language Native:
52.5% (16)Foreign-born:
100.0% (102)
Other race - Speak another language Native:
65.6% (454)Foreign-born:
100.0% (749)
Two or more races - Speak only English Native:
85.0% (5,924)Foreign-born:
40.8% (25)
Two or more races - Speak another language Native:
9.9% (692)Foreign-born:
62.7% (38)
White alone - Speak only English Native:
97.9% (33,436)Foreign-born:
61.8% (171)
White alone - Speak another language Native:
2.0% (687)Foreign-born:
39.5% (109)
Hispanic or Latino - Speak only English Native:
53.7% (1,097)Foreign-born:
3.1% (24)
Hispanic or Latino - Speak another language Native:
46.3% (945)Foreign-born:
96.9% (749)
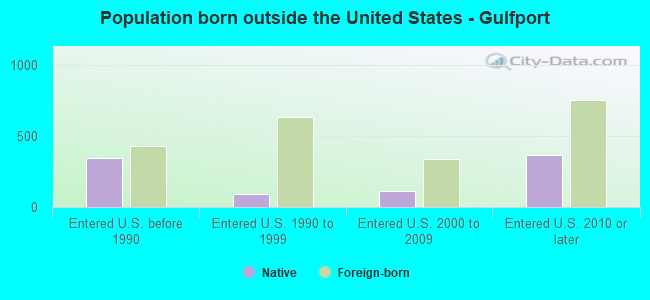
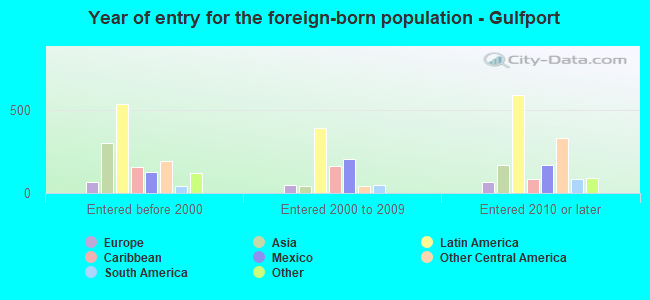
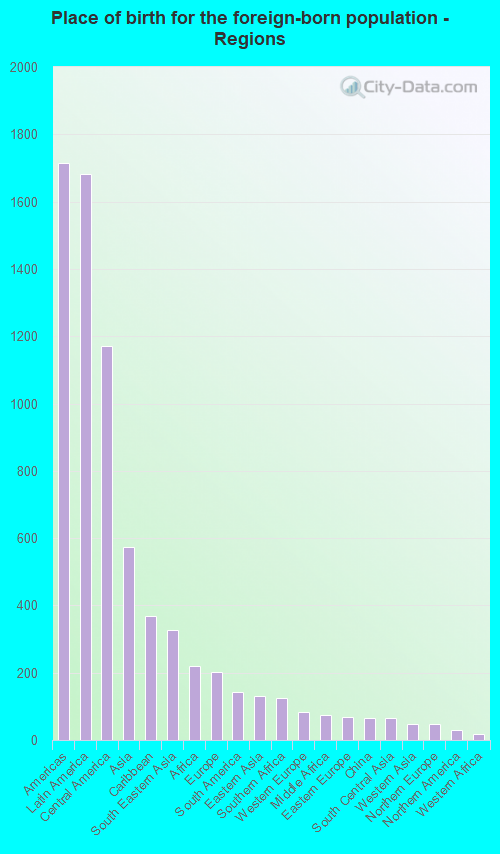
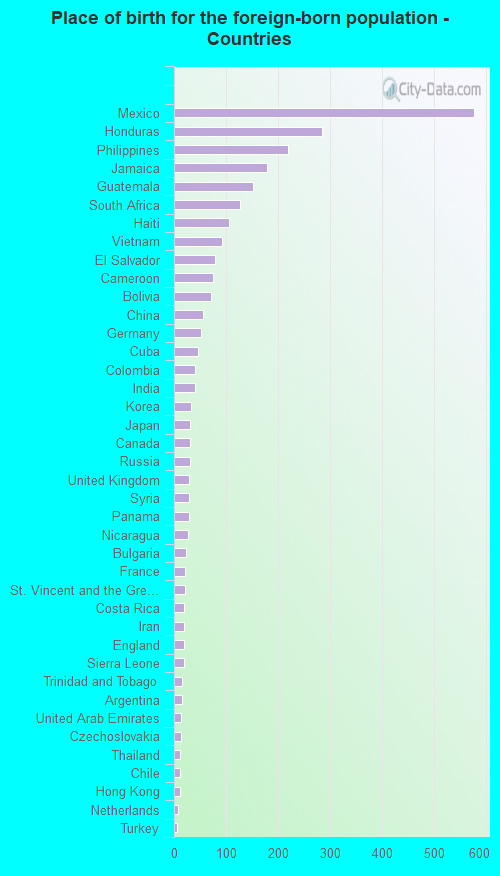
Foreign-born residents in Gulfport 2,713 residents are foreign born (2.3% Latin America , 0.8% Asia ).
This city:
3.7%Mississippi:
2.3%
Marital status for residents in Gulfport Marital status - White (Caucasian) population 15 years and over
Males 28.9% Never married46.0% Now married2.1% Separated5.0% Widowed18.0% DivorcedFemales 25.3% Never married47.1% Now married0.6% Separated12.6% Widowed14.4% DivorcedWomen who gave birth in the past 12 months Now married:
23.1% (39)Unmarried:
76.9% (130)
Women who did not give birth in the past 12 months Now married:
42.8% (3,162)Unmarried:
57.2% (4,219)
Marital status - Black or African American population 15 years and over
Males 51.6% Never married19.3% Now married1.3% Separated4.3% Widowed23.6% DivorcedFemales 52.1% Never married13.5% Now married5.1% Separated13.6% Widowed15.7% DivorcedWomen who gave birth in the past 12 months Now married:
29.1% (37)Unmarried:
70.9% (90)
Women who did not give birth in the past 12 months Now married:
10.6% (679)Unmarried:
89.4% (5,726)
Marital status - American Indian / Alaska Native population 15 years and over
Males 5.4% Never married18.9% Now married0.0% Separated48.6% Widowed27.0% DivorcedFemales 0.0% Never married78.0% Now married0.0% Separated1.2% Widowed20.7% DivorcedWomen who did not give birth in the past 12 months Now married:
84.1% (54)Unmarried:
15.9% (10)
Marital status - Asian population 15 years and over
Males 48.6% Never married41.8% Now married0.0% Separated7.6% Widowed2.0% DivorcedFemales 9.5% Never married65.0% Now married0.0% Separated5.4% Widowed20.0% DivorcedWomen who gave birth in the past 12 months Now married:
100.0% (9)Unmarried:
0.0% (0)
Women who did not give birth in the past 12 months Now married:
57.1% (173)Unmarried:
42.9% (130)
Marital status - Native Hawaiian / Pacific Islander population 15 years and over
Males 0.0% Never married100.0% Now married0.0% Separated0.0% Widowed0.0% DivorcedFemales 63.6% Never married36.4% Now married0.0% Separated0.0% Widowed0.0% DivorcedWomen who did not give birth in the past 12 months Now married:
0.0% (0)Unmarried:
100.0% (7)
Marital status - Other race population 15 years and over
Males 46.1% Never married35.0% Now married9.7% Separated0.0% Widowed9.2% DivorcedFemales 39.0% Never married47.7% Now married0.0% Separated0.8% Widowed12.5% DivorcedWomen who gave birth in the past 12 months Now married:
0.0% (0)Unmarried:
100.0% (39)
Women who did not give birth in the past 12 months Now married:
26.8% (109)Unmarried:
73.2% (298)
Marital status - Two or more races population 15 years and over
Males 61.5% Never married29.6% Now married2.3% Separated0.0% Widowed6.5% DivorcedFemales 48.0% Never married25.5% Now married1.6% Separated12.0% Widowed12.9% DivorcedWomen who gave birth in the past 12 months Now married:
42.9% (6)Unmarried:
57.1% (8)
Women who did not give birth in the past 12 months Now married:
22.3% (337)Unmarried:
77.7% (1,173)
Marital status - White alone, not Hispanic / Latino population 15 years and over
Males 29.0% Never married46.7% Now married1.8% Separated5.1% Widowed17.5% DivorcedFemales 25.5% Never married47.6% Now married0.6% Separated11.6% Widowed14.7% DivorcedWomen who gave birth in the past 12 months Now married:
23.1% (39)Unmarried:
76.9% (130)
Women who did not give birth in the past 12 months Now married:
42.5% (3,085)Unmarried:
57.5% (4,172)
Marital status - Hispanic or Latino population 15 years and over
Males 38.5% Never married46.1% Now married4.3% Separated0.0% Widowed11.2% DivorcedFemales 39.8% Never married35.4% Now married2.7% Separated14.6% Widowed7.5% DivorcedWomen who gave birth in the past 12 months Now married:
8.1% (3)Unmarried:
91.9% (36)
Women who did not give birth in the past 12 months Now married:
30.1% (257)Unmarried:
69.9% (598)
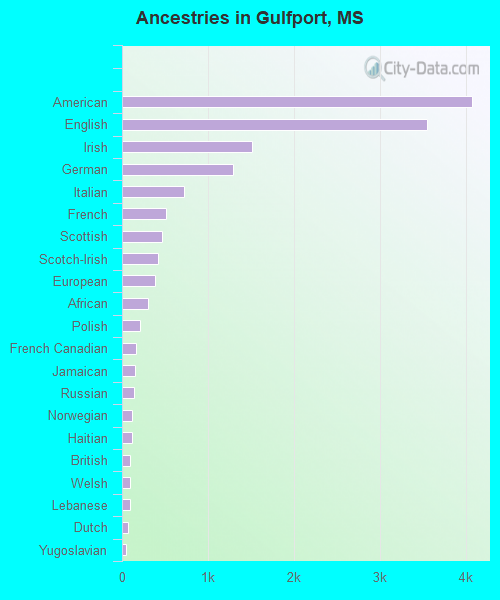
Ancestries in Gulfport
4,069 10.2% American3,553 8.9% English1,509 3.8% Irish1,298 3.3% German722 1.8% Italian507 1.3% French460 1.2% Scottish415 1.0% Scotch-Irish382 1.0% European299 0.7% African212 0.5% Polish166 0.4% French Canadian155 0.4% Jamaican141 0.4% Russian118 0.3% Norwegian111 0.3% Haitian94 0.2% British93 0.2% Welsh90 0.2% Lebanese67 0.2% Dutch46 0.1% Yugoslavian36 0.09% Cape Verdean26 0.07% Czech21 0.05% Iranian20 0.05% Cajun18 0.05% Barbadian17 0.04% Greek17 0.04% Croatian17 0.04% South African13 0.03% Bulgarian13 0.03% West Indian12 0.03% Danish12 0.03% Slavic10 0.03% Palestinian10 0.03% Belgian9 0.02% Syrian9 0.02% Nigerian7 0.02% Austrian6 0.02% Hungarian6 0.02% Slovene6 0.02% Turkish3 0.01% Northern European3 0.01% Swedish
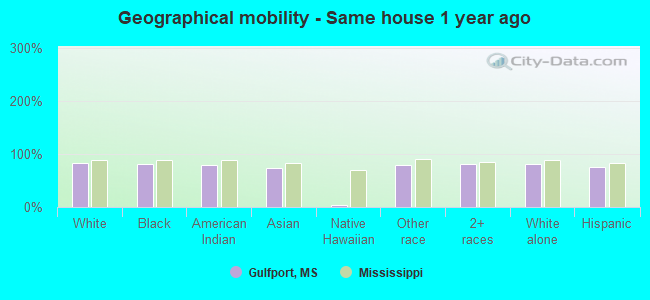
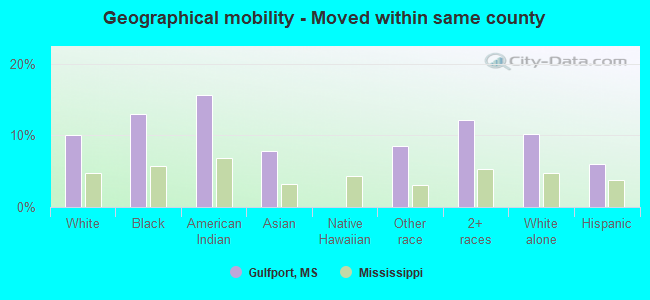
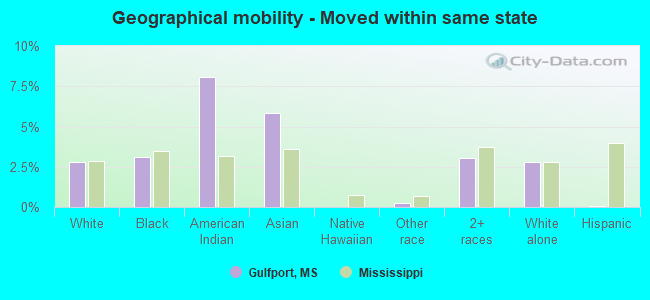
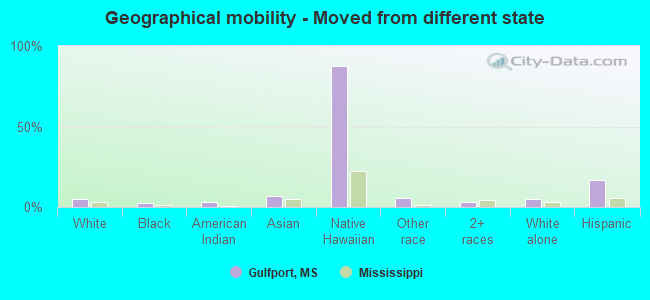
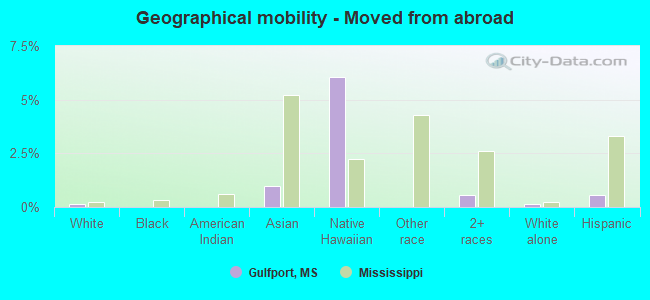
Geographical mobility in Gulfport Same house 1 year ago 30,525 82.1% White (Caucasian)19,141 81.4% Black or African American104 78.9% American Indian / Alaska Native647 72.9% Asian4 3.2% Native Hawaiian / Pacific Islander1,202 79.5% Other race6,227 80.8% Two or more races29,925 81.9% White alone, not Hispanic / Latino2,841 74.8% Hispanic or LatinoMoved within same county 3,739 10.1% White / Caucasian3,045 13.0% Black or African American21 15.6% American Indian / Alaska Native70 7.8% Asian129 8.5% Other race933 12.1% Two or more races3,739 10.2% White alone, not Hispanic / Latino226 5.9% Hispanic or LatinoMoved within same state 1,028 2.8% White / Caucasian728 3.1% Black or African American11 8.0% American Indian / Alaska Native52 5.9% Asian4 0.2% Other race236 3.1% Two or more races1,028 2.8% White alone, not Hispanic / Latino3 0.1% Hispanic or LatinoMoved from different state 1,831 4.9% White / Caucasian599 2.5% Black or African American4 3.1% American Indian / Alaska Native59 6.6% Asian119 87.7% Native Hawaiian / Pacific Islander89 5.9% Other race263 3.4% Two or more races1,784 4.9% White alone, not Hispanic / Latino629 16.6% Hispanic or LatinoMoved from abroad 44 0.1% White9 1.0% Asian8 6.1% Native Hawaiian / Pacific Islander43 0.6% Two or more races44 0.1% White alone, not Hispanic / Latino22 0.6% Hispanic or Latino
Children Nativity (place of birth) in Gulfport
Children under 6 years - Living with two parents Both parents native 1,853 100.0% NativeBoth parents foreign-born 57 68.5% Native26 31.5% Foreign-bornOne native, one foreign-born parent 162 100.0% NativeChildren under 6 years - Living with one parent Native parent 2,287 100.0% NativeForeign-born parent 461 87.9% Native63 12.1% Foreign-bornChildren 6 to 17 years - Living with two parents Both parents native 3,427 100.0% NativeBoth parents foreign-born 26 52.5% Native23 47.5% Foreign-bornOne native, one foreign-born parent 360 97.3% Native10 2.7% Foreign-bornChildren 6 to 17 years - Living with one parent Native parent 5,871 100.0% NativeForeign-born parent 49 67.2% Native24 32.8% Foreign-born
Grandparents responsible for own grandchildren in Gulfport
Grandparents (30 to 59 years) White / Caucasian 79 38.7% Responsible for grandchildren126 61.3% Not responsible for grandchildrenBlack or African American 274 54.9% Responsible for grandchildren226 45.1% Not responsible for grandchildrenTwo or more races 4 100.0% Responsible for grandchildrenWhite alone, not Hispanic / Latino 80 39.6% Responsible for grandchildren122 60.4% Not responsible for grandchildrenHispanic or Latino 6 100.0% Not responsible for grandchildrenGrandparents (60 years and over) White / Caucasian 85 27.5% Responsible for grandchildren225 72.5% Not responsible for grandchildrenBlack or African American 111 40.1% Responsible for grandchildren165 59.9% Not responsible for grandchildrenTwo or more races 5 7.9% Responsible for grandchildren59 92.1% Not responsible for grandchildrenWhite alone, not Hispanic / Latino 85 28.8% Responsible for grandchildren211 71.2% Not responsible for grandchildrenHispanic or Latino 16 100.0% Not responsible for grandchildren