Races in Hanover Park, Illinois (IL) Detailed Stats
Data:
Races - White alone (%)
Races - White alone (% change since 2000)
Races - Black alone (%)
Races - Black alone (% change since 2000)
Races - American Indian alone (%)
Races - American Indian alone (% change since 2000)
Races - Asian alone (%)
Races - Asian alone (% change since 2000)
Races - Hispanic (%)
Races - Hispanic (% change since 2000)
Races - Native Hawaiian and Other Pacific Islander alone (%)
Races - Native Hawaiian and Other Pacific Islander alone (% change since 2000)
Races - Two or more races(%)
Races - Two or more races(% change since 2000)
Races - Other race alone (%)
Races - Other race alone (% change since 2000)
Racial diversity
Place of birth - Born in state of residence (%)
Place of birth - Born in state of residence (%) - White
Place of birth - Born in state of residence (%) - Black or African American
Place of birth - Born in state of residence (%) - Asian
Place of birth - Born in state of residence (%) - Hispanic or Latino
Place of birth - Born in state of residence (%) - American Indian and Alaska Native
Place of birth - Born in state of residence (%) - Multirace
Place of birth - Born in state of residence (%) - Other Race
Place of birth - Born in other state (%)
Place of birth - Born in other state (%) - White
Place of birth - Born in other state (%) - Black or African American
Place of birth - Born in other state (%) - Asian
Place of birth - Born in other state (%) - Hispanic or Latino
Place of birth - Born in other state (%) - American Indian and Alaska Native
Place of birth - Born in other state (%) - Multirace
Place of birth - Born in other state (%) - Other Race
Place of birth - Native, outside of US (%)
Place of birth - Native, outside of US (%) - White
Place of birth - Native, outside of US (%) - Black or African American
Place of birth - Native, outside of US (%) - Asian
Place of birth - Native, outside of US (%) - Hispanic or Latino
Place of birth - Native, outside of US (%) - American Indian and Alaska Native
Place of birth - Native, outside of US (%) - Multirace
Place of birth - Native, outside of US (%) - Other Race
Place of birth - Foreign born (%)
Place of birth - Foreign born (%) - White
Place of birth - Foreign born (%) - Black or African American
Place of birth - Foreign born (%) - Asian
Place of birth - Foreign born (%) - Hispanic or Latino
Place of birth - Foreign born (%) - American Indian and Alaska Native
Place of birth - Foreign born (%) - Multirace
Place of birth - Foreign born (%) - Other Race
Residents speaking English at home (%)
Residents speaking English at home - Born in the United States (%)
Residents speaking English at home - Native, born elsewhere (%)
Residents speaking English at home - Foreign born (%)
Residents speaking Spanish at home (%)
Residents speaking Spanish at home - Born in the United States (%)
Residents speaking Spanish at home - Native, born elsewhere (%)
Residents speaking Spanish at home - Foreign born (%)
Residents speaking other language at home (%)
Residents speaking other language at home - Born in the United States (%)
Residents speaking other language at home - Native, born elsewhere (%)
Residents speaking other language at home - Foreign born (%)
Marital status - Never married (%)
Marital status - Now married (%)
Marital status - Separated (%)
Marital status - Widowed (%)
Marital status - Divorced (%)
Ancestries Reported - Arab (%)
Ancestries Reported - Czech (%)
Ancestries Reported - Danish (%)
Ancestries Reported - Dutch (%)
Ancestries Reported - English (%)
Ancestries Reported - French (%)
Ancestries Reported - French Canadian (%)
Ancestries Reported - German (%)
Ancestries Reported - Greek (%)
Ancestries Reported - Hungarian (%)
Ancestries Reported - Irish (%)
Ancestries Reported - Italian (%)
Ancestries Reported - Lithuanian (%)
Ancestries Reported - Norwegian (%)
Ancestries Reported - Polish (%)
Ancestries Reported - Portuguese (%)
Ancestries Reported - Russian (%)
Ancestries Reported - Scotch-Irish (%)
Ancestries Reported - Scottish (%)
Ancestries Reported - Slovak (%)
Ancestries Reported - Subsaharan African (%)
Ancestries Reported - Swedish (%)
Ancestries Reported - Swiss (%)
Ancestries Reported - Ukrainian (%)
Ancestries Reported - United States (%)
Ancestries Reported - Welsh (%)
Ancestries Reported - West Indian (%)
Ancestries Reported - Other (%)
Geographical mobility - Same house 1 year ago (%)
Geographical mobility - Same house 1 year ago (%) - White
Geographical mobility - Same house 1 year ago (%) - Black or African American
Geographical mobility - Same house 1 year ago (%) - Asian
Geographical mobility - Same house 1 year ago (%) - Hispanic or Latino
Geographical mobility - Same house 1 year ago (%) - American Indian and Alaska Native
Geographical mobility - Same house 1 year ago (%) - Multirace
Geographical mobility - Same house 1 year ago (%) - Other Race
Geographical mobility - Moved within same county (%)
Geographical mobility - Moved within same county (%) - White
Geographical mobility - Moved within same county (%) - Black or African American
Geographical mobility - Moved within same county (%) - Asian
Geographical mobility - Moved within same county (%) - Hispanic or Latino
Geographical mobility - Moved within same county (%) - American Indian and Alaska Native
Geographical mobility - Moved within same county (%) - Multirace
Geographical mobility - Moved within same county (%) - Other Race
Geographical mobility - Moved from different county within same state (%)
Geographical mobility - Moved from different county within same state (%) - White
Geographical mobility - Moved from different county within same state (%) - Black or African American
Geographical mobility - Moved from different county within same state (%) - Asian
Geographical mobility - Moved from different county within same state (%) - Hispanic or Latino
Geographical mobility - Moved from different county within same state (%) - American Indian and Alaska Native
Geographical mobility - Moved from different county within same state (%) - Multirace
Geographical mobility - Moved from different county within same state (%) - Other Race
Geographical mobility - Moved from different state (%)
Geographical mobility - Moved from different state (%) - White
Geographical mobility - Moved from different state (%) - Black or African American
Geographical mobility - Moved from different state (%) - Asian
Geographical mobility - Moved from different state (%) - Hispanic or Latino
Geographical mobility - Moved from different state (%) - American Indian and Alaska Native
Geographical mobility - Moved from different state (%) - Multirace
Geographical mobility - Moved from different state (%) - Other Race
Geographical mobility - Moved from abroad (%)
Geographical mobility - Moved from abroad (%) - White
Geographical mobility - Moved from abroad (%) - Black or African American
Geographical mobility - Moved from abroad (%) - Asian
Geographical mobility - Moved from abroad (%) - Hispanic or Latino
Geographical mobility - Moved from abroad (%) - American Indian and Alaska Native
Geographical mobility - Moved from abroad (%) - Multirace
Geographical mobility - Moved from abroad (%) - Other Race
Place of birth for the foreign-born population - Ireland (%)
Place of birth for the foreign-born population - Denmark (%)
Place of birth for the foreign-born population - Norway (%)
Place of birth for the foreign-born population - Sweden (%)
Place of birth for the foreign-born population - United Kingdom (%)
Place of birth for the foreign-born population - England (%)
Place of birth for the foreign-born population - Scotland (%)
Place of birth for the foreign-born population - Other Northern Europe (%)
Place of birth for the foreign-born population - Austria (%)
Place of birth for the foreign-born population - Belgium (%)
Place of birth for the foreign-born population - France (%)
Place of birth for the foreign-born population - Germany (%)
Place of birth for the foreign-born population - Netherlands (%)
Place of birth for the foreign-born population - Switzerland (%)
Place of birth for the foreign-born population - Other Western Europe (%)
Place of birth for the foreign-born population - Greece (%)
Place of birth for the foreign-born population - Italy (%)
Place of birth for the foreign-born population - Portugal (%)
Place of birth for the foreign-born population - Spain (%)
Place of birth for the foreign-born population - Other Southern Europe (%)
Place of birth for the foreign-born population - Albania (%)
Place of birth for the foreign-born population - Belarus (%)
Place of birth for the foreign-born population - Bosnia and Herzegovina (%)
Place of birth for the foreign-born population - Bulgaria (%)
Place of birth for the foreign-born population - Croatia (%)
Place of birth for the foreign-born population - Czechoslovakia (%)
Place of birth for the foreign-born population - Hungary (%)
Place of birth for the foreign-born population - Latvia (%)
Place of birth for the foreign-born population - Lithuania (%)
Place of birth for the foreign-born population - North Macedonia (Macedonia) (%)
Place of birth for the foreign-born population - Moldova (%)
Place of birth for the foreign-born population - Poland (%)
Place of birth for the foreign-born population - Romania (%)
Place of birth for the foreign-born population - Russia (%)
Place of birth for the foreign-born population - Serbia (%)
Place of birth for the foreign-born population - Ukraine (%)
Place of birth for the foreign-born population - Other Eastern Europe (%)
Place of birth for the foreign-born population - China (%)
Place of birth for the foreign-born population - Hong Kong (%)
Place of birth for the foreign-born population - Taiwan (%)
Place of birth for the foreign-born population - Japan (%)
Place of birth for the foreign-born population - Korea (%)
Place of birth for the foreign-born population - Other Eastern Asia (%)
Place of birth for the foreign-born population - Afghanistan (%)
Place of birth for the foreign-born population - Bangladesh (%)
Place of birth for the foreign-born population - India (%)
Place of birth for the foreign-born population - Iran (%)
Place of birth for the foreign-born population - Kazakhstan (%)
Place of birth for the foreign-born population - Nepal (%)
Place of birth for the foreign-born population - Pakistan (%)
Place of birth for the foreign-born population - Sri Lanka (%)
Place of birth for the foreign-born population - Uzbekistan (%)
Place of birth for the foreign-born population - Other South Central Asia (%)
Place of birth for the foreign-born population - Burma (%)
Place of birth for the foreign-born population - Cambodia (%)
Place of birth for the foreign-born population - Indonesia (%)
Place of birth for the foreign-born population - Laos (%)
Place of birth for the foreign-born population - Malaysia (%)
Place of birth for the foreign-born population - Philippines (%)
Place of birth for the foreign-born population - Singapore (%)
Place of birth for the foreign-born population - Thailand (%)
Place of birth for the foreign-born population - Vietnam (%)
Place of birth for the foreign-born population - Other South Eastern Asia (%)
Place of birth for the foreign-born population - Armenia (%)
Place of birth for the foreign-born population - Iraq (%)
Place of birth for the foreign-born population - Israel (%)
Place of birth for the foreign-born population - Jordan (%)
Place of birth for the foreign-born population - Kuwait (%)
Place of birth for the foreign-born population - Lebanon (%)
Place of birth for the foreign-born population - Saudi Arabia (%)
Place of birth for the foreign-born population - Syria (%)
Place of birth for the foreign-born population - Turkey (%)
Place of birth for the foreign-born population - Yemen (%)
Place of birth for the foreign-born population - Other Western Asia (%)
Place of birth for the foreign-born population - Eritrea (%)
Place of birth for the foreign-born population - Ethiopia (%)
Place of birth for the foreign-born population - Kenya (%)
Place of birth for the foreign-born population - Somalia (%)
Place of birth for the foreign-born population - Uganda (%)
Place of birth for the foreign-born population - Zimbabwe (%)
Place of birth for the foreign-born population - Other Eastern Africa (%)
Place of birth for the foreign-born population - Cameroon (%)
Place of birth for the foreign-born population - Congo (%)
Place of birth for the foreign-born population - Democratic Republic of Congo (Zaire) (%)
Place of birth for the foreign-born population - Other Middle Africa (%)
Place of birth for the foreign-born population - Egypt (%)
Place of birth for the foreign-born population - Morocco (%)
Place of birth for the foreign-born population - Sudan (%)
Place of birth for the foreign-born population - Other Northern Africa (%)
Place of birth for the foreign-born population - South Africa (%)
Place of birth for the foreign-born population - Other Southern Africa (%)
Place of birth for the foreign-born population - Cabo Verde (%)
Place of birth for the foreign-born population - Ghana (%)
Place of birth for the foreign-born population - Liberia (%)
Place of birth for the foreign-born population - Nigeria (%)
Place of birth for the foreign-born population - Senegal (%)
Place of birth for the foreign-born population - Sierra Leone (%)
Place of birth for the foreign-born population - Other Western Africa (%)
Place of birth for the foreign-born population - Australia (%)
Place of birth for the foreign-born population - New Zealand (%)
Place of birth for the foreign-born population - Fiji (%)
Place of birth for the foreign-born population - Micronesia (%)
Place of birth for the foreign-born population - Bahamas (%)
Place of birth for the foreign-born population - Barbados (%)
Place of birth for the foreign-born population - Cuba (%)
Place of birth for the foreign-born population - Dominica (%)
Place of birth for the foreign-born population - Dominican Republic (%)
Place of birth for the foreign-born population - Grenada (%)
Place of birth for the foreign-born population - Haiti (%)
Place of birth for the foreign-born population - Jamaica (%)
Place of birth for the foreign-born population - St. Vincent and the Grenadines (%)
Place of birth for the foreign-born population - Trinidad and Tobago (%)
Place of birth for the foreign-born population - West Indies (%)
Place of birth for the foreign-born population - Other Caribbean (%)
Place of birth for the foreign-born population - Belize (%)
Place of birth for the foreign-born population - Costa Rica (%)
Place of birth for the foreign-born population - El Salvador (%)
Place of birth for the foreign-born population - Guatemala (%)
Place of birth for the foreign-born population - Honduras (%)
Place of birth for the foreign-born population - Mexico (%)
Place of birth for the foreign-born population - Nicaragua (%)
Place of birth for the foreign-born population - Panama (%)
Place of birth for the foreign-born population - Other Central America (%)
Place of birth for the foreign-born population - Argentina (%)
Place of birth for the foreign-born population - Bolivia (%)
Place of birth for the foreign-born population - Brazil (%)
Place of birth for the foreign-born population - Chile (%)
Place of birth for the foreign-born population - Colombia (%)
Place of birth for the foreign-born population - Ecuador (%)
Place of birth for the foreign-born population - Guyana (%)
Place of birth for the foreign-born population - Peru (%)
Place of birth for the foreign-born population - Uruguay (%)
Place of birth for the foreign-born population - Venezuela (%)
Place of birth for the foreign-born population - Other South America (%)
Place of birth for the foreign-born population - Canada (%)
Place of birth for the foreign-born population - Other Northern America (%)
Place of birth for the foreign-born population - Other (%)
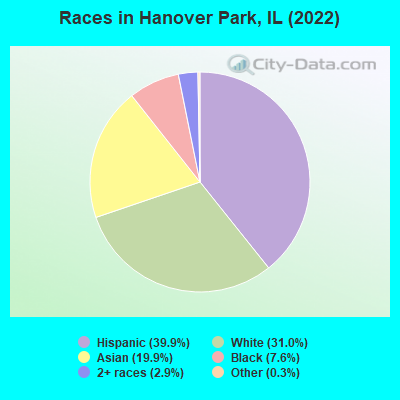
According to 2022 data, the most numerous races in Hanover Park, IL are White alone (11,418 residents), Hispanic (14,702 residents), and Black alone (2,805 residents). 44.0% of Hanover Park residents speak English at home. 35.4% of Hanover Park, IL residents are foreign-born (17.5% born in Latin America, 13.9% born in Asia), which is 60.5% greater than the foreign-born rate of 14.0% across the entire state of Illinois.
Race distribution in Hanover Park
2000 2022
8,424,140 67.8% White alone 1,856,152 14.9% Black alone 1,530,262 12.3% Hispanic 419,916 3.4% Asian alone 153,996 1.2% Two or more races 13,479 0.1% Other race alone 18,232 0.1% American Indian alone 3,116 0.03% Native Hawaiian and Other
7,356,301 58.5% White alone 2,299,726 18.3% Hispanic 1,660,423 13.2% Black alone 747,296 5.9% Asian alone 458,599 3.6% Two or more races 45,386 0.4% Other race alone 10,405 0.08% American Indian alone 3,896 0.03% Native Hawaiian and Other
Income and house value in Hanover Park Median household income in 2022 $90,224 White non-Hispanic householders$55,224 Black householders$66,336 American Indian and Alaska Native householders$92,524 Asian householders$81,667 Some other race householders$79,640 Two or more races householders$78,858 Hispanic or Latino race householdersMedian 2022 house value $250,939 White Non-Hispanic householders$262,718 Black or African American householders$490,812 American Indian or Alaska Native householders $259,684 Asian householders$252,902 Some other race householders$237,910 Two or more races householders$251,831 Hispanic or Latino householders
Median age by race in Hanover Park
38.2 Median age for White residents40.9 36.3 23.8 Median age for Black or African American residents24.7 23.4 44.9 Median age for American Indian / Alaska Native residents46.6 31.0 41.4 Median age for Asian residents40.1 44.8 -593,236,714.4 Median age for Native Hawaiian / Pacific Islander residents-658,536,584.7 -576,015,108.0 30.6 Median age for Other race residents32.1 31.0 31.4 Median age for Two or more races residents28.0 32.3 43.2 Median age for White alone residents44.3 40.6 29.0 Median age for Hispanic or Latino residents29.3 29.0
Owner/renter occupied households by race in Hanover Park
House owners and renters - White residents 4,351 83.4% Owner occupied865 16.6% Renter occupiedHouse owners and renters - Black or African American residents 410 49.3% Owner occupied421 50.7% Renter occupiedHouse owners and renters - American Indian / Alaska Native residents 23 24.1% Owner occupied72 75.9% Renter occupiedHouse owners and renters - Asian residents 2,150 89.9% Owner occupied242 10.1% Renter occupiedHouse owners and renters - Other race residents 1,248 70.9% Owner occupied512 29.1% Renter occupiedHouse owners and renters - Two or more races residents 1,095 57.2% Owner occupied819 42.8% Renter occupiedHouse owners and renters - White alone residents 3,877 86.0% Owner occupied633 14.0% Renter occupiedHouse owners and renters - Hispanic or Latino residents 2,205 63.4% Owner occupied1,271 36.6% Renter occupied
Language usage in Hanover Park
English speakers - Total 44.0% of residents of Hanover Park speak English at home.
35.6% of residents speak Spanish at home 6,665 53.8% Speak English very well5,712 46.2% Speak English less than very well21.9% of residents speak other language at home 4,647 60.9% Speak English very well2,980 39.1% Speak English less than very well
English speakers - Born in the United States 83.8% of residents of Hanover Park speak English at home.
10.5% of residents speak Spanish at home 270 90.6% Speak English very well28 9.4% Speak English less than very well3.4% of residents speak other language at home 80 82.5% Speak English very well17 17.5% Speak English less than very well
English speakers - Native, born elsewhere 17.4% of residents of Hanover Park speak English at home.
78.1% of residents speak Spanish at home 487 68.3% Speak English very well226 31.7% Speak English less than very well9.1% of residents speak other language at home 71 85.5% Speak English very well12 14.5% Speak English less than very well
English speakers - Foreign-born 6.0% of residents of Hanover Park speak English at home.
50.1% of residents speak Spanish at home 1,988 30.5% Speak English very well4,533 69.5% Speak English less than very well46.4% of residents speak other language at home 3,322 55.0% Speak English very well2,713 45.0% Speak English less than very well
White (Caucasian) - Speak only English Native:
83.4% (9,681)Foreign-born:
16.0% (328)
White (Caucasian) - Speak another language Native:
13.6% (1,584)Foreign-born:
83.7% (1,713)
Black or African American - Speak only English Native:
100.0% (2,494)Foreign-born:
23.6% (16)
Black or African American - Speak another language Native:
1.0% (25)Foreign-born:
100.0% (66)
American Indian / Alaska Native - Speak only English Native:
8.2% (9)Foreign-born:
12.7% (31)
American Indian / Alaska Native - Speak another language Native:
99.1% (113)Foreign-born:
98.0% (243)
Asian - Speak only English Native:
51.3% (1,117)Foreign-born:
2.7% (134)
Asian - Speak another language Native:
46.9% (1,020)Foreign-born:
98.4% (4,932)
Other race - Speak only English Native:
13.4% (480)Foreign-born:
4.0% (131)
Other race - Speak another language Native:
82.1% (2,938)Foreign-born:
96.5% (3,158)
Two or more races - Speak only English Native:
34.9% (1,148)Foreign-born:
5.2% (214)
Two or more races - Speak another language Native:
70.7% (2,328)Foreign-born:
95.9% (3,940)
White alone - Speak only English Native:
94.7% (9,243)Foreign-born:
25.2% (279)
White alone - Speak another language Native:
5.2% (512)Foreign-born:
75.1% (830)
Hispanic or Latino - Speak only English Native:
19.6% (1,400)Foreign-born:
5.1% (347)
Hispanic or Latino - Speak another language Native:
81.4% (5,804)Foreign-born:
95.1% (6,405)
Foreign-born residents in Hanover Park 13,057 residents are foreign born (17.5% Latin America , 13.9% Asia ).
This city:
35.4%Illinois:
14.1%
Marital status for residents in Hanover Park Marital status - White (Caucasian) population 15 years and over
Males 32.0% Never married54.5% Now married3.3% Separated3.3% Widowed6.9% DivorcedFemales 29.2% Never married49.8% Now married2.2% Separated6.3% Widowed12.5% DivorcedWomen who gave birth in the past 12 months Now married:
75.0% (247)Unmarried:
25.0% (82)
Women who did not give birth in the past 12 months Now married:
45.3% (1,348)Unmarried:
54.7% (1,630)
Marital status - Black or African American population 15 years and over
Males 64.2% Never married30.1% Now married1.1% Separated4.6% Widowed0.0% DivorcedFemales 60.6% Never married20.7% Now married2.9% Separated1.1% Widowed14.7% DivorcedWomen who gave birth in the past 12 months Now married:
61.6% (62)Unmarried:
38.4% (39)
Women who did not give birth in the past 12 months Now married:
12.6% (75)Unmarried:
87.4% (520)
Marital status - American Indian / Alaska Native population 15 years and over
Males 48.4% Never married27.0% Now married20.8% Separated3.8% Widowed0.0% DivorcedFemales 30.2% Never married30.2% Now married7.9% Separated31.7% Widowed0.0% DivorcedWomen who gave birth in the past 12 months Now married:
0.0% (0)Unmarried:
100.0% (8)
Women who did not give birth in the past 12 months Now married:
54.2% (65)Unmarried:
45.8% (55)
Marital status - Asian population 15 years and over
Males 36.3% Never married59.0% Now married0.4% Separated2.8% Widowed1.5% DivorcedFemales 22.4% Never married62.9% Now married1.5% Separated10.1% Widowed3.1% DivorcedWomen who gave birth in the past 12 months Now married:
100.0% (64)Unmarried:
0.0% (0)
Women who did not give birth in the past 12 months Now married:
57.6% (1,010)Unmarried:
42.4% (744)
Marital status - Other race population 15 years and over
Males 48.0% Never married44.3% Now married0.0% Separated2.1% Widowed5.5% DivorcedFemales 35.4% Never married44.6% Now married7.2% Separated8.2% Widowed4.7% DivorcedWomen who gave birth in the past 12 months Now married:
52.1% (35)Unmarried:
47.9% (32)
Women who did not give birth in the past 12 months Now married:
49.6% (999)Unmarried:
50.4% (1,014)
Marital status - Two or more races population 15 years and over
Males 55.7% Never married36.7% Now married2.0% Separated0.0% Widowed5.6% DivorcedFemales 36.8% Never married43.7% Now married1.5% Separated8.9% Widowed9.2% DivorcedWomen who gave birth in the past 12 months Now married:
100.0% (38)Unmarried:
0.0% (0)
Women who did not give birth in the past 12 months Now married:
30.6% (501)Unmarried:
69.4% (1,139)
Marital status - White alone, not Hispanic / Latino population 15 years and over
Males 29.8% Never married56.1% Now married2.4% Separated3.7% Widowed8.0% DivorcedFemales 24.5% Never married52.3% Now married1.4% Separated6.5% Widowed15.2% DivorcedWomen who gave birth in the past 12 months Now married:
71.7% (197)Unmarried:
28.3% (77)
Women who did not give birth in the past 12 months Now married:
48.4% (1,024)Unmarried:
51.6% (1,093)
Marital status - Hispanic or Latino population 15 years and over
Males 49.2% Never married41.8% Now married3.0% Separated1.4% Widowed4.6% DivorcedFemales 40.0% Never married40.3% Now married5.0% Separated8.6% Widowed6.1% DivorcedWomen who gave birth in the past 12 months Now married:
74.3% (117)Unmarried:
25.7% (40)
Women who did not give birth in the past 12 months Now married:
40.0% (1,499)Unmarried:
60.0% (2,246)
Ancestries in Hanover Park
1,190 5.4% Polish607 2.8% German501 2.3% American434 2.0% Italian367 1.7% Somali318 1.5% Irish179 0.8% English177 0.8% European108 0.5% Swedish101 0.5% Ukrainian79 0.4% Greek74 0.3% Ethiopian68 0.3% Ghanaian65 0.3% Dutch57 0.3% Portuguese55 0.3% Iraqi55 0.3% Bulgarian54 0.2% African50 0.2% Albanian50 0.2% Czech44 0.2% Scandinavian40 0.2% Hungarian30 0.1% Egyptian30 0.1% Czechoslovakian25 0.1% Lithuanian24 0.1% Palestinian23 0.1% Norwegian22 0.1% Yugoslavian20 0.09% Eastern European19 0.09% Nigerian16 0.07% Serbian15 0.07% French14 0.06% Finnish14 0.06% Russian11 0.05% French Canadian11 0.05% Trinidadian and Tobagonian10 0.05% Romanian10 0.05% Arab10 0.05% British7 0.03% Scottish7 0.03% Canadian6 0.03% Soviet Union3 0.01% Slavic
Geographical mobility in Hanover Park Same house 1 year ago 13,221 92.9% White (Caucasian)2,420 88.2% Black or African American391 84.9% American Indian / Alaska Native6,522 88.5% Asian6,468 88.9% Other race6,800 87.5% Two or more races10,469 93.6% White alone, not Hispanic / Latino12,859 88.2% Hispanic or LatinoMoved within same county 393 2.8% White / Caucasian86 3.1% Black or African American70 15.2% American Indian / Alaska Native441 6.0% Asian326 4.5% Other race232 3.0% Two or more races205 1.8% White alone, not Hispanic / Latino580 4.0% Hispanic or LatinoMoved within same state 359 2.5% White / Caucasian254 9.3% Black or African American156 2.1% Asian239 3.3% Other race769 9.9% Two or more races304 2.7% White alone, not Hispanic / Latino786 5.4% Hispanic or LatinoMoved from different state 187 1.3% White / Caucasian10 0.4% Black or African American21 0.3% Asian14 0.2% Other race194 1.7% White alone, not Hispanic / LatinoMoved from abroad 91 0.6% White162 2.2% Asian116 1.6% Other race82 1.1% Two or more races41 0.4% White alone, not Hispanic / Latino292 2.0% Hispanic or Latino
Children Nativity (place of birth) in Hanover Park
Children under 6 years - Living with two parents Both parents native 587 100.0% Native0 0.0% Foreign-bornBoth parents foreign-born 687 99.7% Native2 0.3% Foreign-bornOne native, one foreign-born parent 323 100.0% NativeChildren under 6 years - Living with one parent Native parent 470 100.0% NativeForeign-born parent 162 100.0% NativeChildren 6 to 17 years - Living with two parents Both parents native 1,812 100.0% NativeBoth parents foreign-born 1,705 73.9% Native603 26.1% Foreign-bornOne native, one foreign-born parent 496 100.0% NativeChildren 6 to 17 years - Living with one parent Native parent 452 100.0% NativeForeign-born parent 1,598 59.4% Native1,095 40.6% Foreign-born
Grandparents responsible for own grandchildren in Hanover Park
Grandparents (30 to 59 years) White / Caucasian 43 41.7% Responsible for grandchildren61 58.3% Not responsible for grandchildrenBlack or African American 9 100.0% Not responsible for grandchildrenAsian 6 100.0% Not responsible for grandchildrenOther race 27 19.8% Responsible for grandchildren108 80.2% Not responsible for grandchildrenTwo or more races 198 90.0% Responsible for grandchildren22 10.0% Not responsible for grandchildrenWhite alone, not Hispanic / Latino 48 60.9% Responsible for grandchildren31 39.1% Not responsible for grandchildrenHispanic or Latino 28 11.4% Responsible for grandchildren217 88.6% Not responsible for grandchildrenGrandparents (60 years and over) White / Caucasian 20 12.8% Responsible for grandchildren138 87.2% Not responsible for grandchildrenBlack or African American 17 100.0% Responsible for grandchildrenAsian 8 2.6% Responsible for grandchildren308 97.4% Not responsible for grandchildrenOther race 54 100.0% Not responsible for grandchildrenTwo or more races 45 100.0% Not responsible for grandchildrenWhite alone, not Hispanic / Latino 22 15.8% Responsible for grandchildren119 84.2% Not responsible for grandchildrenHispanic or Latino 11 4.8% Responsible for grandchildren217 95.2% Not responsible for grandchildren