Races in Harrisville, New Hampshire (NH) Detailed Stats
Ancestries, Foreign-born residents, place of birth

Recent posts about races in Harrisville, New Hampshire on our local forum with over 2,400,000 registered users:
 | Looking at Southern NH...Where would you recommend searching? (15 replies) |
| MD to...Anywhere in the US (37 replies) |
| Leaving Tahoe for NH, need help with specifics (26 replies) |
| LA to New England-Looking at New Hampshire (47 replies) |
| Holy Smokes Que review.. and a ride of course. (7 replies) |
| Photography locations... (8 replies) |
3.7% of Harrisville, NH residents are foreign-born (1.8% born in Europe, 1.1% born in North America), which is 34.4% less than the foreign-born rate of 5.0% across the entire state of New Hampshire.
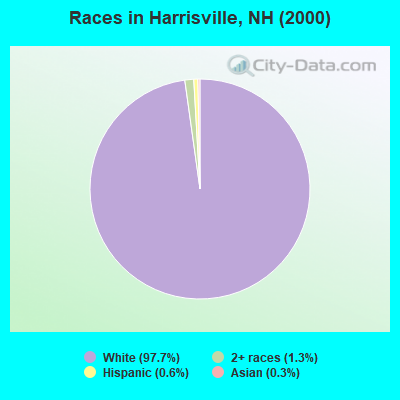
Race distribution in Harrisville

- 1,05097.7%White alone
- 141.3%Two or more races
- 60.6%Hispanic
- 30.3%Asian alone
- 10.09%Black alone
- 10.09%American Indian alone
2000
2022
-
- 1,175,25295.1%White alone
- 20,4891.7%Hispanic
- 15,8031.3%Asian alone
- 11,6060.9%Two or more races
- 8,3540.7%Black alone
- 2,6980.2%American Indian alone
- 1,2540.1%Other race alone
- 3300.03%Native Hawaiian and Other
Pacific Islander alone

-
- 1,208,10186.6%White alone
- 63,4794.5%Hispanic
- 60,7244.4%Two or more races
- 36,5192.6%Asian alone
- 17,9311.3%Black alone
- 6,6150.5%Other race alone
- 1,0140.07%American Indian alone
- 8480.06%Native Hawaiian and Other
Pacific Islander alone

Income and house value in Harrisville
- Median household income in 2022
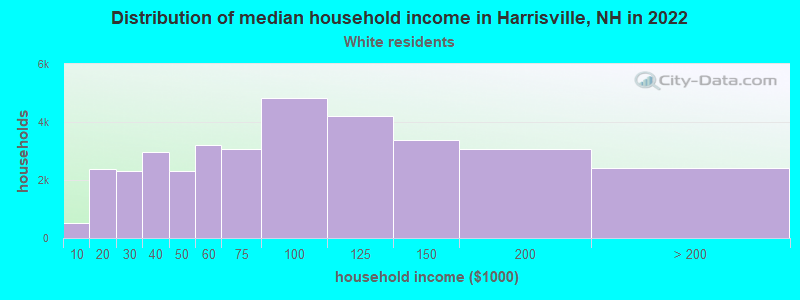
- $92,404White non-Hispanic householders
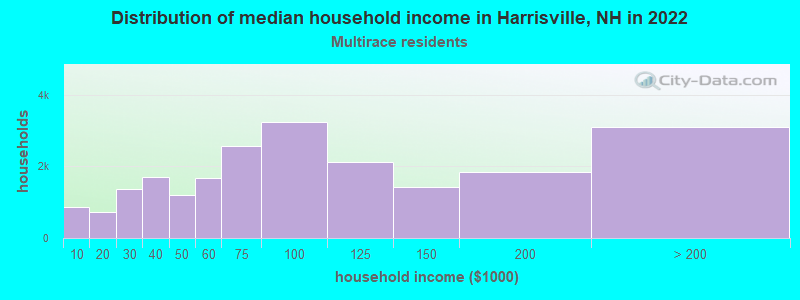
- $158,428Two or more races householders
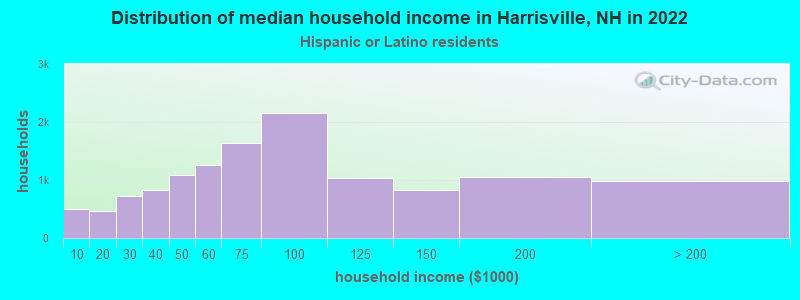
- $40,349Hispanic or Latino race householders
- Median 2022 house value
- $323,847White Non-Hispanic householders
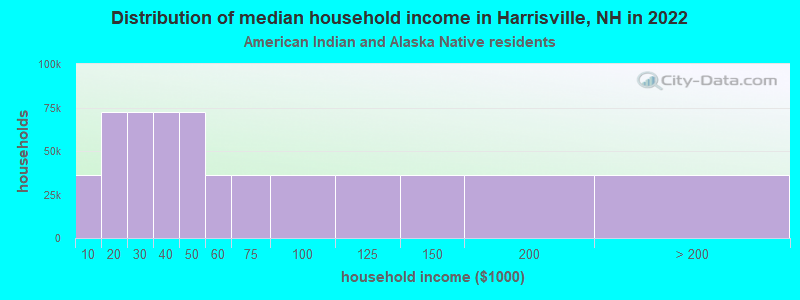
- $97,154American Indian or Alaska Native householders
- $291,462Two or more races householders
Household income for White non-Hispanic householders
Household income for American Indian and Alaska Native householders
Household income for Two or more races householders
Household income for Hispanic or Latino race householders
Foreign-born residents in Harrisville
40 residents are foreign born (1.8% Europe, 1.1% North America).
| This city: | 3.7% |
| New Hampshire: | 4.4% |
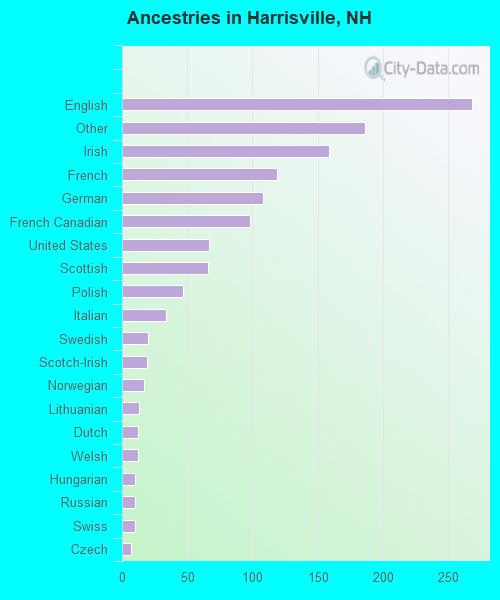
Ancestries in Harrisville

- 26820.8%English
- 18614.5%Other
- 15912.4%Irish
- 1199.3%French
- 1088.4%German
- 987.6%French Canadian
- 675.2%United States
- 665.1%Scottish
- 473.7%Polish
- 342.6%Italian
- 201.6%Swedish
- 191.5%Scotch-Irish
- 171.3%Norwegian
- 131.0%Lithuanian
- 120.9%Dutch
- 120.9%Welsh
- 100.8%Hungarian
- 100.8%Russian
- 100.8%Swiss
- 70.5%Czech
- 20.2%Arab
- 20.2%Portuguese
Zip codes: 03450.