Races in Hitchcock, Texas (TX) Detailed Stats
Data:
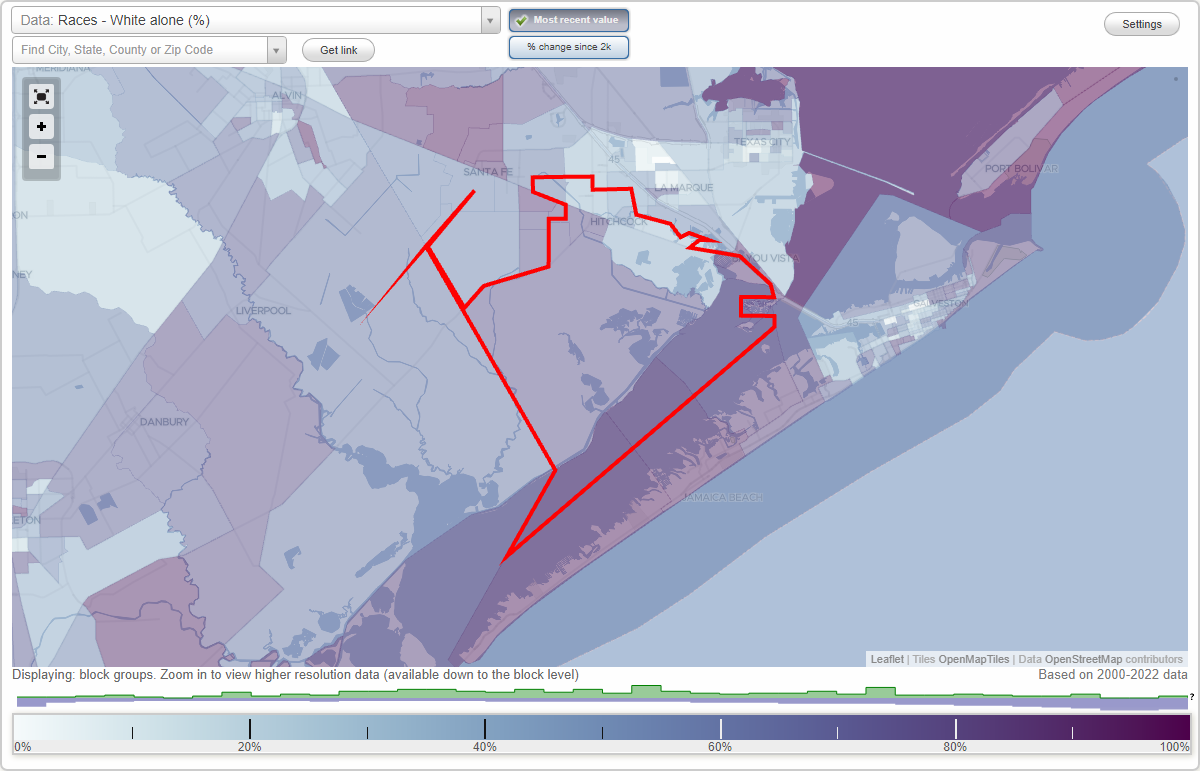
Races - White alone (%)
Races - White alone (% change since 2000)
Races - Black alone (%)
Races - Black alone (% change since 2000)
Races - American Indian alone (%)
Races - American Indian alone (% change since 2000)
Races - Asian alone (%)
Races - Asian alone (% change since 2000)
Races - Hispanic (%)
Races - Hispanic (% change since 2000)
Races - Native Hawaiian and Other Pacific Islander alone (%)
Races - Native Hawaiian and Other Pacific Islander alone (% change since 2000)
Races - Two or more races(%)
Races - Two or more races(% change since 2000)
Races - Other race alone (%)
Races - Other race alone (% change since 2000)
Racial diversity
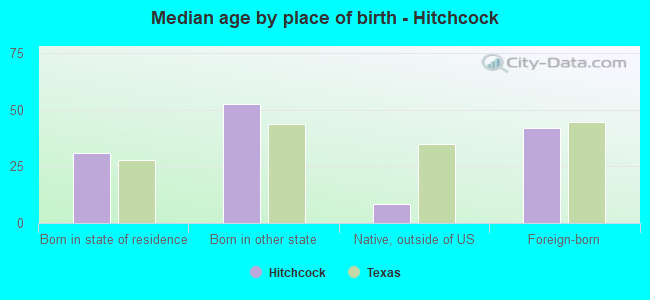
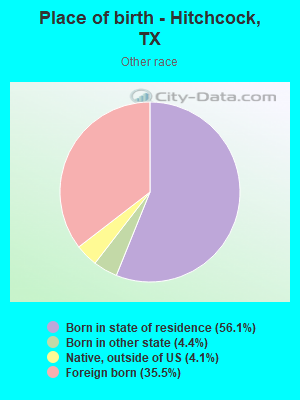
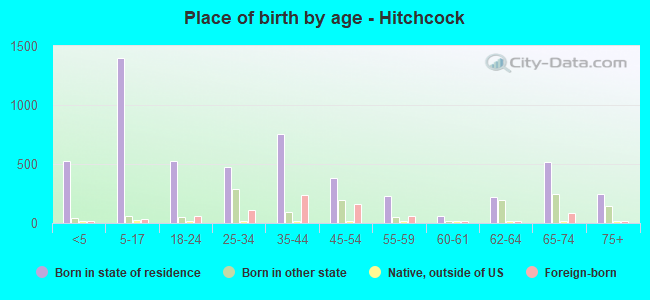
Place of birth - Born in state of residence (%)
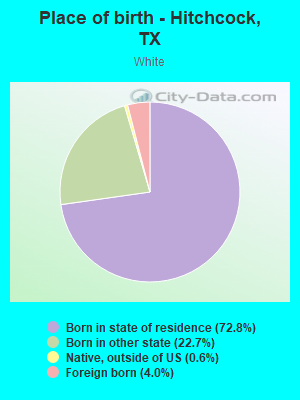
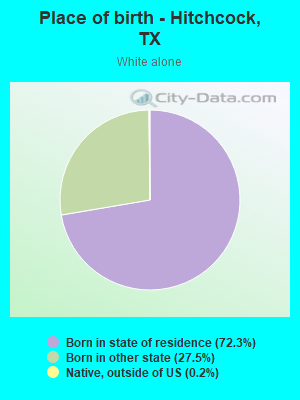
Place of birth - Born in state of residence (%) - White
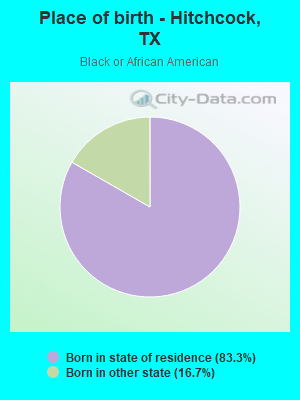
Place of birth - Born in state of residence (%) - Black or African American
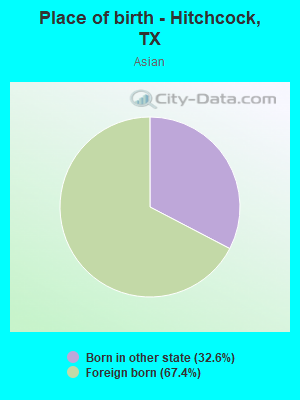
Place of birth - Born in state of residence (%) - Asian
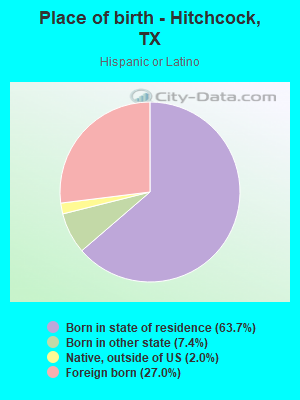
Place of birth - Born in state of residence (%) - Hispanic or Latino
Place of birth - Born in state of residence (%) - American Indian and Alaska Native
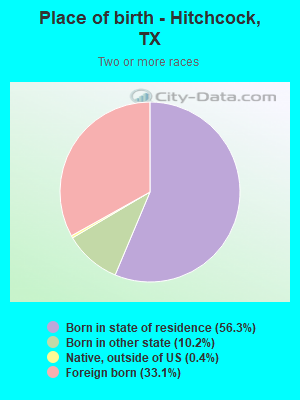
Place of birth - Born in state of residence (%) - Multirace
Place of birth - Born in state of residence (%) - Other Race
Place of birth - Born in other state (%)
Place of birth - Born in other state (%) - White
Place of birth - Born in other state (%) - Black or African American
Place of birth - Born in other state (%) - Asian
Place of birth - Born in other state (%) - Hispanic or Latino
Place of birth - Born in other state (%) - American Indian and Alaska Native
Place of birth - Born in other state (%) - Multirace
Place of birth - Born in other state (%) - Other Race
Place of birth - Native, outside of US (%)
Place of birth - Native, outside of US (%) - White
Place of birth - Native, outside of US (%) - Black or African American
Place of birth - Native, outside of US (%) - Asian
Place of birth - Native, outside of US (%) - Hispanic or Latino
Place of birth - Native, outside of US (%) - American Indian and Alaska Native
Place of birth - Native, outside of US (%) - Multirace
Place of birth - Native, outside of US (%) - Other Race
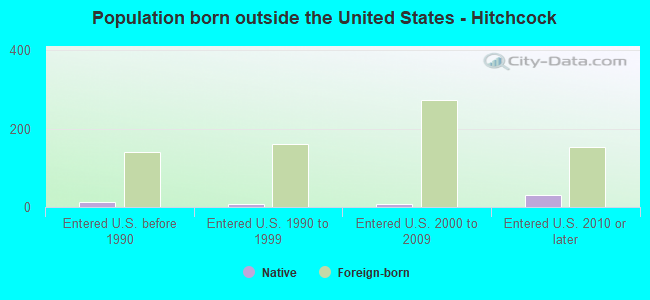
Place of birth - Foreign born (%)
Place of birth - Foreign born (%) - White
Place of birth - Foreign born (%) - Black or African American
Place of birth - Foreign born (%) - Asian
Place of birth - Foreign born (%) - Hispanic or Latino
Place of birth - Foreign born (%) - American Indian and Alaska Native
Place of birth - Foreign born (%) - Multirace
Place of birth - Foreign born (%) - Other Race
Residents speaking English at home (%)
Residents speaking English at home - Born in the United States (%)
Residents speaking English at home - Native, born elsewhere (%)
Residents speaking English at home - Foreign born (%)
Residents speaking Spanish at home (%)
Residents speaking Spanish at home - Born in the United States (%)
Residents speaking Spanish at home - Native, born elsewhere (%)
Residents speaking Spanish at home - Foreign born (%)
Residents speaking other language at home (%)
Residents speaking other language at home - Born in the United States (%)
Residents speaking other language at home - Native, born elsewhere (%)
Residents speaking other language at home - Foreign born (%)
Marital status - Never married (%)
Marital status - Now married (%)
Marital status - Separated (%)
Marital status - Widowed (%)
Marital status - Divorced (%)
Ancestries Reported - Arab (%)
Ancestries Reported - Czech (%)
Ancestries Reported - Danish (%)
Ancestries Reported - Dutch (%)
Ancestries Reported - English (%)
Ancestries Reported - French (%)
Ancestries Reported - French Canadian (%)
Ancestries Reported - German (%)
Ancestries Reported - Greek (%)
Ancestries Reported - Hungarian (%)
Ancestries Reported - Irish (%)
Ancestries Reported - Italian (%)
Ancestries Reported - Lithuanian (%)
Ancestries Reported - Norwegian (%)
Ancestries Reported - Polish (%)
Ancestries Reported - Portuguese (%)
Ancestries Reported - Russian (%)
Ancestries Reported - Scotch-Irish (%)
Ancestries Reported - Scottish (%)
Ancestries Reported - Slovak (%)
Ancestries Reported - Subsaharan African (%)
Ancestries Reported - Swedish (%)
Ancestries Reported - Swiss (%)
Ancestries Reported - Ukrainian (%)
Ancestries Reported - United States (%)
Ancestries Reported - Welsh (%)
Ancestries Reported - West Indian (%)
Ancestries Reported - Other (%)
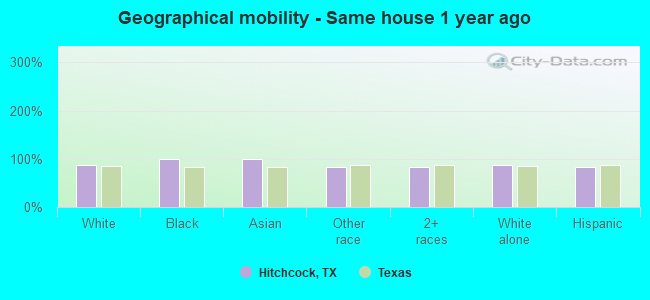
Geographical mobility - Same house 1 year ago (%)
Geographical mobility - Same house 1 year ago (%) - White
Geographical mobility - Same house 1 year ago (%) - Black or African American
Geographical mobility - Same house 1 year ago (%) - Asian
Geographical mobility - Same house 1 year ago (%) - Hispanic or Latino
Geographical mobility - Same house 1 year ago (%) - American Indian and Alaska Native
Geographical mobility - Same house 1 year ago (%) - Multirace
Geographical mobility - Same house 1 year ago (%) - Other Race
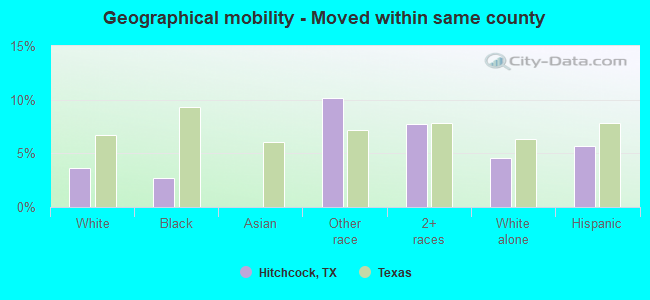
Geographical mobility - Moved within same county (%)
Geographical mobility - Moved within same county (%) - White
Geographical mobility - Moved within same county (%) - Black or African American
Geographical mobility - Moved within same county (%) - Asian
Geographical mobility - Moved within same county (%) - Hispanic or Latino
Geographical mobility - Moved within same county (%) - American Indian and Alaska Native
Geographical mobility - Moved within same county (%) - Multirace
Geographical mobility - Moved within same county (%) - Other Race
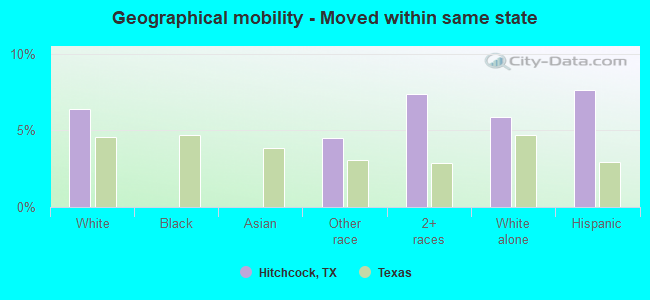
Geographical mobility - Moved from different county within same state (%)
Geographical mobility - Moved from different county within same state (%) - White
Geographical mobility - Moved from different county within same state (%) - Black or African American
Geographical mobility - Moved from different county within same state (%) - Asian
Geographical mobility - Moved from different county within same state (%) - Hispanic or Latino
Geographical mobility - Moved from different county within same state (%) - American Indian and Alaska Native
Geographical mobility - Moved from different county within same state (%) - Multirace
Geographical mobility - Moved from different county within same state (%) - Other Race
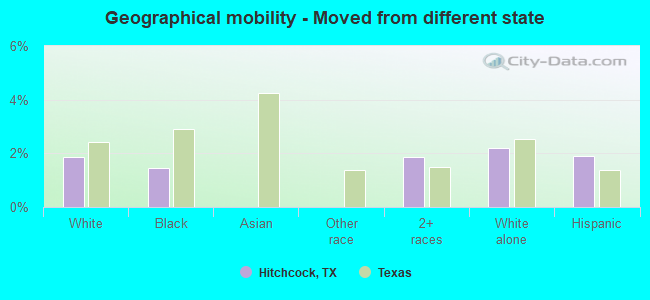
Geographical mobility - Moved from different state (%)
Geographical mobility - Moved from different state (%) - White
Geographical mobility - Moved from different state (%) - Black or African American
Geographical mobility - Moved from different state (%) - Asian
Geographical mobility - Moved from different state (%) - Hispanic or Latino
Geographical mobility - Moved from different state (%) - American Indian and Alaska Native
Geographical mobility - Moved from different state (%) - Multirace
Geographical mobility - Moved from different state (%) - Other Race
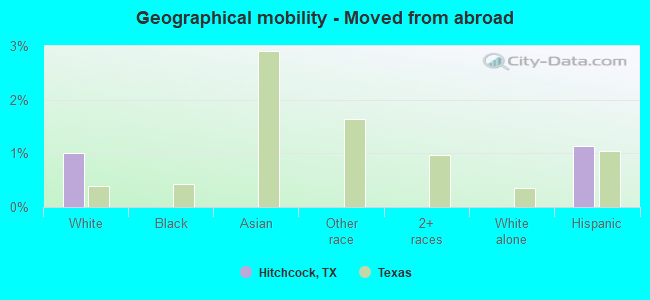
Geographical mobility - Moved from abroad (%)
Geographical mobility - Moved from abroad (%) - White
Geographical mobility - Moved from abroad (%) - Black or African American
Geographical mobility - Moved from abroad (%) - Asian
Geographical mobility - Moved from abroad (%) - Hispanic or Latino
Geographical mobility - Moved from abroad (%) - American Indian and Alaska Native
Geographical mobility - Moved from abroad (%) - Multirace
Geographical mobility - Moved from abroad (%) - Other Race
Place of birth for the foreign-born population - Ireland (%)
Place of birth for the foreign-born population - Denmark (%)
Place of birth for the foreign-born population - Norway (%)
Place of birth for the foreign-born population - Sweden (%)
Place of birth for the foreign-born population - United Kingdom (%)
Place of birth for the foreign-born population - England (%)
Place of birth for the foreign-born population - Scotland (%)
Place of birth for the foreign-born population - Other Northern Europe (%)
Place of birth for the foreign-born population - Austria (%)
Place of birth for the foreign-born population - Belgium (%)
Place of birth for the foreign-born population - France (%)
Place of birth for the foreign-born population - Germany (%)
Place of birth for the foreign-born population - Netherlands (%)
Place of birth for the foreign-born population - Switzerland (%)
Place of birth for the foreign-born population - Other Western Europe (%)
Place of birth for the foreign-born population - Greece (%)
Place of birth for the foreign-born population - Italy (%)
Place of birth for the foreign-born population - Portugal (%)
Place of birth for the foreign-born population - Spain (%)
Place of birth for the foreign-born population - Other Southern Europe (%)
Place of birth for the foreign-born population - Albania (%)
Place of birth for the foreign-born population - Belarus (%)
Place of birth for the foreign-born population - Bosnia and Herzegovina (%)
Place of birth for the foreign-born population - Bulgaria (%)
Place of birth for the foreign-born population - Croatia (%)
Place of birth for the foreign-born population - Czechoslovakia (%)
Place of birth for the foreign-born population - Hungary (%)
Place of birth for the foreign-born population - Latvia (%)
Place of birth for the foreign-born population - Lithuania (%)
Place of birth for the foreign-born population - North Macedonia (Macedonia) (%)
Place of birth for the foreign-born population - Moldova (%)
Place of birth for the foreign-born population - Poland (%)
Place of birth for the foreign-born population - Romania (%)
Place of birth for the foreign-born population - Russia (%)
Place of birth for the foreign-born population - Serbia (%)
Place of birth for the foreign-born population - Ukraine (%)
Place of birth for the foreign-born population - Other Eastern Europe (%)
Place of birth for the foreign-born population - China (%)
Place of birth for the foreign-born population - Hong Kong (%)
Place of birth for the foreign-born population - Taiwan (%)
Place of birth for the foreign-born population - Japan (%)
Place of birth for the foreign-born population - Korea (%)
Place of birth for the foreign-born population - Other Eastern Asia (%)
Place of birth for the foreign-born population - Afghanistan (%)
Place of birth for the foreign-born population - Bangladesh (%)
Place of birth for the foreign-born population - India (%)
Place of birth for the foreign-born population - Iran (%)
Place of birth for the foreign-born population - Kazakhstan (%)
Place of birth for the foreign-born population - Nepal (%)
Place of birth for the foreign-born population - Pakistan (%)
Place of birth for the foreign-born population - Sri Lanka (%)
Place of birth for the foreign-born population - Uzbekistan (%)
Place of birth for the foreign-born population - Other South Central Asia (%)
Place of birth for the foreign-born population - Burma (%)
Place of birth for the foreign-born population - Cambodia (%)
Place of birth for the foreign-born population - Indonesia (%)
Place of birth for the foreign-born population - Laos (%)
Place of birth for the foreign-born population - Malaysia (%)
Place of birth for the foreign-born population - Philippines (%)
Place of birth for the foreign-born population - Singapore (%)
Place of birth for the foreign-born population - Thailand (%)
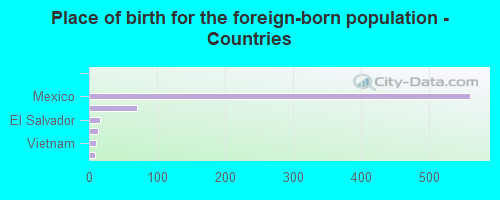
Place of birth for the foreign-born population - Vietnam (%)
Place of birth for the foreign-born population - Other South Eastern Asia (%)
Place of birth for the foreign-born population - Armenia (%)
Place of birth for the foreign-born population - Iraq (%)
Place of birth for the foreign-born population - Israel (%)
Place of birth for the foreign-born population - Jordan (%)
Place of birth for the foreign-born population - Kuwait (%)
Place of birth for the foreign-born population - Lebanon (%)
Place of birth for the foreign-born population - Saudi Arabia (%)
Place of birth for the foreign-born population - Syria (%)
Place of birth for the foreign-born population - Turkey (%)
Place of birth for the foreign-born population - Yemen (%)
Place of birth for the foreign-born population - Other Western Asia (%)
Place of birth for the foreign-born population - Eritrea (%)
Place of birth for the foreign-born population - Ethiopia (%)
Place of birth for the foreign-born population - Kenya (%)
Place of birth for the foreign-born population - Somalia (%)
Place of birth for the foreign-born population - Uganda (%)
Place of birth for the foreign-born population - Zimbabwe (%)
Place of birth for the foreign-born population - Other Eastern Africa (%)
Place of birth for the foreign-born population - Cameroon (%)
Place of birth for the foreign-born population - Congo (%)
Place of birth for the foreign-born population - Democratic Republic of Congo (Zaire) (%)
Place of birth for the foreign-born population - Other Middle Africa (%)
Place of birth for the foreign-born population - Egypt (%)
Place of birth for the foreign-born population - Morocco (%)
Place of birth for the foreign-born population - Sudan (%)
Place of birth for the foreign-born population - Other Northern Africa (%)
Place of birth for the foreign-born population - South Africa (%)
Place of birth for the foreign-born population - Other Southern Africa (%)
Place of birth for the foreign-born population - Cabo Verde (%)
Place of birth for the foreign-born population - Ghana (%)
Place of birth for the foreign-born population - Liberia (%)
Place of birth for the foreign-born population - Nigeria (%)
Place of birth for the foreign-born population - Senegal (%)
Place of birth for the foreign-born population - Sierra Leone (%)
Place of birth for the foreign-born population - Other Western Africa (%)
Place of birth for the foreign-born population - Australia (%)
Place of birth for the foreign-born population - New Zealand (%)
Place of birth for the foreign-born population - Fiji (%)
Place of birth for the foreign-born population - Micronesia (%)
Place of birth for the foreign-born population - Bahamas (%)
Place of birth for the foreign-born population - Barbados (%)
Place of birth for the foreign-born population - Cuba (%)
Place of birth for the foreign-born population - Dominica (%)
Place of birth for the foreign-born population - Dominican Republic (%)
Place of birth for the foreign-born population - Grenada (%)
Place of birth for the foreign-born population - Haiti (%)
Place of birth for the foreign-born population - Jamaica (%)
Place of birth for the foreign-born population - St. Vincent and the Grenadines (%)
Place of birth for the foreign-born population - Trinidad and Tobago (%)
Place of birth for the foreign-born population - West Indies (%)
Place of birth for the foreign-born population - Other Caribbean (%)
Place of birth for the foreign-born population - Belize (%)
Place of birth for the foreign-born population - Costa Rica (%)
Place of birth for the foreign-born population - El Salvador (%)
Place of birth for the foreign-born population - Guatemala (%)
Place of birth for the foreign-born population - Honduras (%)
Place of birth for the foreign-born population - Mexico (%)
Place of birth for the foreign-born population - Nicaragua (%)
Place of birth for the foreign-born population - Panama (%)
Place of birth for the foreign-born population - Other Central America (%)
Place of birth for the foreign-born population - Argentina (%)
Place of birth for the foreign-born population - Bolivia (%)
Place of birth for the foreign-born population - Brazil (%)
Place of birth for the foreign-born population - Chile (%)
Place of birth for the foreign-born population - Colombia (%)
Place of birth for the foreign-born population - Ecuador (%)
Place of birth for the foreign-born population - Guyana (%)
Place of birth for the foreign-born population - Peru (%)
Place of birth for the foreign-born population - Uruguay (%)
Place of birth for the foreign-born population - Venezuela (%)
Place of birth for the foreign-born population - Other South America (%)
Place of birth for the foreign-born population - Canada (%)
Place of birth for the foreign-born population - Other Northern America (%)
Place of birth for the foreign-born population - Other (%)
Latest news about races in Hitchcock, TX collected exclusively by city-data.com from local newspapers, TV, and radio stations
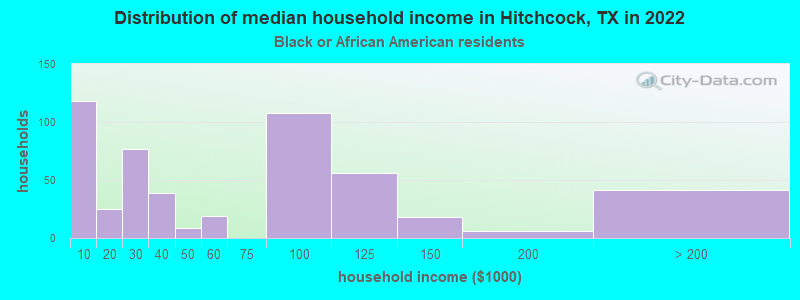
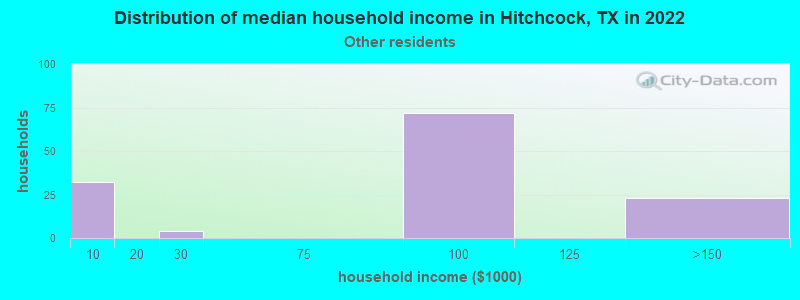
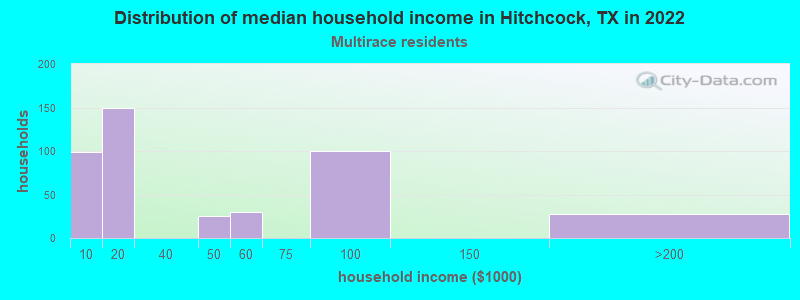
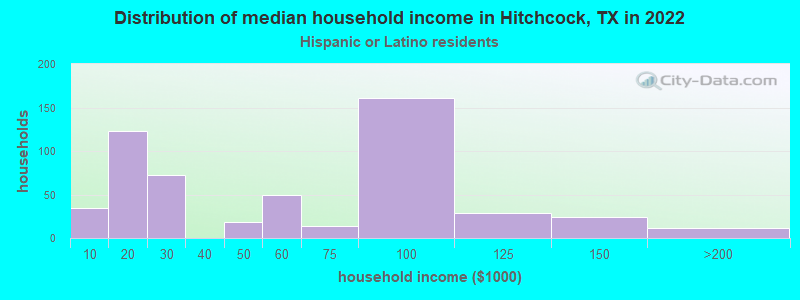
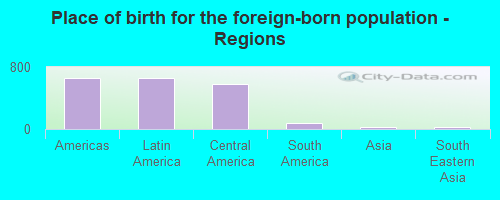
According to 2022 data, the most numerous races in Hitchcock, TX are Hispanic (2,660 residents), White alone (3,114 residents), and Black alone (1,514 residents). 76.4% of Hitchcock residents speak English at home. 9.0% of Hitchcock, TX residents are foreign-born (8.6% born in Latin America), which is 88.0% less than the foreign-born rate of 17.0% across the entire state of Texas.
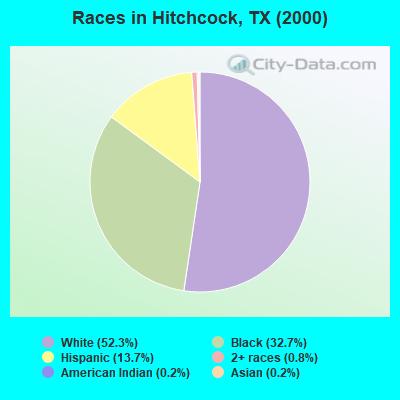
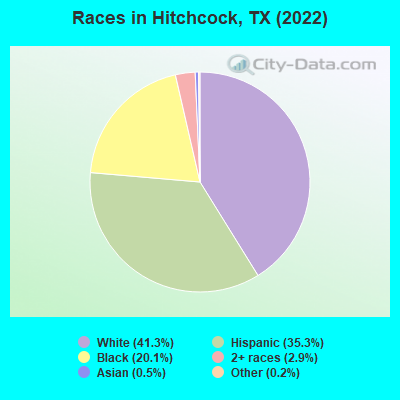
Race distribution in Hitchcock
2000 2022
10,933,313 52.4% White alone 6,669,666 32.0% Hispanic 2,364,255 11.3% Black alone 554,445 2.7% Asian alone 230,567 1.1% Two or more races 68,859 0.3% American Indian alone 19,958 0.10% Other race alone 10,757 0.05% Native Hawaiian and Other
12,070,642 40.2% Hispanic 11,683,430 38.9% White alone 3,508,706 11.7% Black alone 1,608,173 5.4% Asian alone 956,560 3.2% Two or more races 125,763 0.4% Other race alone 47,023 0.2% American Indian alone 29,275 0.10% Native Hawaiian and Other
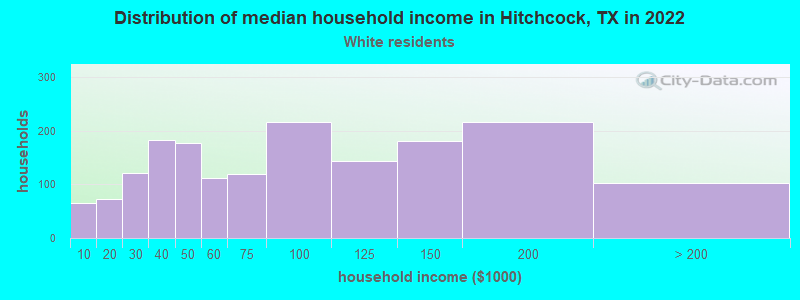
Income and house value in Hitchcock Median household income in 2022 $72,253 White non-Hispanic householders$59,997 Black householders$80,662 Some other race householders$56,835 Hispanic or Latino race householdersMedian 2022 house value $204,301 White Non-Hispanic householders$172,731 Black or African American householders$173,456 Some other race householders$170,553 Two or more races householders$174,908 Hispanic or Latino householders
Median age by race in Hitchcock
38.8 Median age for White residents40.3 37.4 24.4 Median age for Black or African American residents19.6 35.9 -668,041,236.4 Median age for American Indian / Alaska Native residents-513,227,512.7 -673,582,295.3 49.5 Median age for Asian residents-636,741,479.0 53.8 -581,560,283.1 Median age for Native Hawaiian / Pacific Islander residents-612,729,233.5 -577,777,777.2 30.1 Median age for Other race residents37.4 9.7 35.0 Median age for Two or more races residents30.1 41.0 46.3 Median age for White alone residents48.4 45.8 24.7 Median age for Hispanic or Latino residents27.8 23.7
Owner/renter occupied households by race in Hitchcock
House owners and renters - White residents 1,290 74.1% Owner occupied451 25.9% Renter occupiedHouse owners and renters - Black or African American residents 315 60.7% Owner occupied204 39.3% Renter occupiedHouse owners and renters - Other race residents 121 78.4% Owner occupied33 21.6% Renter occupiedHouse owners and renters - Two or more races residents 327 82.2% Owner occupied71 17.8% Renter occupiedHouse owners and renters - White alone residents 1,249 77.0% Owner occupied373 23.0% Renter occupiedHouse owners and renters - Hispanic or Latino residents 314 63.5% Owner occupied181 36.5% Renter occupied
Language usage in Hitchcock
English speakers - Total 76.4% of residents of Hitchcock speak English at home.
23.3% of residents speak Spanish at home 1,118 68.9% Speak English very well504 31.1% Speak English less than very well0.4% of residents speak other language at home 7 22.6% Speak English very well24 77.4% Speak English less than very well
English speakers - Born in the United States 88.3% of residents of Hitchcock speak English at home.
11.1% of residents speak Spanish at home 145 100.0% Speak English very well0.7% of residents speak other language at home 9 100.0% Speak English less than very well
English speakers - Native, born elsewhere 38.5% of residents of Hitchcock speak English at home.
65.4% of residents speak Spanish at home 34 100.0% Speak English very well
English speakers - Foreign-born 2.2% of residents of Hitchcock speak English at home.
97.2% of residents speak Spanish at home 365 50.8% Speak English very well354 49.2% Speak English less than very well1.8% of residents speak other language at home 13 100.0% Speak English less than very well
White (Caucasian) - Speak another language Native:
6.2% (219)Foreign-born:
75.3% (117)
Asian - Speak only English Native:
100.0% (14)Foreign-born:
36.9% (9)
Other race - Speak only English Native:
10.7% (35)Foreign-born:
4.5% (10)
Other race - Speak another language Native:
84.3% (278)Foreign-born:
94.2% (199)
Two or more races - Speak another language Native:
39.8% (419)Foreign-born:
100.0% (562)
Hispanic or Latino - Speak only English Native:
49.9% (833)Foreign-born:
0.8% (6)
Hispanic or Latino - Speak another language Native:
50.2% (839)Foreign-born:
99.0% (709)
Foreign-born residents in Hitchcock 681 residents are foreign born (8.6% Latin America ).
This city:
9.0%Texas:
17.1%
Marital status for residents in Hitchcock Marital status - White (Caucasian) population 15 years and over
Males 23.9% Never married64.8% Now married0.6% Separated1.5% Widowed9.2% DivorcedFemales 27.9% Never married56.1% Now married0.3% Separated6.3% Widowed9.4% DivorcedWomen who gave birth in the past 12 months Now married:
54.1% (52)Unmarried:
45.9% (44)
Women who did not give birth in the past 12 months Now married:
44.8% (358)Unmarried:
55.2% (441)
Marital status - Black or African American population 15 years and over
Males 44.6% Never married42.9% Now married2.8% Separated9.8% Widowed0.0% DivorcedFemales 39.8% Never married25.3% Now married5.4% Separated16.6% Widowed12.9% DivorcedWomen who did not give birth in the past 12 months Now married:
29.2% (121)Unmarried:
70.8% (294)
Marital status - Other race population 15 years and over
Males 35.7% Never married3.6% Now married0.0% Separated2.1% Widowed58.6% DivorcedFemales 57.5% Never married42.5% Now married0.0% Separated0.0% Widowed0.0% DivorcedWomen who gave birth in the past 12 months Now married:
100.0% (23)Unmarried:
0.0% (0)
Women who did not give birth in the past 12 months Now married:
11.5% (10)Unmarried:
88.5% (80)
Marital status - Two or more races population 15 years and over
Males 28.2% Never married58.1% Now married3.1% Separated0.0% Widowed10.6% DivorcedFemales 4.1% Never married31.0% Now married16.1% Separated36.0% Widowed12.9% DivorcedWomen who did not give birth in the past 12 months Now married:
58.6% (160)Unmarried:
41.4% (113)
Marital status - White alone, not Hispanic / Latino population 15 years and over
Males 20.5% Never married66.3% Now married0.8% Separated1.3% Widowed11.1% DivorcedFemales 21.9% Never married58.0% Now married0.3% Separated8.0% Widowed11.9% DivorcedWomen who gave birth in the past 12 months Now married:
86.4% (50)Unmarried:
13.6% (8)
Women who did not give birth in the past 12 months Now married:
43.8% (260)Unmarried:
56.2% (334)
Marital status - Hispanic or Latino population 15 years and over
Males 33.3% Never married51.1% Now married1.3% Separated1.3% Widowed12.9% DivorcedFemales 36.5% Never married48.1% Now married0.1% Separated15.2% Widowed0.0% DivorcedWomen who gave birth in the past 12 months Now married:
33.3% (22)Unmarried:
66.7% (45)
Women who did not give birth in the past 12 months Now married:
52.8% (269)Unmarried:
47.2% (241)
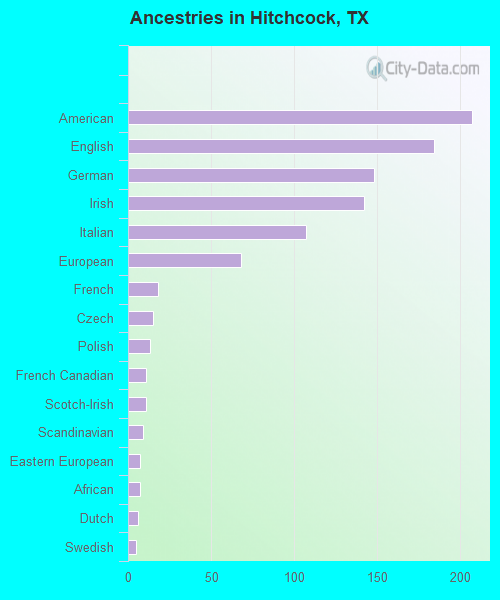
Ancestries in Hitchcock
207 5.5% American184 4.9% English148 3.9% German142 3.8% Irish107 2.8% Italian68 1.8% European18 0.5% French15 0.4% Czech13 0.3% Polish11 0.3% French Canadian11 0.3% Scotch-Irish9 0.2% Scandinavian7 0.2% Eastern European7 0.2% African6 0.2% Dutch5 0.1% Swedish
Children Nativity (place of birth) in Hitchcock
Children under 6 years - Living with two parents Both parents native 249 100.0% NativeBoth parents foreign-born 59 73.6% Native21 26.4% Foreign-bornOne native, one foreign-born parent 71 100.0% NativeChildren under 6 years - Living with one parent Native parent 222 100.0% NativeForeign-born parent 58 100.0% NativeChildren 6 to 17 years - Living with two parents Both parents native 488 100.0% NativeBoth parents foreign-born 184 100.0% NativeOne native, one foreign-born parent 57 100.0% NativeChildren 6 to 17 years - Living with one parent Native parent 308 100.0% NativeForeign-born parent 243 52.1% Native224 47.9% Foreign-born
Grandparents responsible for own grandchildren in Hitchcock
Grandparents (30 to 59 years) White / Caucasian 52 100.0% Not responsible for grandchildrenBlack or African American 5 100.0% Responsible for grandchildrenOther race 7 100.0% Not responsible for grandchildrenTwo or more races 26 100.0% Not responsible for grandchildrenWhite alone, not Hispanic / Latino 73 100.0% Not responsible for grandchildrenHispanic or Latino 18 100.0% Not responsible for grandchildrenGrandparents (60 years and over) White / Caucasian 3 21.2% Responsible for grandchildren12 78.8% Not responsible for grandchildrenBlack or African American 27 100.0% Responsible for grandchildrenTwo or more races 128 100.0% Not responsible for grandchildrenWhite alone, not Hispanic / Latino 4 21.1% Responsible for grandchildren14 78.9% Not responsible for grandchildrenHispanic or Latino 108 100.0% Not responsible for grandchildren