Races in Hollis, New Hampshire (NH) Detailed Stats
Ancestries, Foreign-born residents, place of birth

Recent posts about races in Hollis, New Hampshire on our local forum with over 2,400,000 registered users:
 | Best family towns for Boston Commute (5 replies) |
| NH Sale & Income tax offset with property taxes? (150 replies) |
| Buying a Home in Nashua/Bedford/Hollis or MA (12 replies) |
| Well NH, its been nice but (85 replies) |
| Brookline and Hollis NH questions (18 replies) |
| Manchester Suburbs (15 replies) |
5.0% of Hollis, NH residents are foreign-born (3.0% born in Europe, 1.1% born in Asia, 0.8% born in North America), which is about the same as the foreign-born rate of 5.0% across the entire state of New Hampshire.
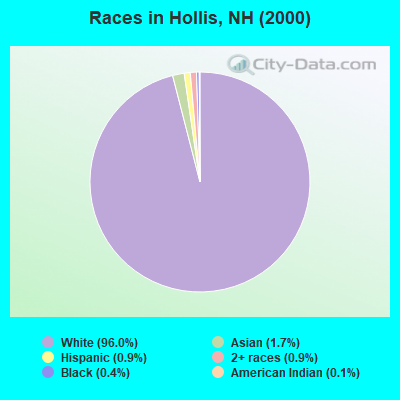
Race distribution in Hollis

- 6,73296.0%White alone
- 1161.7%Asian alone
- 650.9%Hispanic
- 630.9%Two or more races
- 290.4%Black alone
- 80.1%American Indian alone
- 10.01%Other race alone
- 10.01%Native Hawaiian and Other
Pacific Islander alone
2000
2022
-
- 1,175,25295.1%White alone
- 20,4891.7%Hispanic
- 15,8031.3%Asian alone
- 11,6060.9%Two or more races
- 8,3540.7%Black alone
- 2,6980.2%American Indian alone
- 1,2540.1%Other race alone
- 3300.03%Native Hawaiian and Other
Pacific Islander alone

-
- 1,208,10186.6%White alone
- 63,4794.5%Hispanic
- 60,7244.4%Two or more races
- 36,5192.6%Asian alone
- 17,9311.3%Black alone
- 6,6150.5%Other race alone
- 1,0140.07%American Indian alone
- 8480.06%Native Hawaiian and Other
Pacific Islander alone

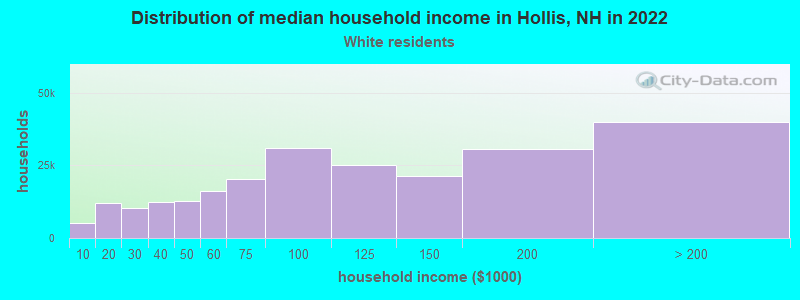
Income and house value in Hollis
- Median household income in 2022
- $162,462White non-Hispanic householders
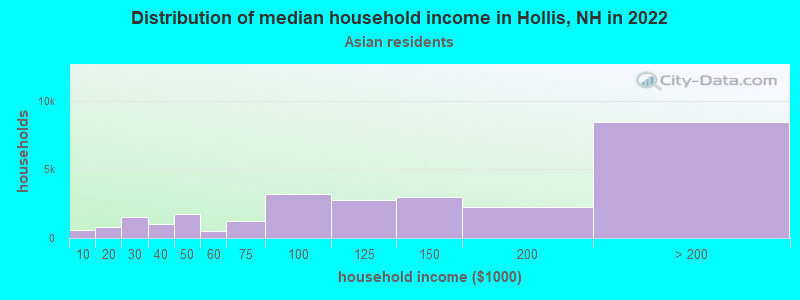
- over $200,000Asian householders
- over $200,000Some other race householders
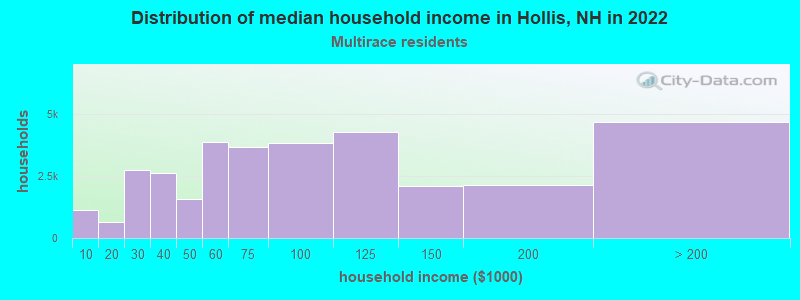
- over $200,000Two or more races householders
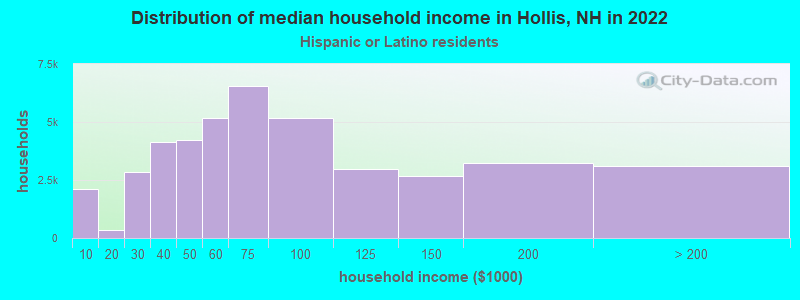
- over $200,000Hispanic or Latino race householders
- Median 2022 house value
- $788,835White Non-Hispanic householders
- over $1,000,000Asian householders
- $676,660Some other race householders
- $866,726Two or more races householders
- $751,845Hispanic or Latino householders
Household income for White non-Hispanic householders
Household income for Asian householders
Household income for Two or more races householders
Household income for Hispanic or Latino race householders
Foreign-born residents in Hollis
348 residents are foreign born (3.0% Europe, 1.1% Asia, 0.8% North America).
| This city: | 5.0% |
| New Hampshire: | 4.4% |
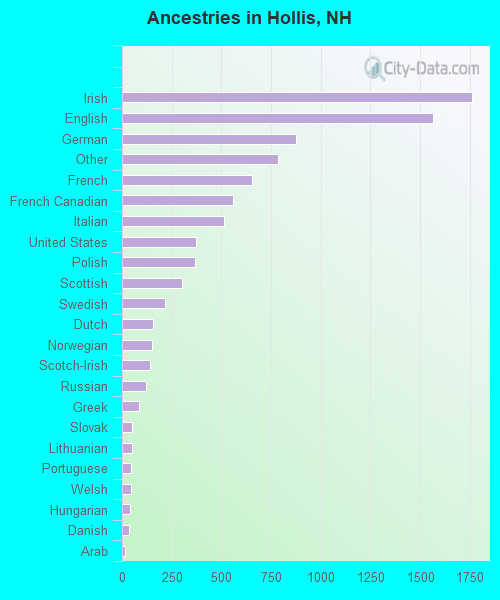
Ancestries in Hollis

- 1,75919.7%Irish
- 1,56317.5%English
- 8749.8%German
- 7848.8%Other
- 6537.3%French
- 5616.3%French Canadian
- 5125.7%Italian
- 3724.2%United States
- 3674.1%Polish
- 3043.4%Scottish
- 2152.4%Swedish
- 1571.8%Dutch
- 1491.7%Norwegian
- 1411.6%Scotch-Irish
- 1231.4%Russian
- 861.0%Greek
- 510.6%Slovak
- 500.6%Lithuanian
- 440.5%Portuguese
- 430.5%Welsh
- 400.4%Hungarian
- 360.4%Danish
- 170.2%Arab
- 100.1%Ukrainian
- 90.1%Subsaharan African
- 80.09%Czech
Zip codes: 03049.