Races in Humble, Texas (TX) Detailed Stats
Ancestries, Foreign-born residents, place of birth
Settings
X


Recent posts about races in Humble, Texas on our local forum with over 2,400,000 registered users:
 | Richmond vs Manvel vs Humble/Atascocita (33 replies) |
| Houston CORE developments thread (707 replies) |
| The DFW housing market is NOT sustainable (685 replies) |
| DOWNTOWN BIG"6"..What direction are they going??? (1245 replies) |
| Which city is safer between Dallas or Houston? (72 replies) |
| Most “complete” suburb in Houston? (87 replies) |
Latest news about races in Humble, TX collected exclusively by city-data.com from local newspapers, TV, and radio stations
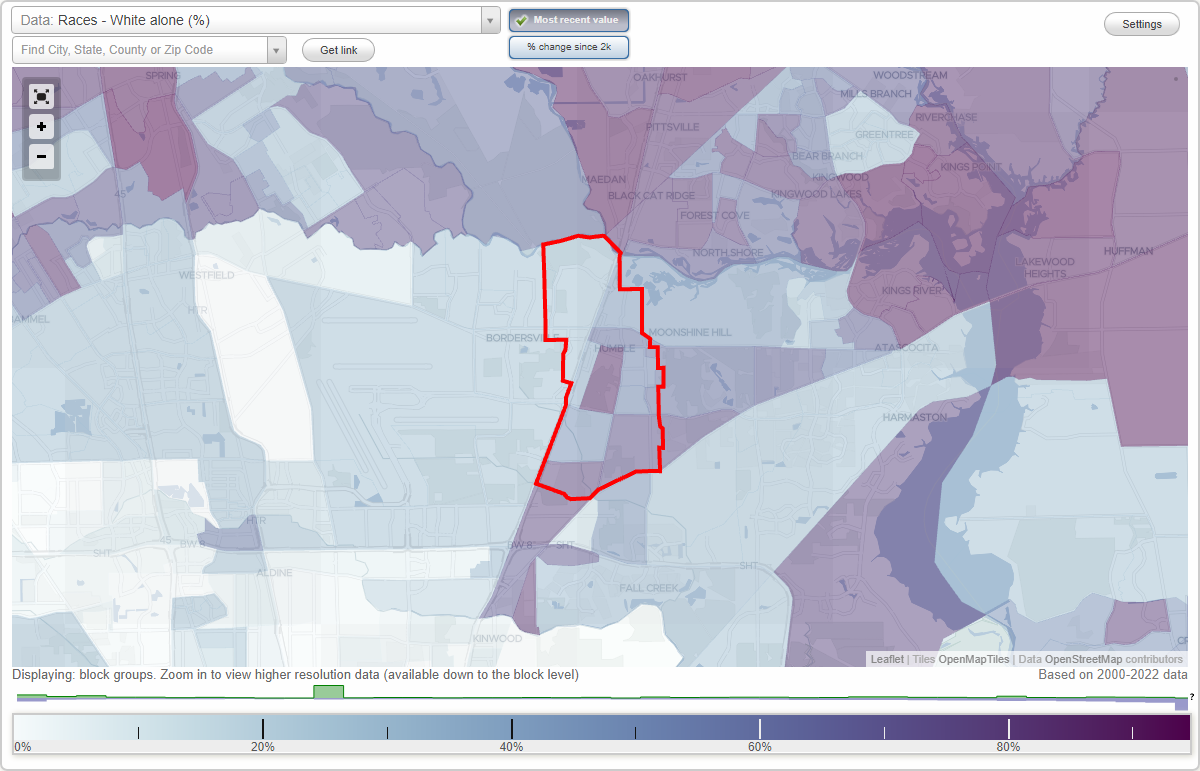
According to 2022 data, the most numerous races in Humble, TX are Hispanic (8,447 residents), White alone (3,717 residents), and Black alone (4,089 residents). 59.5% of Humble residents speak English at home. 18.5% of Humble, TX residents are foreign-born (15.0% born in Latin America), which is 7.9% greater than the foreign-born rate of 17.0% across the entire state of Texas.
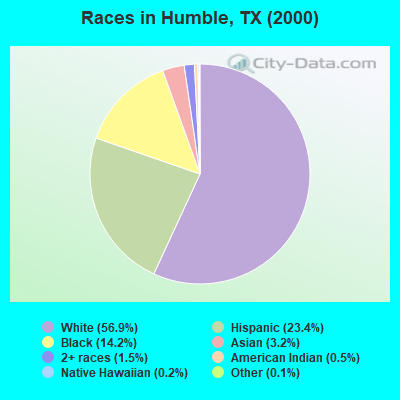
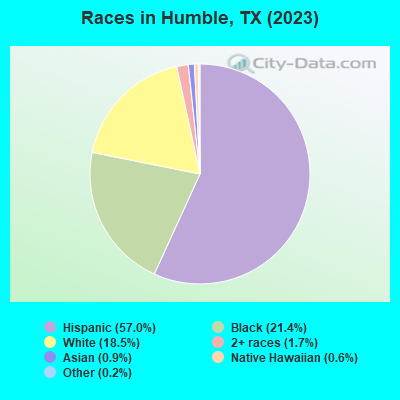
Race distribution in Humble
2000
2022

- 8,29556.9%White alone
- 3,40623.4%Hispanic
- 2,07514.2%Black alone
- 4683.2%Asian alone
- 2171.5%Two or more races
- 720.5%American Indian alone
- 300.2%Native Hawaiian and Other
Pacific Islander alone - 160.1%Other race alone
-
- 8,44750.4%Hispanic
- 4,08924.4%Black alone
- 3,71722.2%White alone
- 2231.3%Asian alone
- 1160.7%Two or more races
- 960.6%Native Hawaiian and Other
Pacific Islander alone - 300.2%Other race alone
2000
2022
-
- 10,933,31352.4%White alone
- 6,669,66632.0%Hispanic
- 2,364,25511.3%Black alone
- 554,4452.7%Asian alone
- 230,5671.1%Two or more races
- 68,8590.3%American Indian alone
- 19,9580.10%Other race alone
- 10,7570.05%Native Hawaiian and Other
Pacific Islander alone

-
- 12,070,64240.2%Hispanic
- 11,683,43038.9%White alone
- 3,508,70611.7%Black alone
- 1,608,1735.4%Asian alone
- 956,5603.2%Two or more races
- 125,7630.4%Other race alone
- 47,0230.2%American Indian alone
- 29,2750.10%Native Hawaiian and Other
Pacific Islander alone

Income and house value in Humble
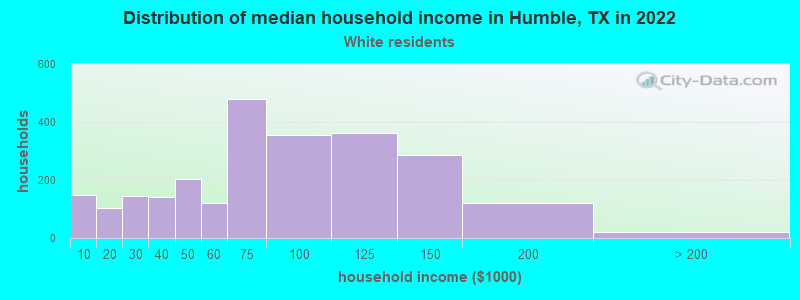
- Median household income in 2022
- $60,508White non-Hispanic householders
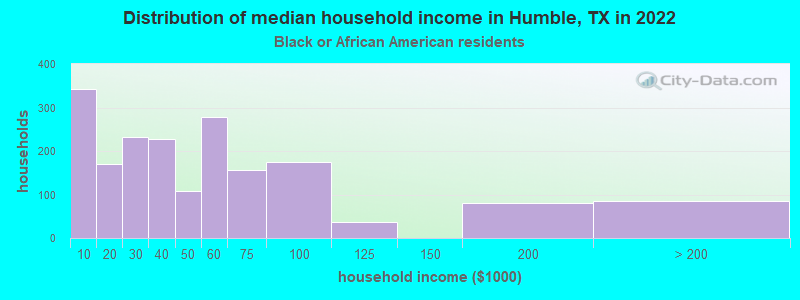
- $39,118Black householders
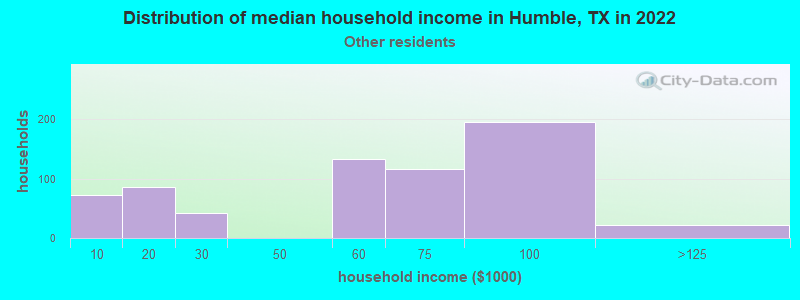
- $51,653Some other race householders
- $66,994Hispanic or Latino race householders
- Median 2022 house value
- $204,781White Non-Hispanic householders
- $197,545Black or African American householders
- $370,488American Indian or Alaska Native householders
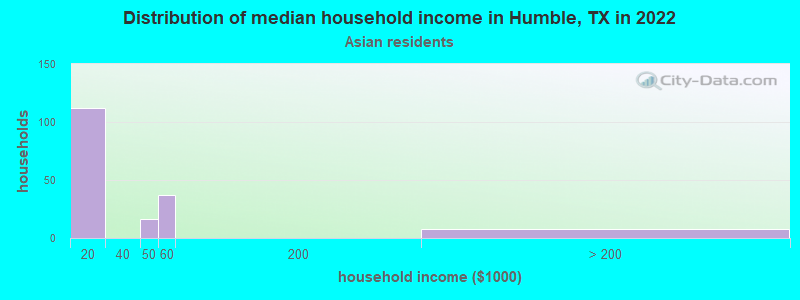
- $277,142Asian householders
- $224,319Some other race householders
- $291,373Two or more races householders
- $219,736Hispanic or Latino householders
Household income for White non-Hispanic householders
Household income for Black householders
Household income for Asian householders
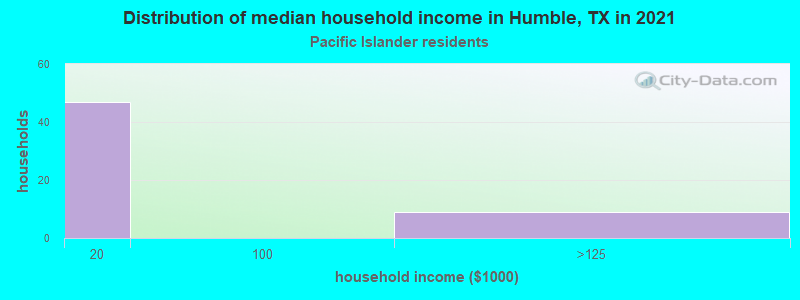
Household income for Native Hawaiian and other Pacific Islander householders
Household income for Some other race householders
Household income for Two or more races householders
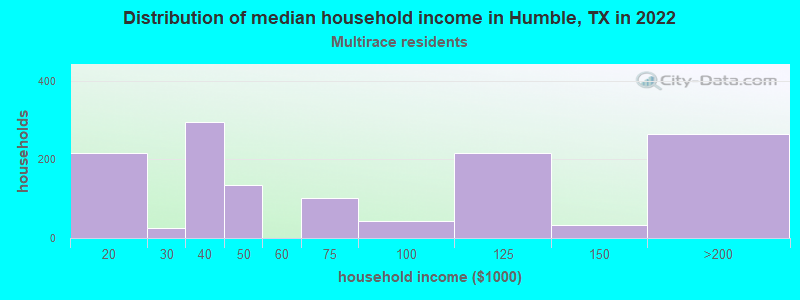
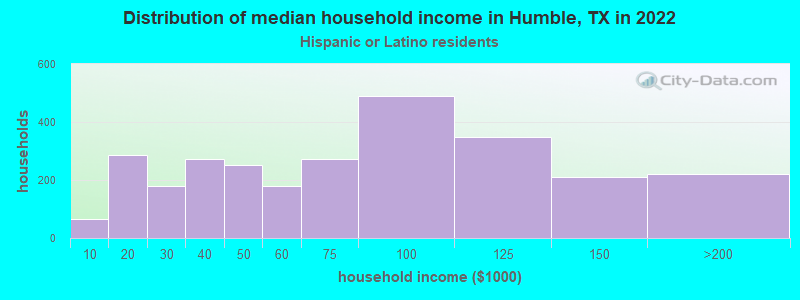
Household income for Hispanic or Latino race householders
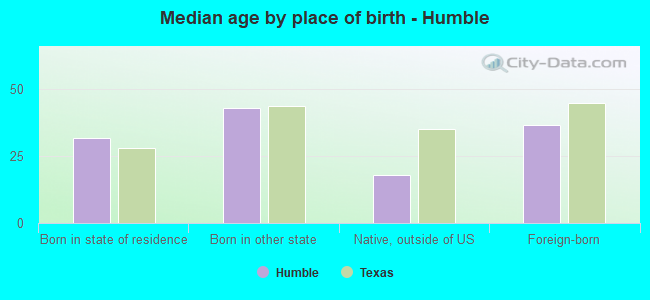
Median age by race in Humble
- 38.9Median age for White residents
- 39.3Males
- 37.6Females
- 32.7Median age for Black or African American residents
- 23.3Males
- 35.6Females
- -618,034,447.2Median age for American Indian / Alaska Native residents
- -598,187,310.6Males
- -652,037,616.9Females
- 48.8Median age for Asian residents
- 48.6Males
- 39.0Females
- 37.0Median age for Native Hawaiian / Pacific Islander residents
- 30.2Males
- 16.7Females
- 31.7Median age for Other race residents
- 31.5Males
- 31.2Females
- 27.7Median age for Two or more races residents
- 33.1Males
- 22.5Females
- 54.8Median age for White alone residents
- 50.4Males
- 58.9Females
- 31.1Median age for Hispanic or Latino residents
- 32.7Males
- 25.0Females
Owner/renter occupied households by race in Humble
- House owners and renters - White residents
- 1,06643.7%Owner occupied
- 1,37556.3%Renter occupied
- House owners and renters - Black or African American residents
- 33417.7%Owner occupied
- 1,55182.3%Renter occupied
- House owners and renters - American Indian / Alaska Native residents
- 41100.0%Renter occupied
- House owners and renters - Asian residents
- 85.1%Owner occupied
- 14594.9%Renter occupied
- House owners and renters - Native Hawaiian / Pacific Islander residents
- 2562.4%Owner occupied
- 1537.6%Renter occupied
- House owners and renters - Other race residents
- 39456.3%Owner occupied
- 30643.7%Renter occupied
- House owners and renters - Two or more races residents
- 68849.5%Owner occupied
- 70250.5%Renter occupied
- House owners and renters - White alone residents
- 95250.9%Owner occupied
- 91949.1%Renter occupied
- House owners and renters - Hispanic or Latino residents
- 1,08038.1%Owner occupied
- 1,75461.9%Renter occupied
Language usage in Humble
- English speakers - Total
- 59.5% of residents of Humble speak English at home.
- 37.0% of residents speak Spanish at home
- 4,04468.2%Speak English very well
- 1,88931.8%Speak English less than very well
- 3.1% of residents speak other language at home
- 23548.0%Speak English very well
- 25552.0%Speak English less than very well
- English speakers - Born in the United States
- 76.9% of residents of Humble speak English at home.
- 19.4% of residents speak Spanish at home
- 491100.0%Speak English very well
- 3.0% of residents speak other language at home
- 76100.0%Speak English very well
- English speakers - Native, born elsewhere
- 55.1% of residents of Humble speak English at home.
- 41.0% of residents speak Spanish at home
- 188100.0%Speak English very well
- English speakers - Foreign-born
- 6.3% of residents of Humble speak English at home.
- 83.0% of residents speak Spanish at home
- 82632.8%Speak English very well
- 1,69067.2%Speak English less than very well
- 11.7% of residents speak other language at home
- 10830.4%Speak English very well
- 24769.6%Speak English less than very well
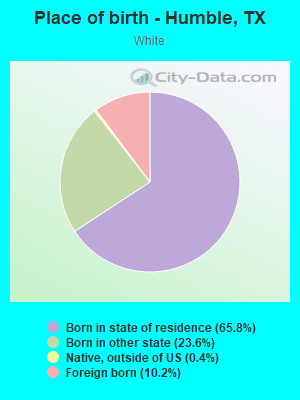
White (Caucasian) - Speak only English
| Native: | 85.8% (4,171) |
| Foreign-born: | 10.8% (61) |
White (Caucasian) - Speak another language
| Native: | 14.0% (682) |
| Foreign-born: | 82.5% (466) |
Black or African American - Speak only English
| Native: | 97.0% (3,714) |
| Foreign-born: | 27.4% (68) |
Black or African American - Speak another language
| Native: | 2.8% (109) |
| Foreign-born: | 74.3% (184) |
Asian - Speak only English
| Native: | 54.7% (23) |
| Foreign-born: | 2.8% (5) |
Asian - Speak another language
| Native: | 45.5% (19) |
| Foreign-born: | 97.2% (175) |
Native Hawaiian / Pacific Islander - Speak only English
| Native: | 98.9% (110) |
| Foreign-born: | 14.0% (5) |
Other race - Speak only English
| Native: | 17.9% (226) |
| Foreign-born: | 3.5% (25) |
Other race - Speak another language
| Native: | 81.4% (1,025) |
| Foreign-born: | 96.6% (697) |
Two or more races - Speak another language
| Native: | 63.9% (1,974) |
| Foreign-born: | 100.0% (1,158) |
White alone - Speak only English
| Native: | 95.8% (3,430) |
| Foreign-born: | 100.0% (36) |
Hispanic or Latino - Speak only English
| Native: | 38.4% (2,078) |
| Foreign-born: | 2.4% (63) |
Hispanic or Latino - Speak another language
| Native: | 61.4% (3,329) |
| Foreign-born: | 97.5% (2,524) |
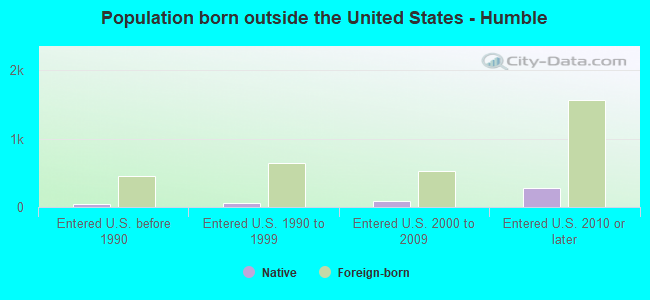
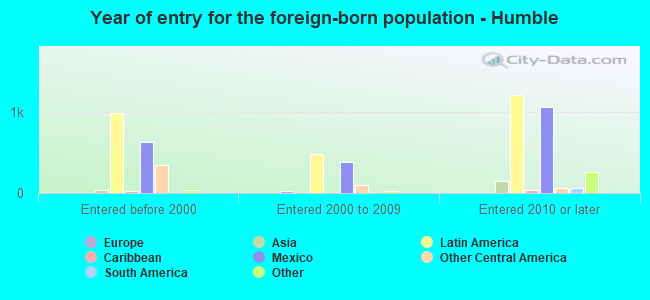
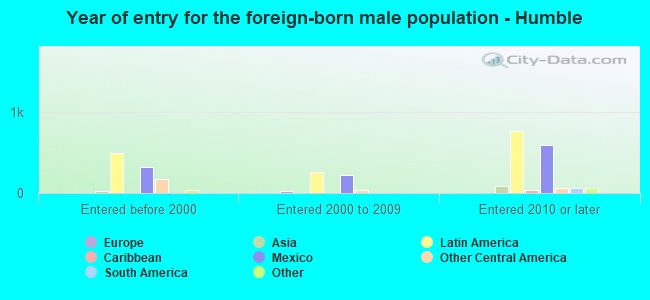
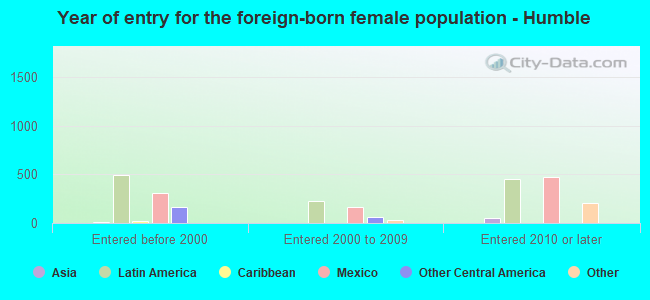
Foreign-born residents in Humble
3,094 residents are foreign born (15.0% Latin America).
| This city: | 18.5% |
| Texas: | 17.1% |
Marital status for residents in Humble
Marital status - White (Caucasian) population 15 years and over
- Males
- 34.3%Never married
- 42.4%Now married
- 2.2%Separated
- 6.7%Widowed
- 14.4%Divorced
- Females
- 24.0%Never married
- 43.7%Now married
- 4.3%Separated
- 7.1%Widowed
- 20.9%Divorced
Women who did not give birth in the past 12 months
| Now married: | 44.8% (521) |
| Unmarried: | 55.2% (642) |
Marital status - Black or African American population 15 years and over
- Males
- 65.6%Never married
- 26.3%Now married
- 3.0%Separated
- 0.0%Widowed
- 5.1%Divorced
- Females
- 47.9%Never married
- 22.3%Now married
- 9.9%Separated
- 11.0%Widowed
- 8.8%Divorced
Women who did not give birth in the past 12 months
| Now married: | 37.4% (447) |
| Unmarried: | 62.6% (748) |
Marital status - Asian population 15 years and over
- Males
- 24.5%Never married
- 62.9%Now married
- 0.0%Separated
- 0.0%Widowed
- 12.6%Divorced
- Females
- 21.2%Never married
- 33.3%Now married
- 0.0%Separated
- 45.5%Widowed
- 0.0%Divorced
Women who did not give birth in the past 12 months
| Now married: | 40.7% (22) |
| Unmarried: | 59.3% (32) |
Marital status - Native Hawaiian / Pacific Islander population 15 years and over
- Males
- 53.7%Never married
- 15.9%Now married
- 30.5%Separated
- 0.0%Widowed
- 0.0%Divorced
- Females
- 0.0%Never married
- 100.0%Now married
- 0.0%Separated
- 0.0%Widowed
- 0.0%Divorced
Women who did not give birth in the past 12 months
| Now married: | 100.0% (15) |
| Unmarried: | 0.0% (0) |
Marital status - Other race population 15 years and over
- Males
- 43.6%Never married
- 26.1%Now married
- 0.0%Separated
- 19.7%Widowed
- 10.6%Divorced
- Females
- 37.3%Never married
- 47.0%Now married
- 5.9%Separated
- 4.5%Widowed
- 5.3%Divorced
Women who did not give birth in the past 12 months
| Now married: | 36.9% (226) |
| Unmarried: | 63.1% (387) |
Marital status - Two or more races population 15 years and over
- Males
- 22.3%Never married
- 66.9%Now married
- 5.7%Separated
- 0.0%Widowed
- 5.1%Divorced
- Females
- 49.5%Never married
- 34.3%Now married
- 1.5%Separated
- 7.6%Widowed
- 7.1%Divorced
Women who did not give birth in the past 12 months
| Now married: | 35.2% (635) |
| Unmarried: | 64.8% (1,171) |
Marital status - White alone, not Hispanic / Latino population 15 years and over
- Males
- 30.4%Never married
- 41.4%Now married
- 0.0%Separated
- 10.4%Widowed
- 17.7%Divorced
- Females
- 17.3%Never married
- 44.3%Now married
- 3.1%Separated
- 11.6%Widowed
- 23.8%Divorced
Women who did not give birth in the past 12 months
| Now married: | 50.7% (327) |
| Unmarried: | 49.3% (318) |
Marital status - Hispanic or Latino population 15 years and over
- Males
- 38.2%Never married
- 42.9%Now married
- 4.3%Separated
- 5.7%Widowed
- 8.9%Divorced
- Females
- 42.0%Never married
- 41.6%Now married
- 3.6%Separated
- 3.0%Widowed
- 9.9%Divorced
Women who did not give birth in the past 12 months
| Now married: | 37.8% (1,008) |
| Unmarried: | 62.2% (1,656) |
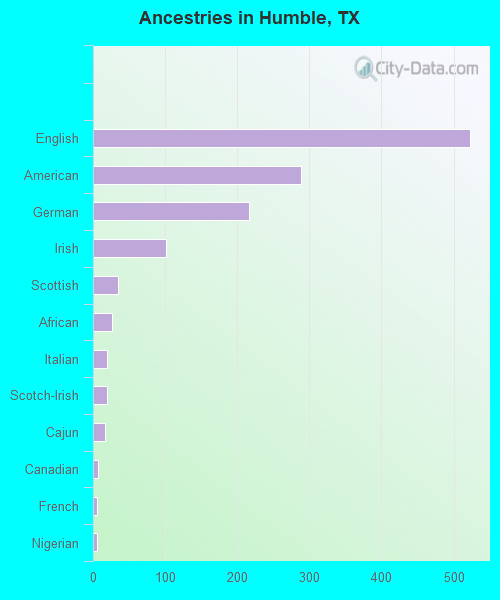
Ancestries in Humble

- 5235.2%English
- 2892.9%American
- 2162.2%German
- 1011.0%Irish
- 350.3%Scottish
- 270.3%African
- 190.2%Italian
- 190.2%Scotch-Irish
- 160.2%Cajun
- 70.07%Canadian
- 60.06%French
- 60.06%Nigerian
- 40.04%Czech
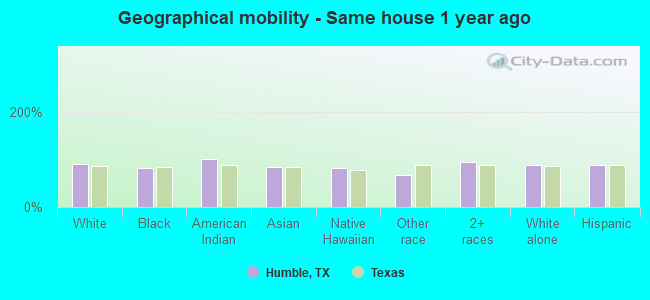
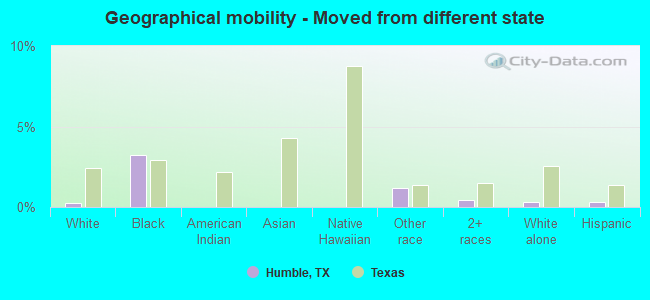
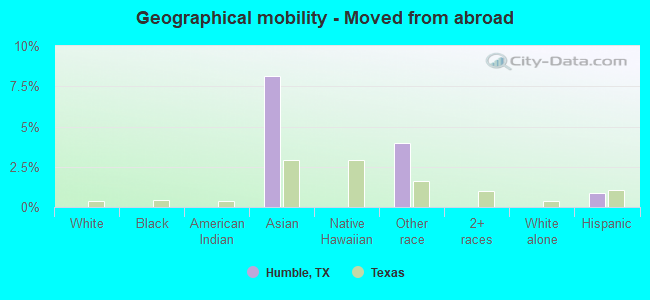
Geographical mobility in Humble

- Same house 1 year ago
- 5,00690.0%White (Caucasian)
- 3,45581.3%Black or African American
- 54100.0%American Indian / Alaska Native
- 18883.5%Asian
- 12380.9%Native Hawaiian / Pacific Islander
- 1,39267.1%Other race
- 4,15295.0%Two or more races
- 3,30488.8%White alone, not Hispanic / Latino
- 7,53489.1%Hispanic or Latino
-
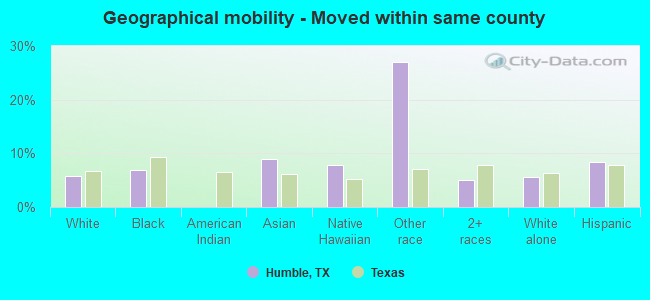
- Moved within same county
- 3215.8%White / Caucasian
- 2946.9%Black or African American
- 208.9%Asian
- 127.8%Native Hawaiian / Pacific Islander
- 56227.1%Other race
- 2195.0%Two or more races
- 2055.5%White alone, not Hispanic / Latino
- 7088.4%Hispanic or Latino
-
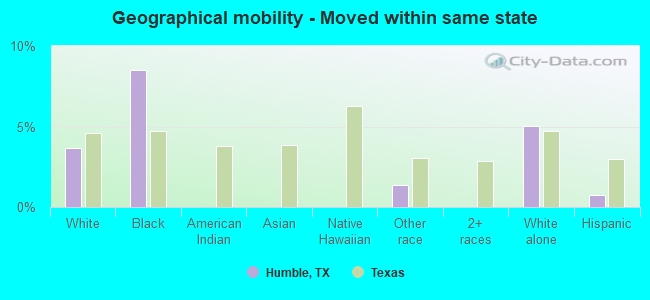
- Moved within same state
- 2053.7%White / Caucasian
- 3628.5%Black or African American
- 281.3%Other race
- 1875.0%White alone, not Hispanic / Latino
- 610.7%Hispanic or Latino
-
- Moved from different state
- 120.2%White / Caucasian
- 1383.3%Black or African American
- 251.2%Other race
- 180.4%Two or more races
- 120.3%White alone, not Hispanic / Latino
- 240.3%Hispanic or Latino
-
- Moved from abroad
- 188.1%Asian
- 824.0%Other race
- 750.9%Hispanic or Latino
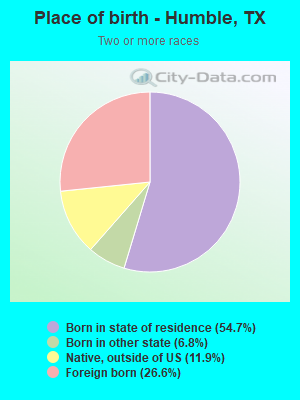
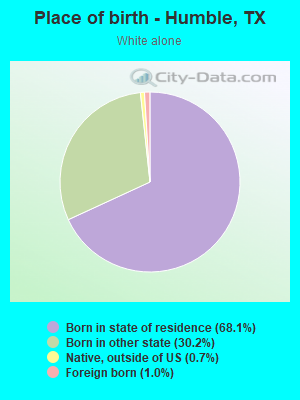
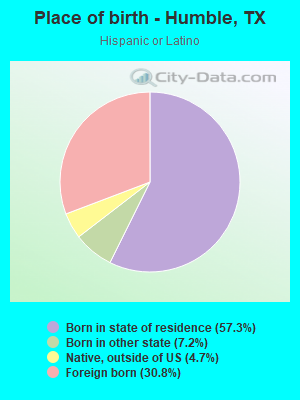
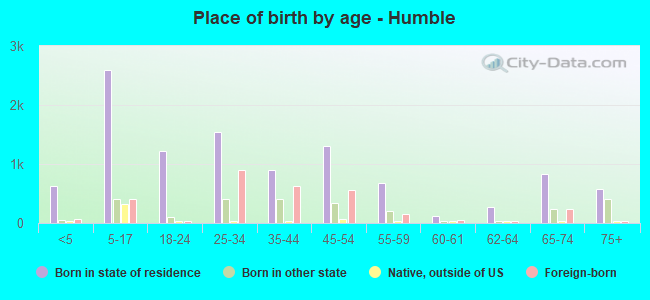
Children Nativity (place of birth) in Humble
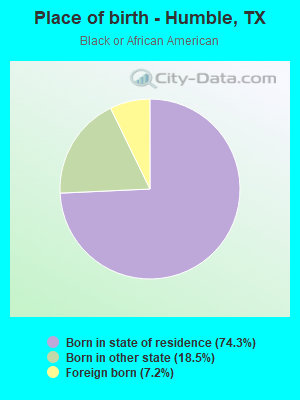
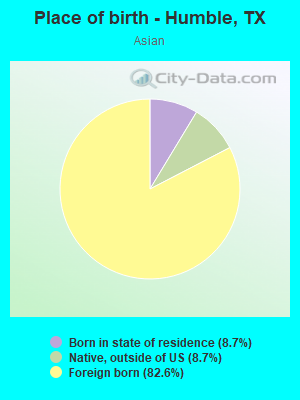
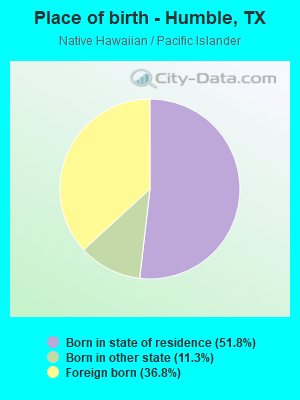
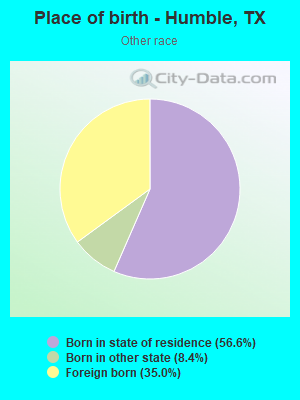
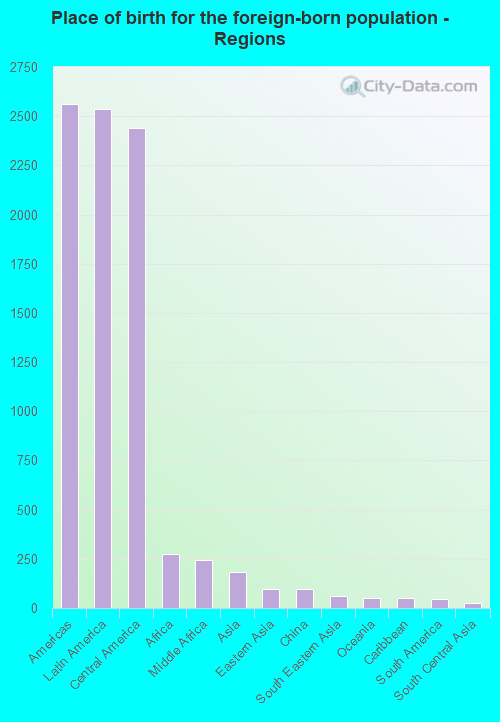
Place of birth for residents in Humble
![Place of birth for the foreign-born population - Regions]()
- 2,560Americas
- 2,539Latin America
- 2,439Central America
- 273Africa
- 245Middle Africa
- 184Asia
- 97Eastern Asia
- 97China
- 62South Eastern Asia
- 53Oceania
- 53Caribbean
- 46South America
- 24South Central Asia
- 22Eastern Africa
- 21Europe
- 21Western Europe
- 21Northern America
- 6Western Africa
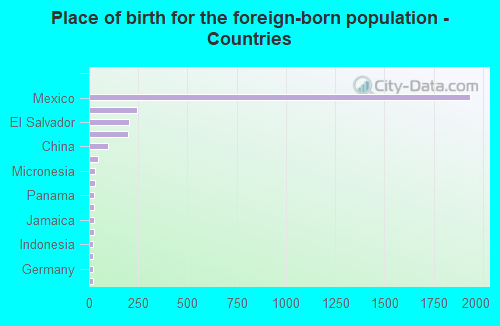
![Place of birth for the foreign-born population - Countries]()
- 1,935Mexico
- 245Cameroon
- 201El Salvador
- 199Honduras
- 97China
- 46Ecuador
- 33Micronesia
- 32Philippines
- 27Panama
- 26Dominican Republic
- 26Jamaica
- 24Pakistan
- 22Indonesia
- 22Kenya
- 21Germany
- 21Canada
- 7Vietnam
- 6Nigeria
Grandparents responsible for own grandchildren in Humble
Zip codes: 77338.