Races in Isleta Pueblo, New Mexico (NM) Detailed Stats
Ancestries, Foreign-born residents, place of birth
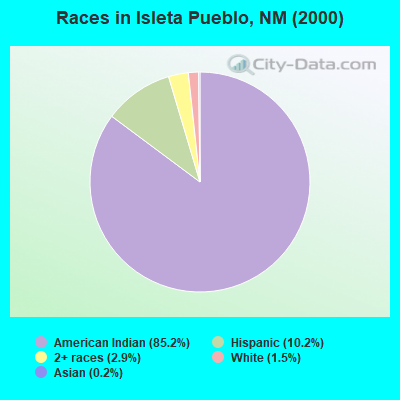
Race distribution in Isleta Pueblo

- 1,87685.2%American Indian alone
- 22510.2%Hispanic
- 632.9%Two or more races
- 321.5%White alone
- 40.2%Asian alone
- 10.05%Black alone
2000
2022
-
- 813,49544.7%White alone
- 765,38642.1%Hispanic
- 161,4608.9%American Indian alone
- 30,6541.7%Black alone
- 25,7931.4%Two or more races
- 18,2571.0%Asian alone
- 3,0090.2%Other race alone
- 9920.05%Native Hawaiian and Other
Pacific Islander alone

-
- 1,059,86750.2%Hispanic
- 735,47834.8%White alone
- 171,8088.1%American Indian alone
- 65,0843.1%Two or more races
- 36,8701.7%Black alone
- 35,8701.7%Asian alone
- 7,5820.4%Other race alone
- 7850.04%Native Hawaiian and Other
Pacific Islander alone

Income and house value in Isleta Pueblo
- Median household income in 2022
- $103,800White non-Hispanic householders
- $46,722American Indian and Alaska Native householders
- $94,585Asian householders
- $4,674Some other race householders
- $23,079Two or more races householders
- $145,155Hispanic or Latino race householders
- Median 2022 house value
- $135,021White Non-Hispanic householders
- $178,396American Indian or Alaska Native householders
- $262,347Asian householders
- $64,129Some other race householders
- $135,954Two or more races householders
- $116,599Hispanic or Latino householders
Household income for White non-Hispanic householders

Household income for American Indian and Alaska Native householders

Household income for Asian householders

Household income for Two or more races householders

Household income for Hispanic or Latino race householders

Zip code: 87022