Races in Jerome, Idaho (ID) Detailed Stats
Data:
Races - White alone (%)
Races - White alone (% change since 2000)
Races - Black alone (%)
Races - Black alone (% change since 2000)
Races - American Indian alone (%)
Races - American Indian alone (% change since 2000)
Races - Asian alone (%)
Races - Asian alone (% change since 2000)
Races - Hispanic (%)
Races - Hispanic (% change since 2000)
Races - Native Hawaiian and Other Pacific Islander alone (%)
Races - Native Hawaiian and Other Pacific Islander alone (% change since 2000)
Races - Two or more races(%)
Races - Two or more races(% change since 2000)
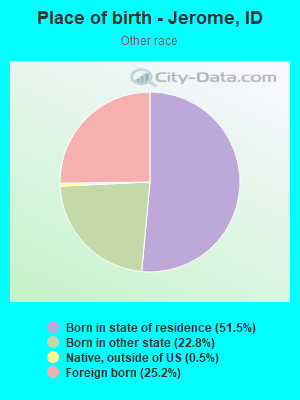
Races - Other race alone (%)
Races - Other race alone (% change since 2000)
Racial diversity
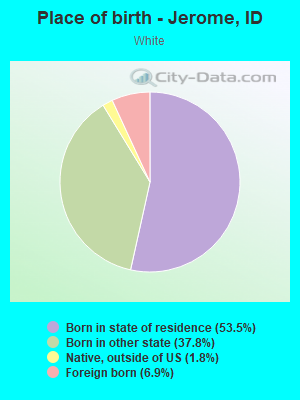
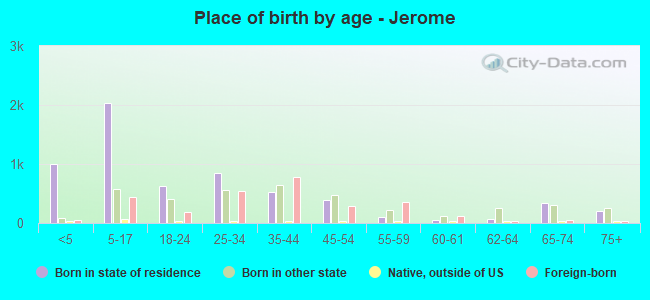
Place of birth - Born in state of residence (%)
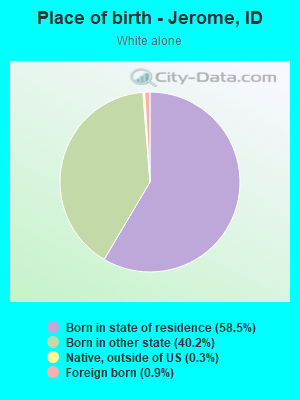
Place of birth - Born in state of residence (%) - White
Place of birth - Born in state of residence (%) - Black or African American
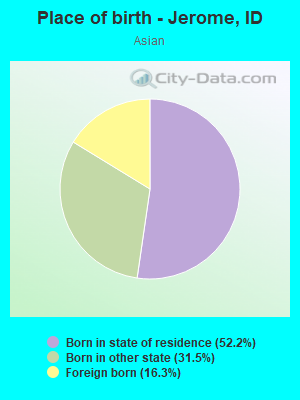
Place of birth - Born in state of residence (%) - Asian
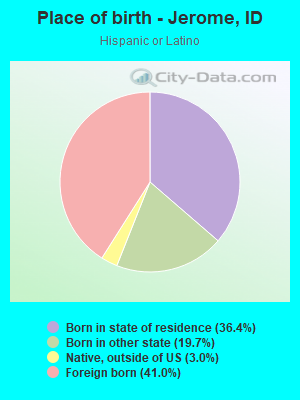
Place of birth - Born in state of residence (%) - Hispanic or Latino
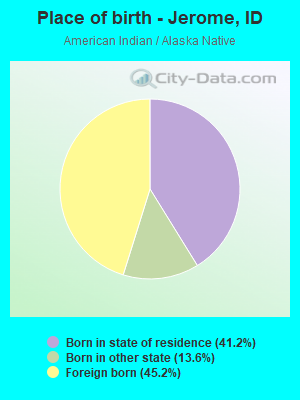
Place of birth - Born in state of residence (%) - American Indian and Alaska Native
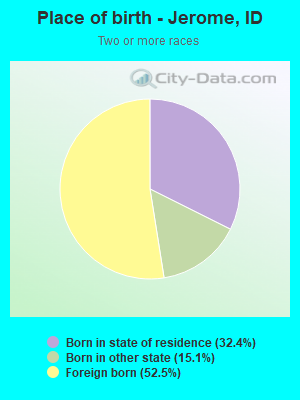
Place of birth - Born in state of residence (%) - Multirace
Place of birth - Born in state of residence (%) - Other Race
Place of birth - Born in other state (%)
Place of birth - Born in other state (%) - White
Place of birth - Born in other state (%) - Black or African American
Place of birth - Born in other state (%) - Asian
Place of birth - Born in other state (%) - Hispanic or Latino
Place of birth - Born in other state (%) - American Indian and Alaska Native
Place of birth - Born in other state (%) - Multirace
Place of birth - Born in other state (%) - Other Race
Place of birth - Native, outside of US (%)
Place of birth - Native, outside of US (%) - White
Place of birth - Native, outside of US (%) - Black or African American
Place of birth - Native, outside of US (%) - Asian
Place of birth - Native, outside of US (%) - Hispanic or Latino
Place of birth - Native, outside of US (%) - American Indian and Alaska Native
Place of birth - Native, outside of US (%) - Multirace
Place of birth - Native, outside of US (%) - Other Race
Place of birth - Foreign born (%)
Place of birth - Foreign born (%) - White
Place of birth - Foreign born (%) - Black or African American
Place of birth - Foreign born (%) - Asian
Place of birth - Foreign born (%) - Hispanic or Latino
Place of birth - Foreign born (%) - American Indian and Alaska Native
Place of birth - Foreign born (%) - Multirace
Place of birth - Foreign born (%) - Other Race
Residents speaking English at home (%)
Residents speaking English at home - Born in the United States (%)
Residents speaking English at home - Native, born elsewhere (%)
Residents speaking English at home - Foreign born (%)
Residents speaking Spanish at home (%)
Residents speaking Spanish at home - Born in the United States (%)
Residents speaking Spanish at home - Native, born elsewhere (%)
Residents speaking Spanish at home - Foreign born (%)
Residents speaking other language at home (%)
Residents speaking other language at home - Born in the United States (%)
Residents speaking other language at home - Native, born elsewhere (%)
Residents speaking other language at home - Foreign born (%)
Marital status - Never married (%)
Marital status - Now married (%)
Marital status - Separated (%)
Marital status - Widowed (%)
Marital status - Divorced (%)
Ancestries Reported - Arab (%)
Ancestries Reported - Czech (%)
Ancestries Reported - Danish (%)
Ancestries Reported - Dutch (%)
Ancestries Reported - English (%)
Ancestries Reported - French (%)
Ancestries Reported - French Canadian (%)
Ancestries Reported - German (%)
Ancestries Reported - Greek (%)
Ancestries Reported - Hungarian (%)
Ancestries Reported - Irish (%)
Ancestries Reported - Italian (%)
Ancestries Reported - Lithuanian (%)
Ancestries Reported - Norwegian (%)
Ancestries Reported - Polish (%)
Ancestries Reported - Portuguese (%)
Ancestries Reported - Russian (%)
Ancestries Reported - Scotch-Irish (%)
Ancestries Reported - Scottish (%)
Ancestries Reported - Slovak (%)
Ancestries Reported - Subsaharan African (%)
Ancestries Reported - Swedish (%)
Ancestries Reported - Swiss (%)
Ancestries Reported - Ukrainian (%)
Ancestries Reported - United States (%)
Ancestries Reported - Welsh (%)
Ancestries Reported - West Indian (%)
Ancestries Reported - Other (%)
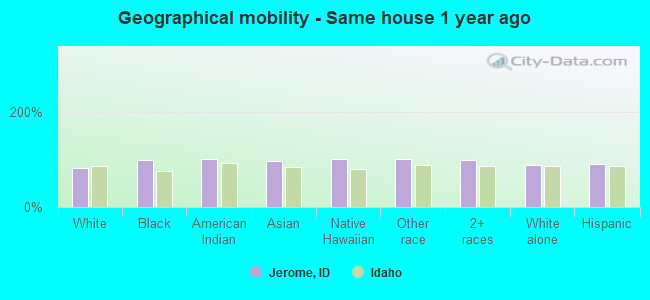
Geographical mobility - Same house 1 year ago (%)
Geographical mobility - Same house 1 year ago (%) - White
Geographical mobility - Same house 1 year ago (%) - Black or African American
Geographical mobility - Same house 1 year ago (%) - Asian
Geographical mobility - Same house 1 year ago (%) - Hispanic or Latino
Geographical mobility - Same house 1 year ago (%) - American Indian and Alaska Native
Geographical mobility - Same house 1 year ago (%) - Multirace
Geographical mobility - Same house 1 year ago (%) - Other Race
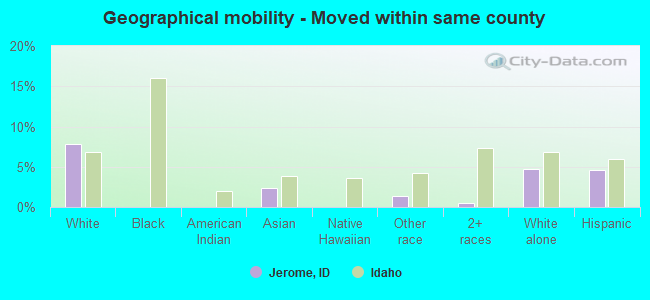
Geographical mobility - Moved within same county (%)
Geographical mobility - Moved within same county (%) - White
Geographical mobility - Moved within same county (%) - Black or African American
Geographical mobility - Moved within same county (%) - Asian
Geographical mobility - Moved within same county (%) - Hispanic or Latino
Geographical mobility - Moved within same county (%) - American Indian and Alaska Native
Geographical mobility - Moved within same county (%) - Multirace
Geographical mobility - Moved within same county (%) - Other Race
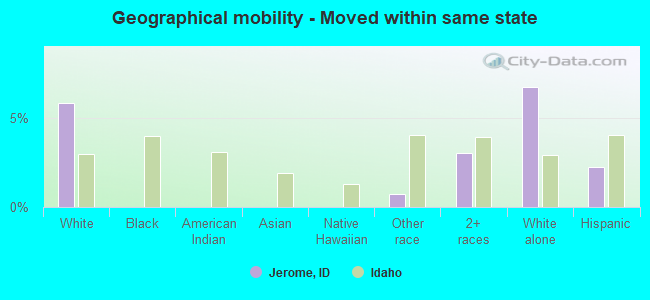
Geographical mobility - Moved from different county within same state (%)
Geographical mobility - Moved from different county within same state (%) - White
Geographical mobility - Moved from different county within same state (%) - Black or African American
Geographical mobility - Moved from different county within same state (%) - Asian
Geographical mobility - Moved from different county within same state (%) - Hispanic or Latino
Geographical mobility - Moved from different county within same state (%) - American Indian and Alaska Native
Geographical mobility - Moved from different county within same state (%) - Multirace
Geographical mobility - Moved from different county within same state (%) - Other Race
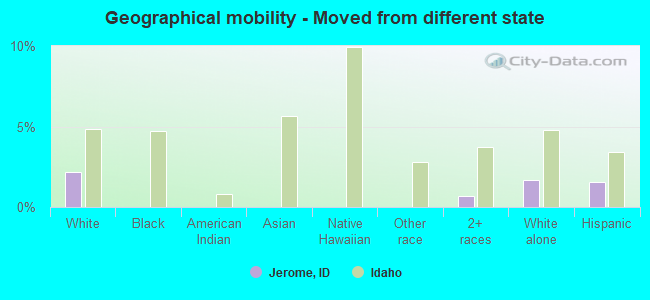
Geographical mobility - Moved from different state (%)
Geographical mobility - Moved from different state (%) - White
Geographical mobility - Moved from different state (%) - Black or African American
Geographical mobility - Moved from different state (%) - Asian
Geographical mobility - Moved from different state (%) - Hispanic or Latino
Geographical mobility - Moved from different state (%) - American Indian and Alaska Native
Geographical mobility - Moved from different state (%) - Multirace
Geographical mobility - Moved from different state (%) - Other Race
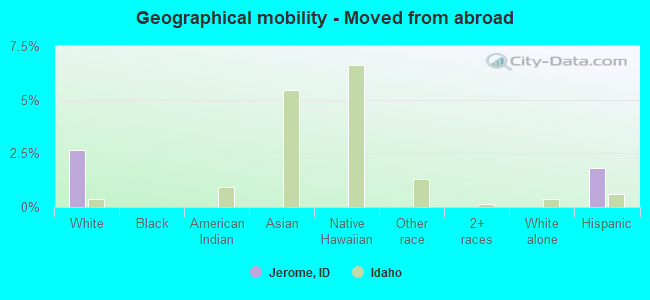
Geographical mobility - Moved from abroad (%)
Geographical mobility - Moved from abroad (%) - White
Geographical mobility - Moved from abroad (%) - Black or African American
Geographical mobility - Moved from abroad (%) - Asian
Geographical mobility - Moved from abroad (%) - Hispanic or Latino
Geographical mobility - Moved from abroad (%) - American Indian and Alaska Native
Geographical mobility - Moved from abroad (%) - Multirace
Geographical mobility - Moved from abroad (%) - Other Race
Place of birth for the foreign-born population - Ireland (%)
Place of birth for the foreign-born population - Denmark (%)
Place of birth for the foreign-born population - Norway (%)
Place of birth for the foreign-born population - Sweden (%)
Place of birth for the foreign-born population - United Kingdom (%)
Place of birth for the foreign-born population - England (%)
Place of birth for the foreign-born population - Scotland (%)
Place of birth for the foreign-born population - Other Northern Europe (%)
Place of birth for the foreign-born population - Austria (%)
Place of birth for the foreign-born population - Belgium (%)
Place of birth for the foreign-born population - France (%)
Place of birth for the foreign-born population - Germany (%)
Place of birth for the foreign-born population - Netherlands (%)
Place of birth for the foreign-born population - Switzerland (%)
Place of birth for the foreign-born population - Other Western Europe (%)
Place of birth for the foreign-born population - Greece (%)
Place of birth for the foreign-born population - Italy (%)
Place of birth for the foreign-born population - Portugal (%)
Place of birth for the foreign-born population - Spain (%)
Place of birth for the foreign-born population - Other Southern Europe (%)
Place of birth for the foreign-born population - Albania (%)
Place of birth for the foreign-born population - Belarus (%)
Place of birth for the foreign-born population - Bosnia and Herzegovina (%)
Place of birth for the foreign-born population - Bulgaria (%)
Place of birth for the foreign-born population - Croatia (%)
Place of birth for the foreign-born population - Czechoslovakia (%)
Place of birth for the foreign-born population - Hungary (%)
Place of birth for the foreign-born population - Latvia (%)
Place of birth for the foreign-born population - Lithuania (%)
Place of birth for the foreign-born population - North Macedonia (Macedonia) (%)
Place of birth for the foreign-born population - Moldova (%)
Place of birth for the foreign-born population - Poland (%)
Place of birth for the foreign-born population - Romania (%)
Place of birth for the foreign-born population - Russia (%)
Place of birth for the foreign-born population - Serbia (%)
Place of birth for the foreign-born population - Ukraine (%)
Place of birth for the foreign-born population - Other Eastern Europe (%)
Place of birth for the foreign-born population - China (%)
Place of birth for the foreign-born population - Hong Kong (%)
Place of birth for the foreign-born population - Taiwan (%)
Place of birth for the foreign-born population - Japan (%)
Place of birth for the foreign-born population - Korea (%)
Place of birth for the foreign-born population - Other Eastern Asia (%)
Place of birth for the foreign-born population - Afghanistan (%)
Place of birth for the foreign-born population - Bangladesh (%)
Place of birth for the foreign-born population - India (%)
Place of birth for the foreign-born population - Iran (%)
Place of birth for the foreign-born population - Kazakhstan (%)
Place of birth for the foreign-born population - Nepal (%)
Place of birth for the foreign-born population - Pakistan (%)
Place of birth for the foreign-born population - Sri Lanka (%)
Place of birth for the foreign-born population - Uzbekistan (%)
Place of birth for the foreign-born population - Other South Central Asia (%)
Place of birth for the foreign-born population - Burma (%)
Place of birth for the foreign-born population - Cambodia (%)
Place of birth for the foreign-born population - Indonesia (%)
Place of birth for the foreign-born population - Laos (%)
Place of birth for the foreign-born population - Malaysia (%)
Place of birth for the foreign-born population - Philippines (%)
Place of birth for the foreign-born population - Singapore (%)
Place of birth for the foreign-born population - Thailand (%)
Place of birth for the foreign-born population - Vietnam (%)
Place of birth for the foreign-born population - Other South Eastern Asia (%)
Place of birth for the foreign-born population - Armenia (%)
Place of birth for the foreign-born population - Iraq (%)
Place of birth for the foreign-born population - Israel (%)
Place of birth for the foreign-born population - Jordan (%)
Place of birth for the foreign-born population - Kuwait (%)
Place of birth for the foreign-born population - Lebanon (%)
Place of birth for the foreign-born population - Saudi Arabia (%)
Place of birth for the foreign-born population - Syria (%)
Place of birth for the foreign-born population - Turkey (%)
Place of birth for the foreign-born population - Yemen (%)
Place of birth for the foreign-born population - Other Western Asia (%)
Place of birth for the foreign-born population - Eritrea (%)
Place of birth for the foreign-born population - Ethiopia (%)
Place of birth for the foreign-born population - Kenya (%)
Place of birth for the foreign-born population - Somalia (%)
Place of birth for the foreign-born population - Uganda (%)
Place of birth for the foreign-born population - Zimbabwe (%)
Place of birth for the foreign-born population - Other Eastern Africa (%)
Place of birth for the foreign-born population - Cameroon (%)
Place of birth for the foreign-born population - Congo (%)
Place of birth for the foreign-born population - Democratic Republic of Congo (Zaire) (%)
Place of birth for the foreign-born population - Other Middle Africa (%)
Place of birth for the foreign-born population - Egypt (%)
Place of birth for the foreign-born population - Morocco (%)
Place of birth for the foreign-born population - Sudan (%)
Place of birth for the foreign-born population - Other Northern Africa (%)
Place of birth for the foreign-born population - South Africa (%)
Place of birth for the foreign-born population - Other Southern Africa (%)
Place of birth for the foreign-born population - Cabo Verde (%)
Place of birth for the foreign-born population - Ghana (%)
Place of birth for the foreign-born population - Liberia (%)
Place of birth for the foreign-born population - Nigeria (%)
Place of birth for the foreign-born population - Senegal (%)
Place of birth for the foreign-born population - Sierra Leone (%)
Place of birth for the foreign-born population - Other Western Africa (%)
Place of birth for the foreign-born population - Australia (%)
Place of birth for the foreign-born population - New Zealand (%)
Place of birth for the foreign-born population - Fiji (%)
Place of birth for the foreign-born population - Micronesia (%)
Place of birth for the foreign-born population - Bahamas (%)
Place of birth for the foreign-born population - Barbados (%)
Place of birth for the foreign-born population - Cuba (%)
Place of birth for the foreign-born population - Dominica (%)
Place of birth for the foreign-born population - Dominican Republic (%)
Place of birth for the foreign-born population - Grenada (%)
Place of birth for the foreign-born population - Haiti (%)
Place of birth for the foreign-born population - Jamaica (%)
Place of birth for the foreign-born population - St. Vincent and the Grenadines (%)
Place of birth for the foreign-born population - Trinidad and Tobago (%)
Place of birth for the foreign-born population - West Indies (%)
Place of birth for the foreign-born population - Other Caribbean (%)
Place of birth for the foreign-born population - Belize (%)
Place of birth for the foreign-born population - Costa Rica (%)
Place of birth for the foreign-born population - El Salvador (%)
Place of birth for the foreign-born population - Guatemala (%)
Place of birth for the foreign-born population - Honduras (%)
Place of birth for the foreign-born population - Mexico (%)
Place of birth for the foreign-born population - Nicaragua (%)
Place of birth for the foreign-born population - Panama (%)
Place of birth for the foreign-born population - Other Central America (%)
Place of birth for the foreign-born population - Argentina (%)
Place of birth for the foreign-born population - Bolivia (%)
Place of birth for the foreign-born population - Brazil (%)
Place of birth for the foreign-born population - Chile (%)
Place of birth for the foreign-born population - Colombia (%)
Place of birth for the foreign-born population - Ecuador (%)
Place of birth for the foreign-born population - Guyana (%)
Place of birth for the foreign-born population - Peru (%)
Place of birth for the foreign-born population - Uruguay (%)
Place of birth for the foreign-born population - Venezuela (%)
Place of birth for the foreign-born population - Other South America (%)
Place of birth for the foreign-born population - Canada (%)
Place of birth for the foreign-born population - Other Northern America (%)
Place of birth for the foreign-born population - Other (%)
Latest news about races in Jerome, ID collected exclusively by city-data.com from local newspapers, TV, and radio stations
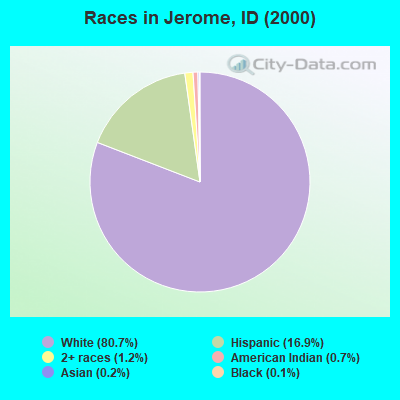
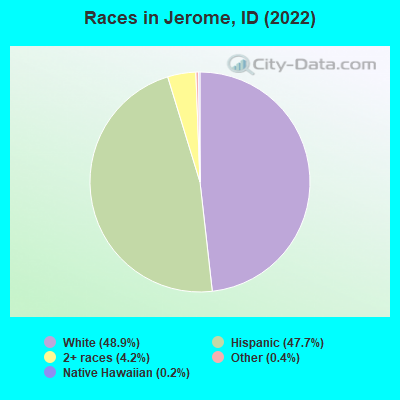
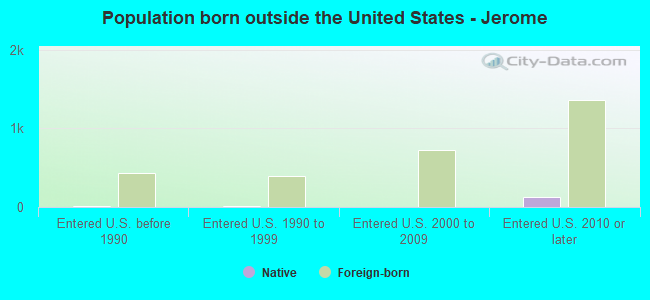
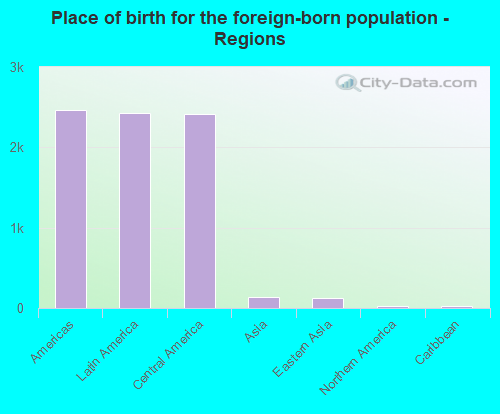
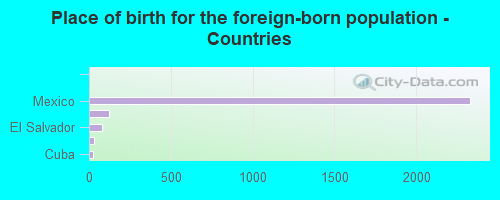
According to 2022 data, the most numerous races in Jerome, ID are White alone (6,384 residents), Hispanic (6,222 residents), and Two or more races (544 residents). 59.8% of Jerome residents speak English at home. 20.0% of Jerome, ID residents are foreign-born (19.1% born in Latin America), which is 75.1% greater than the foreign-born rate of 5.0% across the entire state of Idaho.
Race distribution in Jerome
2000 2022
1,139,291 88.0% White alone 101,690 7.9% Hispanic 18,261 1.4% Two or more races 15,789 1.2% American Indian alone 11,641 0.9% Asian alone 4,889 0.4% Black alone 1,192 0.09% Other race alone 1,200 0.09% Native Hawaiian and Other
1,531,219 79.0% White alone 261,921 13.5% Hispanic 81,112 4.2% Two or more races 25,174 1.3% Asian alone 15,825 0.8% American Indian alone 11,868 0.6% Black alone 8,752 0.5% Other race alone 3,162 0.2% Native Hawaiian and Other
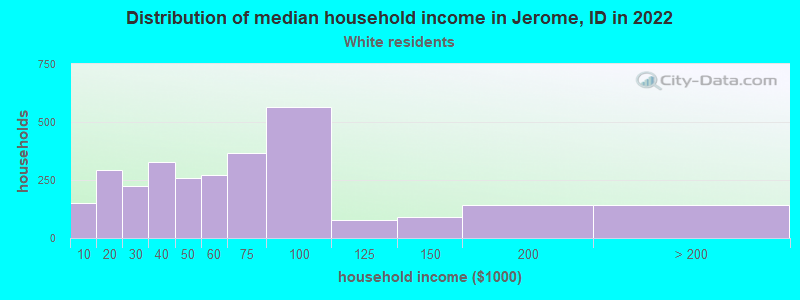
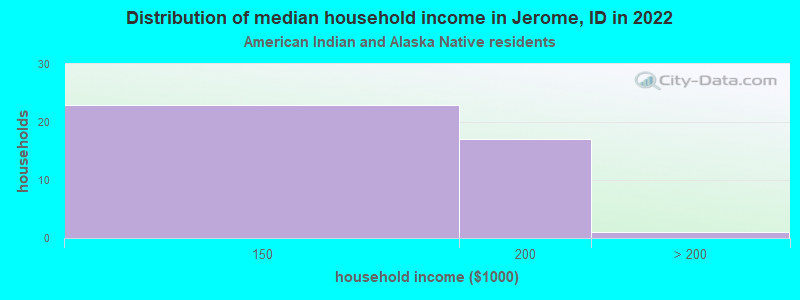
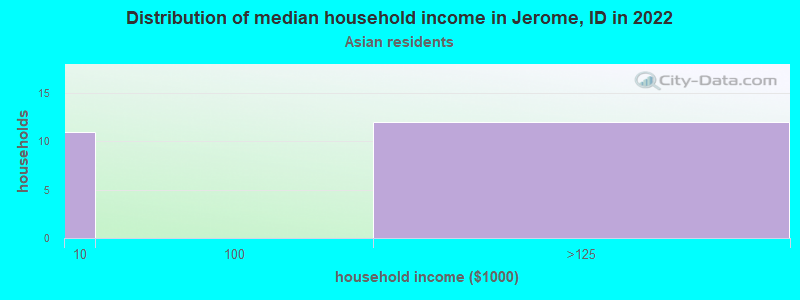
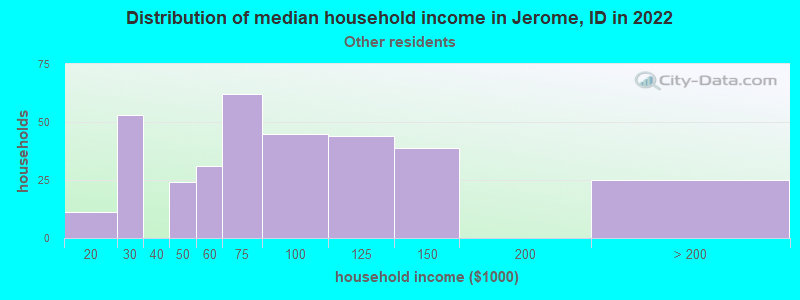
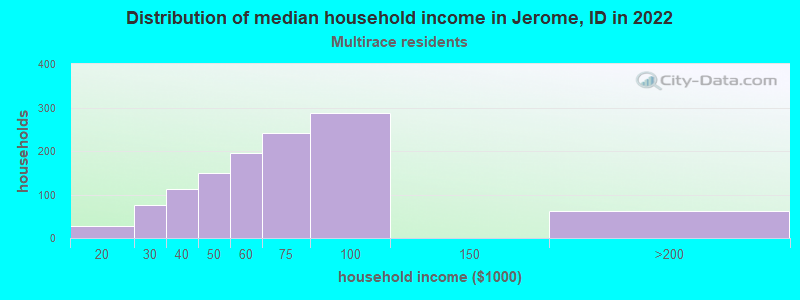
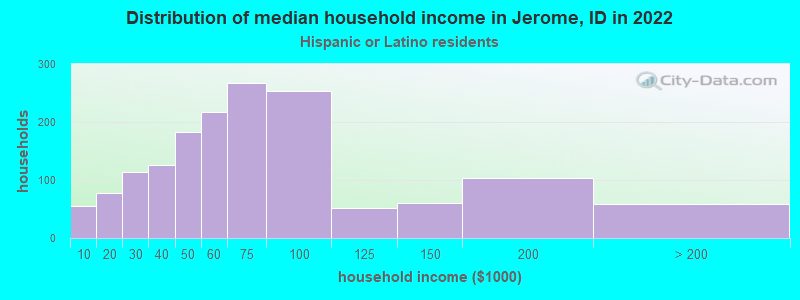
Income and house value in Jerome Median household income in 2022 $62,313 White non-Hispanic householders$163,502 American Indian and Alaska Native householders$72,177 Some other race householders$66,437 Two or more races householders$61,723 Hispanic or Latino race householdersMedian 2022 house value $265,417 White Non-Hispanic householders$271,790 Some other race householders$181,443 Two or more races householders$229,803 Hispanic or Latino householders
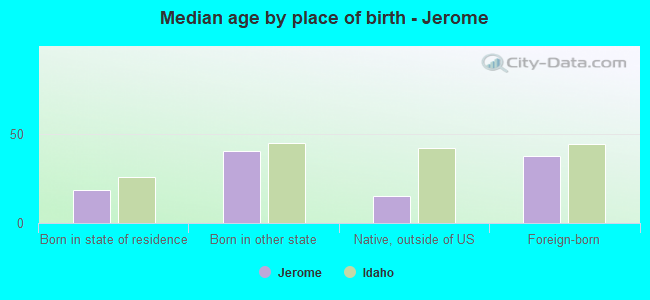
Median age by race in Jerome
31.5 Median age for White residents31.5 31.4 -774,193,547.6 Median age for Black or African American residents-680,851,063.1 -869,696,968.8 42.9 Median age for American Indian / Alaska Native residents46.0 43.8 32.0 Median age for Asian residents33.9 23.7 -393,939,393.5 Median age for Native Hawaiian / Pacific Islander residents-355,119,825.4 -679,245,282.3 29.1 Median age for Other race residents30.7 25.3 28.8 Median age for Two or more races residents23.9 28.9 39.0 Median age for White alone residents38.2 39.9 24.2 Median age for Hispanic or Latino residents26.7 22.8
Owner/renter occupied households by race in Jerome
House owners and renters - White residents 1,866 63.9% Owner occupied1,054 36.1% Renter occupiedHouse owners and renters - American Indian / Alaska Native residents 39 100.0% Owner occupiedHouse owners and renters - Asian residents 12 49.5% Owner occupied12 50.5% Renter occupiedHouse owners and renters - Other race residents 240 71.5% Owner occupied96 28.5% Renter occupiedHouse owners and renters - Two or more races residents 903 75.8% Owner occupied288 24.2% Renter occupiedHouse owners and renters - White alone residents 1,612 65.3% Owner occupied855 34.7% Renter occupiedHouse owners and renters - Hispanic or Latino residents 1,132 70.9% Owner occupied464 29.1% Renter occupied
Language usage in Jerome
English speakers - Total 59.8% of residents of Jerome speak English at home.
38.1% of residents speak Spanish at home 2,181 48.1% Speak English very well2,354 51.9% Speak English less than very well2.1% of residents speak other language at home 234 91.8% Speak English very well21 8.2% Speak English less than very well
English speakers - Born in the United States 79.8% of residents of Jerome speak English at home.
20.6% of residents speak Spanish at home 588 75.0% Speak English very well196 25.0% Speak English less than very well1.4% of residents speak other language at home 52 100.0% Speak English very well
English speakers - Native, born elsewhere 18.5% of residents of Jerome speak English at home.
101.2% of residents speak Spanish at home 170 100.0% Speak English very well
English speakers - Foreign-born 5.1% of residents of Jerome speak English at home.
84.7% of residents speak Spanish at home 283 12.1% Speak English very well2,050 87.9% Speak English less than very well6.4% of residents speak other language at home 164 92.7% Speak English very well13 7.3% Speak English less than very well
White (Caucasian) - Speak only English Native:
90.0% (5,987)Foreign-born:
4.9% (26)
White (Caucasian) - Speak another language Native:
8.6% (571)Foreign-born:
97.0% (505)
American Indian / Alaska Native - Speak another language Native:
36.7% (34)Foreign-born:
98.9% (83)
Asian - Speak another language Native:
22.6% (15)Foreign-born:
96.1% (13)
Other race - Speak only English Native:
29.7% (231)Foreign-born:
15.9% (47)
Other race - Speak another language Native:
68.5% (533)Foreign-born:
84.7% (249)
Two or more races - Speak only English Native:
34.8% (710)Foreign-born:
5.7% (141)
Two or more races - Speak another language Native:
75.2% (1,535)Foreign-born:
93.0% (2,294)
White alone - Speak only English Native:
97.5% (5,767)Foreign-born:
46.8% (28)
White alone - Speak another language Native:
2.5% (147)Foreign-born:
48.7% (29)
Hispanic or Latino - Speak only English Native:
26.7% (794)Foreign-born:
5.2% (129)
Hispanic or Latino - Speak another language Native:
72.4% (2,153)Foreign-born:
94.3% (2,338)
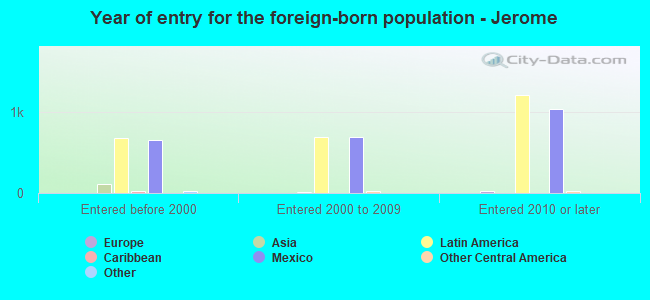
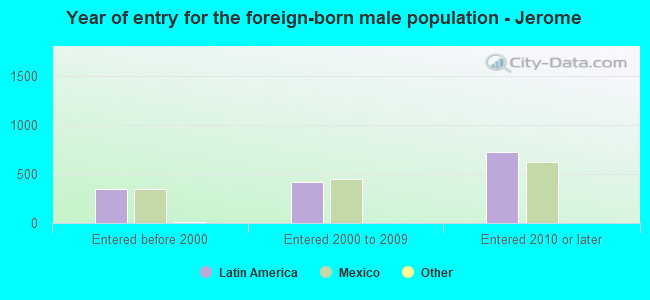
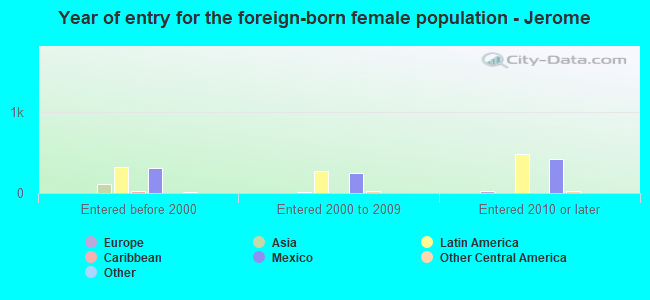
Foreign-born residents in Jerome 2,617 residents are foreign born (19.1% Latin America ).
This city:
20.0%Idaho:
5.7%
Marital status for residents in Jerome Marital status - White (Caucasian) population 15 years and over
Males 31.9% Never married51.4% Now married0.3% Separated2.6% Widowed13.7% DivorcedFemales 25.8% Never married47.9% Now married1.6% Separated9.2% Widowed15.5% DivorcedWomen who gave birth in the past 12 months Now married:
51.5% (102)Unmarried:
48.5% (96)
Women who did not give birth in the past 12 months Now married:
49.8% (909)Unmarried:
50.2% (919)
Marital status - American Indian / Alaska Native population 15 years and over
Males 34.5% Never married65.5% Now married0.0% Separated0.0% Widowed0.0% DivorcedFemales 12.0% Never married66.0% Now married2.0% Separated0.0% Widowed20.0% DivorcedWomen who did not give birth in the past 12 months Now married:
45.5% (6)Unmarried:
54.5% (7)
Marital status - Asian population 15 years and over
Males 100.0% Never married0.0% Now married0.0% Separated0.0% Widowed0.0% DivorcedFemales 75.0% Never married25.0% Now married0.0% Separated0.0% Widowed0.0% DivorcedWomen who did not give birth in the past 12 months Now married:
0.0% (0)Unmarried:
100.0% (32)
Marital status - Other race population 15 years and over
Males 34.4% Never married54.3% Now married0.0% Separated0.0% Widowed11.2% DivorcedFemales 49.5% Never married46.6% Now married0.0% Separated0.0% Widowed3.9% DivorcedWomen who gave birth in the past 12 months Now married:
100.0% (16)Unmarried:
0.0% (0)
Women who did not give birth in the past 12 months Now married:
36.6% (120)Unmarried:
63.4% (207)
Marital status - Two or more races population 15 years and over
Males 55.1% Never married37.8% Now married0.0% Separated0.0% Widowed7.1% DivorcedFemales 43.0% Never married51.0% Now married0.0% Separated0.0% Widowed6.0% DivorcedWomen who gave birth in the past 12 months Now married:
0.0% (0)Unmarried:
100.0% (28)
Women who did not give birth in the past 12 months Now married:
42.6% (397)Unmarried:
57.4% (536)
Marital status - White alone, not Hispanic / Latino population 15 years and over
Males 30.8% Never married52.8% Now married0.3% Separated3.0% Widowed13.1% DivorcedFemales 21.2% Never married49.4% Now married0.5% Separated11.1% Widowed17.8% DivorcedWomen who gave birth in the past 12 months Now married:
44.4% (37)Unmarried:
55.6% (47)
Women who did not give birth in the past 12 months Now married:
52.2% (754)Unmarried:
47.8% (691)
Marital status - Hispanic or Latino population 15 years and over
Males 48.6% Never married41.8% Now married0.0% Separated0.0% Widowed9.5% DivorcedFemales 50.7% Never married42.6% Now married2.2% Separated0.2% Widowed4.3% DivorcedWomen who gave birth in the past 12 months Now married:
47.8% (69)Unmarried:
52.2% (75)
Women who did not give birth in the past 12 months Now married:
40.3% (562)Unmarried:
59.7% (833)
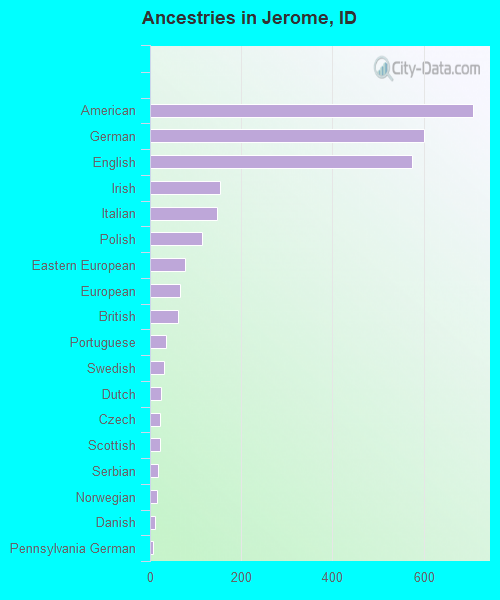
Ancestries in Jerome
708 9.4% American601 8.0% German574 7.6% English153 2.0% Irish147 1.9% Italian113 1.5% Polish76 1.0% Eastern European65 0.9% European61 0.8% British36 0.5% Portuguese31 0.4% Swedish25 0.3% Dutch23 0.3% Czech22 0.3% Scottish18 0.2% Serbian15 0.2% Norwegian11 0.1% Danish7 0.09% Pennsylvania German2 0.03% Armenian2 0.03% Scandinavian2 0.03% Yugoslavian
Children Nativity (place of birth) in Jerome
Children under 6 years - Living with two parents Both parents native 523 100.0% NativeBoth parents foreign-born 103 64.0% Native58 36.0% Foreign-bornOne native, one foreign-born parent 119 100.0% NativeChildren under 6 years - Living with one parent Native parent 178 100.0% NativeForeign-born parent 356 100.0% NativeChildren 6 to 17 years - Living with two parents Both parents native 1,092 100.0% NativeBoth parents foreign-born 277 88.8% Native35 11.2% Foreign-bornOne native, one foreign-born parent 201 95.2% Native10 4.8% Foreign-bornChildren 6 to 17 years - Living with one parent Native parent 310 81.1% Native72 18.9% Foreign-bornForeign-born parent 516 67.6% Native247 32.4% Foreign-born
Grandparents responsible for own grandchildren in Jerome
Grandparents (30 to 59 years) White / Caucasian 3 11.3% Responsible for grandchildren22 88.7% Not responsible for grandchildrenOther race 42 100.0% Not responsible for grandchildrenTwo or more races 80 43.2% Responsible for grandchildren105 56.8% Not responsible for grandchildrenWhite alone, not Hispanic / Latino 22 100.0% Not responsible for grandchildrenHispanic or Latino 55 36.7% Responsible for grandchildren95 63.3% Not responsible for grandchildrenGrandparents (60 years and over) White / Caucasian 10 12.8% Responsible for grandchildren69 87.2% Not responsible for grandchildrenOther race 22 100.0% Responsible for grandchildrenTwo or more races 35 100.0% Responsible for grandchildrenWhite alone, not Hispanic / Latino 6 7.8% Responsible for grandchildren72 92.2% Not responsible for grandchildrenHispanic or Latino 78 100.0% Responsible for grandchildren