Races in Kalifornsky, Alaska (AK) Detailed Stats
Data:
Races - White alone (%)
Races - White alone (% change since 2000)
Races - Black alone (%)
Races - Black alone (% change since 2000)
Races - American Indian alone (%)
Races - American Indian alone (% change since 2000)
Races - Asian alone (%)
Races - Asian alone (% change since 2000)
Races - Hispanic (%)
Races - Hispanic (% change since 2000)
Races - Native Hawaiian and Other Pacific Islander alone (%)
Races - Native Hawaiian and Other Pacific Islander alone (% change since 2000)
Races - Two or more races(%)
Races - Two or more races(% change since 2000)
Races - Other race alone (%)
Races - Other race alone (% change since 2000)
Racial diversity
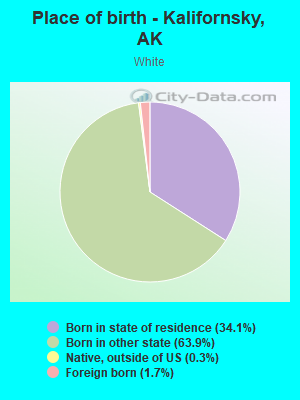
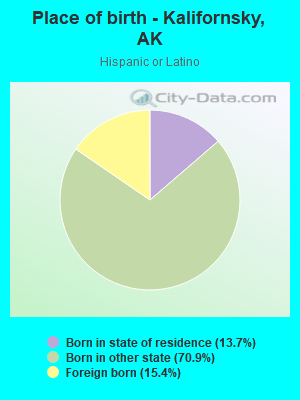
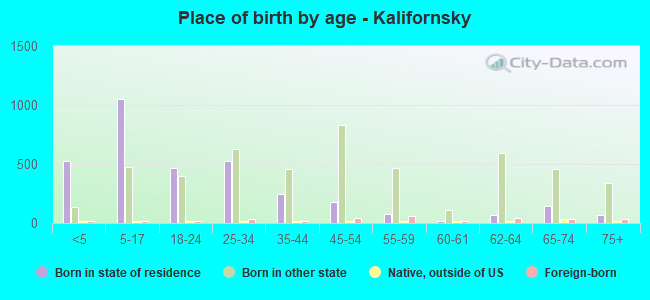
Place of birth - Born in state of residence (%)
Place of birth - Born in state of residence (%) - White
Place of birth - Born in state of residence (%) - Black or African American
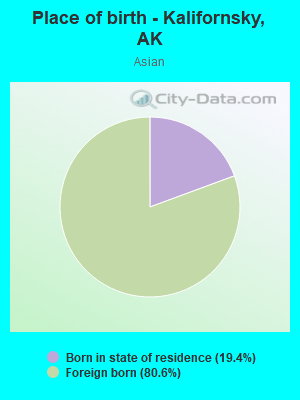
Place of birth - Born in state of residence (%) - Asian
Place of birth - Born in state of residence (%) - Hispanic or Latino
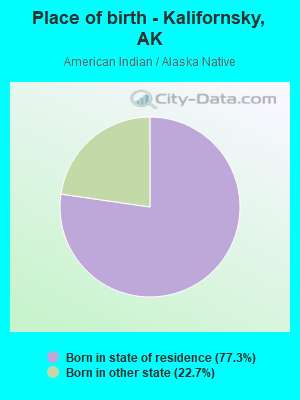
Place of birth - Born in state of residence (%) - American Indian and Alaska Native
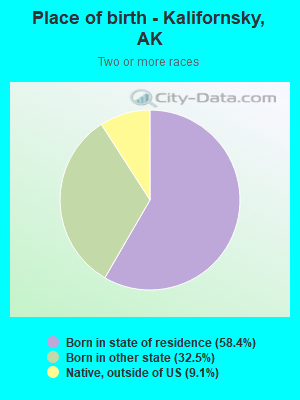
Place of birth - Born in state of residence (%) - Multirace
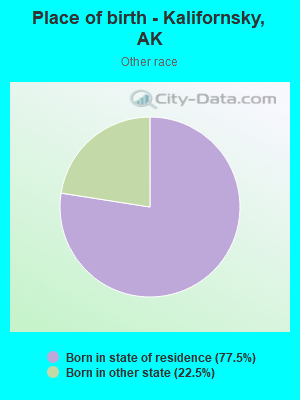
Place of birth - Born in state of residence (%) - Other Race
Place of birth - Born in other state (%)
Place of birth - Born in other state (%) - White
Place of birth - Born in other state (%) - Black or African American
Place of birth - Born in other state (%) - Asian
Place of birth - Born in other state (%) - Hispanic or Latino
Place of birth - Born in other state (%) - American Indian and Alaska Native
Place of birth - Born in other state (%) - Multirace
Place of birth - Born in other state (%) - Other Race
Place of birth - Native, outside of US (%)
Place of birth - Native, outside of US (%) - White
Place of birth - Native, outside of US (%) - Black or African American
Place of birth - Native, outside of US (%) - Asian
Place of birth - Native, outside of US (%) - Hispanic or Latino
Place of birth - Native, outside of US (%) - American Indian and Alaska Native
Place of birth - Native, outside of US (%) - Multirace
Place of birth - Native, outside of US (%) - Other Race
Place of birth - Foreign born (%)
Place of birth - Foreign born (%) - White
Place of birth - Foreign born (%) - Black or African American
Place of birth - Foreign born (%) - Asian
Place of birth - Foreign born (%) - Hispanic or Latino
Place of birth - Foreign born (%) - American Indian and Alaska Native
Place of birth - Foreign born (%) - Multirace
Place of birth - Foreign born (%) - Other Race
Residents speaking English at home (%)
Residents speaking English at home - Born in the United States (%)
Residents speaking English at home - Native, born elsewhere (%)
Residents speaking English at home - Foreign born (%)
Residents speaking Spanish at home (%)
Residents speaking Spanish at home - Born in the United States (%)
Residents speaking Spanish at home - Native, born elsewhere (%)
Residents speaking Spanish at home - Foreign born (%)
Residents speaking other language at home (%)
Residents speaking other language at home - Born in the United States (%)
Residents speaking other language at home - Native, born elsewhere (%)
Residents speaking other language at home - Foreign born (%)
Marital status - Never married (%)
Marital status - Now married (%)
Marital status - Separated (%)
Marital status - Widowed (%)
Marital status - Divorced (%)
Ancestries Reported - Arab (%)
Ancestries Reported - Czech (%)
Ancestries Reported - Danish (%)
Ancestries Reported - Dutch (%)
Ancestries Reported - English (%)
Ancestries Reported - French (%)
Ancestries Reported - French Canadian (%)
Ancestries Reported - German (%)
Ancestries Reported - Greek (%)
Ancestries Reported - Hungarian (%)
Ancestries Reported - Irish (%)
Ancestries Reported - Italian (%)
Ancestries Reported - Lithuanian (%)
Ancestries Reported - Norwegian (%)
Ancestries Reported - Polish (%)
Ancestries Reported - Portuguese (%)
Ancestries Reported - Russian (%)
Ancestries Reported - Scotch-Irish (%)
Ancestries Reported - Scottish (%)
Ancestries Reported - Slovak (%)
Ancestries Reported - Subsaharan African (%)
Ancestries Reported - Swedish (%)
Ancestries Reported - Swiss (%)
Ancestries Reported - Ukrainian (%)
Ancestries Reported - United States (%)
Ancestries Reported - Welsh (%)
Ancestries Reported - West Indian (%)
Ancestries Reported - Other (%)
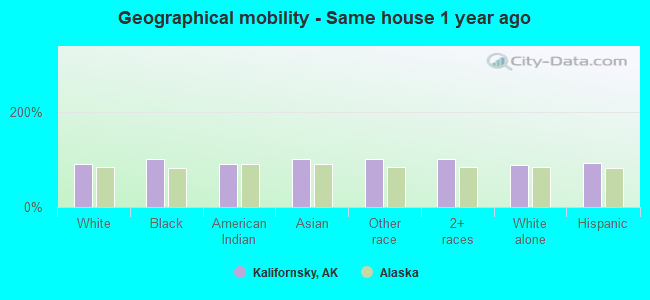
Geographical mobility - Same house 1 year ago (%)
Geographical mobility - Same house 1 year ago (%) - White
Geographical mobility - Same house 1 year ago (%) - Black or African American
Geographical mobility - Same house 1 year ago (%) - Asian
Geographical mobility - Same house 1 year ago (%) - Hispanic or Latino
Geographical mobility - Same house 1 year ago (%) - American Indian and Alaska Native
Geographical mobility - Same house 1 year ago (%) - Multirace
Geographical mobility - Same house 1 year ago (%) - Other Race
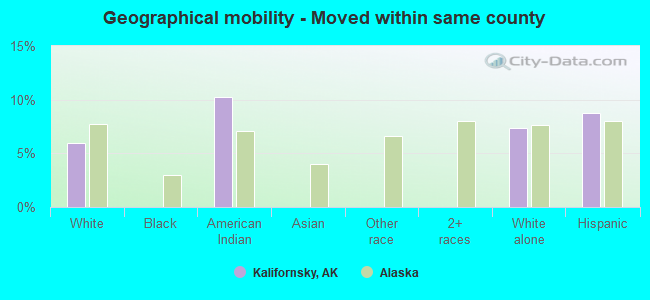
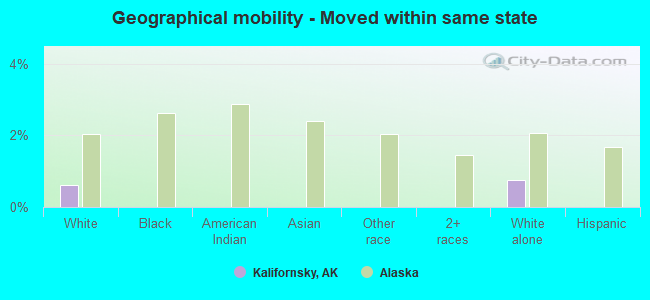
Geographical mobility - Moved within same county (%)
Geographical mobility - Moved within same county (%) - White
Geographical mobility - Moved within same county (%) - Black or African American
Geographical mobility - Moved within same county (%) - Asian
Geographical mobility - Moved within same county (%) - Hispanic or Latino
Geographical mobility - Moved within same county (%) - American Indian and Alaska Native
Geographical mobility - Moved within same county (%) - Multirace
Geographical mobility - Moved within same county (%) - Other Race
Geographical mobility - Moved from different county within same state (%)
Geographical mobility - Moved from different county within same state (%) - White
Geographical mobility - Moved from different county within same state (%) - Black or African American
Geographical mobility - Moved from different county within same state (%) - Asian
Geographical mobility - Moved from different county within same state (%) - Hispanic or Latino
Geographical mobility - Moved from different county within same state (%) - American Indian and Alaska Native
Geographical mobility - Moved from different county within same state (%) - Multirace
Geographical mobility - Moved from different county within same state (%) - Other Race
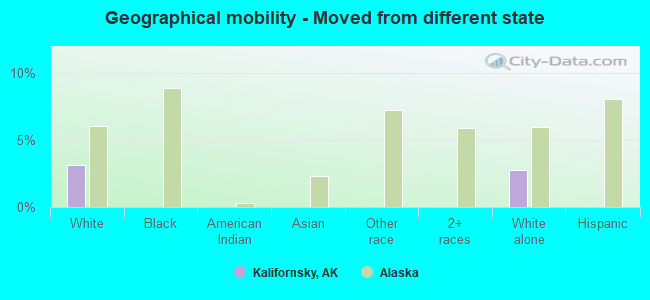
Geographical mobility - Moved from different state (%)
Geographical mobility - Moved from different state (%) - White
Geographical mobility - Moved from different state (%) - Black or African American
Geographical mobility - Moved from different state (%) - Asian
Geographical mobility - Moved from different state (%) - Hispanic or Latino
Geographical mobility - Moved from different state (%) - American Indian and Alaska Native
Geographical mobility - Moved from different state (%) - Multirace
Geographical mobility - Moved from different state (%) - Other Race
Geographical mobility - Moved from abroad (%)
Geographical mobility - Moved from abroad (%) - White
Geographical mobility - Moved from abroad (%) - Black or African American
Geographical mobility - Moved from abroad (%) - Asian
Geographical mobility - Moved from abroad (%) - Hispanic or Latino
Geographical mobility - Moved from abroad (%) - American Indian and Alaska Native
Geographical mobility - Moved from abroad (%) - Multirace
Geographical mobility - Moved from abroad (%) - Other Race
Place of birth for the foreign-born population - Ireland (%)
Place of birth for the foreign-born population - Denmark (%)
Place of birth for the foreign-born population - Norway (%)
Place of birth for the foreign-born population - Sweden (%)
Place of birth for the foreign-born population - United Kingdom (%)
Place of birth for the foreign-born population - England (%)
Place of birth for the foreign-born population - Scotland (%)
Place of birth for the foreign-born population - Other Northern Europe (%)
Place of birth for the foreign-born population - Austria (%)
Place of birth for the foreign-born population - Belgium (%)
Place of birth for the foreign-born population - France (%)
Place of birth for the foreign-born population - Germany (%)
Place of birth for the foreign-born population - Netherlands (%)
Place of birth for the foreign-born population - Switzerland (%)
Place of birth for the foreign-born population - Other Western Europe (%)
Place of birth for the foreign-born population - Greece (%)
Place of birth for the foreign-born population - Italy (%)
Place of birth for the foreign-born population - Portugal (%)
Place of birth for the foreign-born population - Spain (%)
Place of birth for the foreign-born population - Other Southern Europe (%)
Place of birth for the foreign-born population - Albania (%)
Place of birth for the foreign-born population - Belarus (%)
Place of birth for the foreign-born population - Bosnia and Herzegovina (%)
Place of birth for the foreign-born population - Bulgaria (%)
Place of birth for the foreign-born population - Croatia (%)
Place of birth for the foreign-born population - Czechoslovakia (%)
Place of birth for the foreign-born population - Hungary (%)
Place of birth for the foreign-born population - Latvia (%)
Place of birth for the foreign-born population - Lithuania (%)
Place of birth for the foreign-born population - North Macedonia (Macedonia) (%)
Place of birth for the foreign-born population - Moldova (%)
Place of birth for the foreign-born population - Poland (%)
Place of birth for the foreign-born population - Romania (%)
Place of birth for the foreign-born population - Russia (%)
Place of birth for the foreign-born population - Serbia (%)
Place of birth for the foreign-born population - Ukraine (%)
Place of birth for the foreign-born population - Other Eastern Europe (%)
Place of birth for the foreign-born population - China (%)
Place of birth for the foreign-born population - Hong Kong (%)
Place of birth for the foreign-born population - Taiwan (%)
Place of birth for the foreign-born population - Japan (%)
Place of birth for the foreign-born population - Korea (%)
Place of birth for the foreign-born population - Other Eastern Asia (%)
Place of birth for the foreign-born population - Afghanistan (%)
Place of birth for the foreign-born population - Bangladesh (%)
Place of birth for the foreign-born population - India (%)
Place of birth for the foreign-born population - Iran (%)
Place of birth for the foreign-born population - Kazakhstan (%)
Place of birth for the foreign-born population - Nepal (%)
Place of birth for the foreign-born population - Pakistan (%)
Place of birth for the foreign-born population - Sri Lanka (%)
Place of birth for the foreign-born population - Uzbekistan (%)
Place of birth for the foreign-born population - Other South Central Asia (%)
Place of birth for the foreign-born population - Burma (%)
Place of birth for the foreign-born population - Cambodia (%)
Place of birth for the foreign-born population - Indonesia (%)
Place of birth for the foreign-born population - Laos (%)
Place of birth for the foreign-born population - Malaysia (%)
Place of birth for the foreign-born population - Philippines (%)
Place of birth for the foreign-born population - Singapore (%)
Place of birth for the foreign-born population - Thailand (%)
Place of birth for the foreign-born population - Vietnam (%)
Place of birth for the foreign-born population - Other South Eastern Asia (%)
Place of birth for the foreign-born population - Armenia (%)
Place of birth for the foreign-born population - Iraq (%)
Place of birth for the foreign-born population - Israel (%)
Place of birth for the foreign-born population - Jordan (%)
Place of birth for the foreign-born population - Kuwait (%)
Place of birth for the foreign-born population - Lebanon (%)
Place of birth for the foreign-born population - Saudi Arabia (%)
Place of birth for the foreign-born population - Syria (%)
Place of birth for the foreign-born population - Turkey (%)
Place of birth for the foreign-born population - Yemen (%)
Place of birth for the foreign-born population - Other Western Asia (%)
Place of birth for the foreign-born population - Eritrea (%)
Place of birth for the foreign-born population - Ethiopia (%)
Place of birth for the foreign-born population - Kenya (%)
Place of birth for the foreign-born population - Somalia (%)
Place of birth for the foreign-born population - Uganda (%)
Place of birth for the foreign-born population - Zimbabwe (%)
Place of birth for the foreign-born population - Other Eastern Africa (%)
Place of birth for the foreign-born population - Cameroon (%)
Place of birth for the foreign-born population - Congo (%)
Place of birth for the foreign-born population - Democratic Republic of Congo (Zaire) (%)
Place of birth for the foreign-born population - Other Middle Africa (%)
Place of birth for the foreign-born population - Egypt (%)
Place of birth for the foreign-born population - Morocco (%)
Place of birth for the foreign-born population - Sudan (%)
Place of birth for the foreign-born population - Other Northern Africa (%)
Place of birth for the foreign-born population - South Africa (%)
Place of birth for the foreign-born population - Other Southern Africa (%)
Place of birth for the foreign-born population - Cabo Verde (%)
Place of birth for the foreign-born population - Ghana (%)
Place of birth for the foreign-born population - Liberia (%)
Place of birth for the foreign-born population - Nigeria (%)
Place of birth for the foreign-born population - Senegal (%)
Place of birth for the foreign-born population - Sierra Leone (%)
Place of birth for the foreign-born population - Other Western Africa (%)
Place of birth for the foreign-born population - Australia (%)
Place of birth for the foreign-born population - New Zealand (%)
Place of birth for the foreign-born population - Fiji (%)
Place of birth for the foreign-born population - Micronesia (%)
Place of birth for the foreign-born population - Bahamas (%)
Place of birth for the foreign-born population - Barbados (%)
Place of birth for the foreign-born population - Cuba (%)
Place of birth for the foreign-born population - Dominica (%)
Place of birth for the foreign-born population - Dominican Republic (%)
Place of birth for the foreign-born population - Grenada (%)
Place of birth for the foreign-born population - Haiti (%)
Place of birth for the foreign-born population - Jamaica (%)
Place of birth for the foreign-born population - St. Vincent and the Grenadines (%)
Place of birth for the foreign-born population - Trinidad and Tobago (%)
Place of birth for the foreign-born population - West Indies (%)
Place of birth for the foreign-born population - Other Caribbean (%)
Place of birth for the foreign-born population - Belize (%)
Place of birth for the foreign-born population - Costa Rica (%)
Place of birth for the foreign-born population - El Salvador (%)
Place of birth for the foreign-born population - Guatemala (%)
Place of birth for the foreign-born population - Honduras (%)
Place of birth for the foreign-born population - Mexico (%)
Place of birth for the foreign-born population - Nicaragua (%)
Place of birth for the foreign-born population - Panama (%)
Place of birth for the foreign-born population - Other Central America (%)
Place of birth for the foreign-born population - Argentina (%)
Place of birth for the foreign-born population - Bolivia (%)
Place of birth for the foreign-born population - Brazil (%)
Place of birth for the foreign-born population - Chile (%)
Place of birth for the foreign-born population - Colombia (%)
Place of birth for the foreign-born population - Ecuador (%)
Place of birth for the foreign-born population - Guyana (%)
Place of birth for the foreign-born population - Peru (%)
Place of birth for the foreign-born population - Uruguay (%)
Place of birth for the foreign-born population - Venezuela (%)
Place of birth for the foreign-born population - Other South America (%)
Place of birth for the foreign-born population - Canada (%)
Place of birth for the foreign-born population - Other Northern America (%)
Place of birth for the foreign-born population - Other (%)
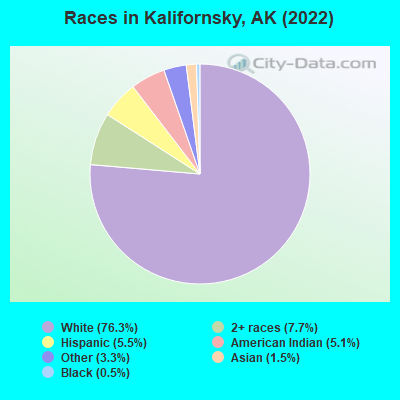
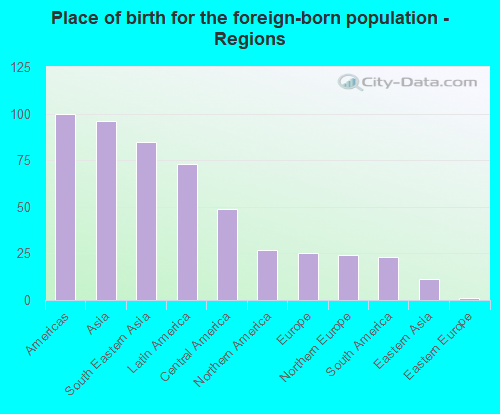
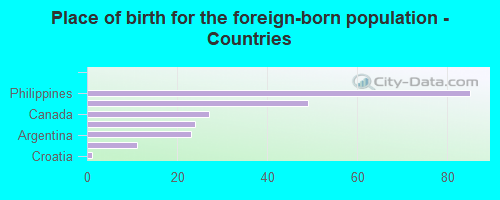
According to 2022 data, the most numerous races in Kalifornsky, AK are White alone (6,512 residents), American Indian alone (405 residents), and Two or more races (444 residents). 93.0% of Kalifornsky residents speak English at home. 2.6% of Kalifornsky, AK residents are foreign-born (1.1% born in Asia, 0.8% born in Latin America, 0.3% born in North America, 0.3% born in Europe), which is 167.7% less than the foreign-born rate of 7.0% across the entire state of Alaska.
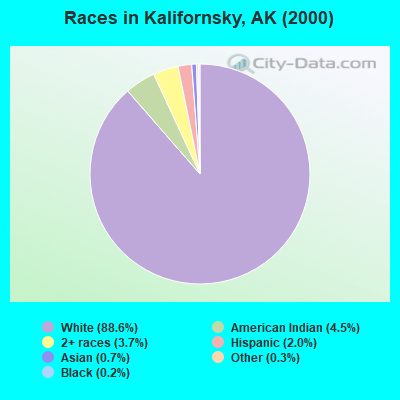
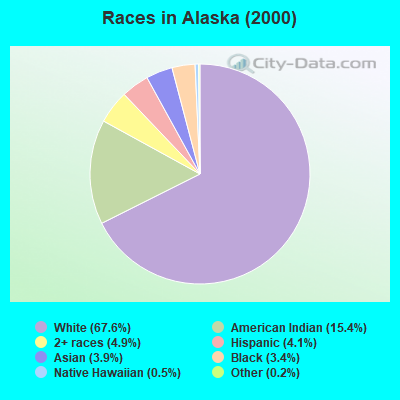
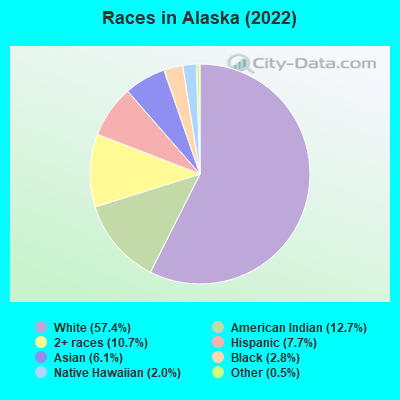
Race distribution in Kalifornsky
2000 2022
423,788 67.6% White alone 96,505 15.4% American Indian alone 30,454 4.9% Two or more races 25,852 4.1% Hispanic 24,741 3.9% Asian alone 21,073 3.4% Black alone 3,181 0.5% Native Hawaiian and Other 1,338 0.2% Other race alone
421,104 57.4% White alone 93,294 12.7% American Indian alone 78,552 10.7% Two or more races 56,491 7.7% Hispanic 44,905 6.1% Asian alone 20,664 2.8% Black alone 14,539 2.0% Native Hawaiian and Other 4,034 0.5% Other race alone
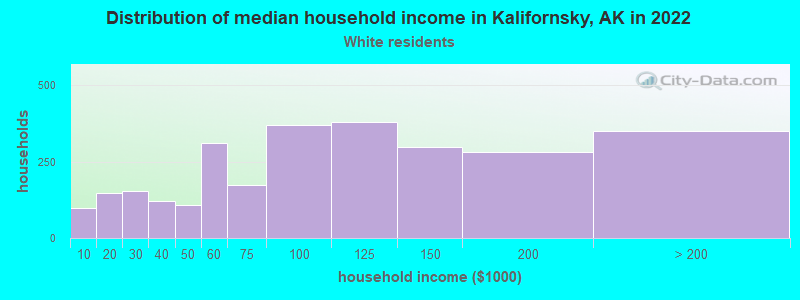
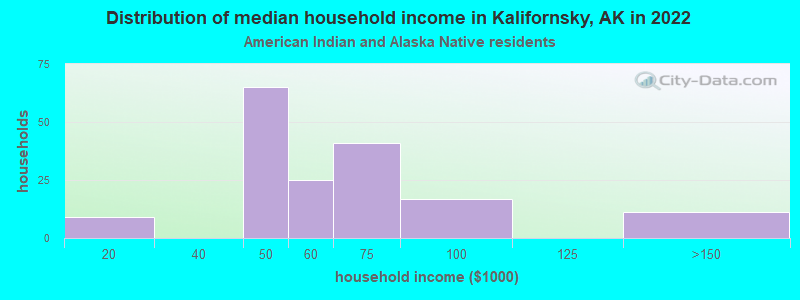
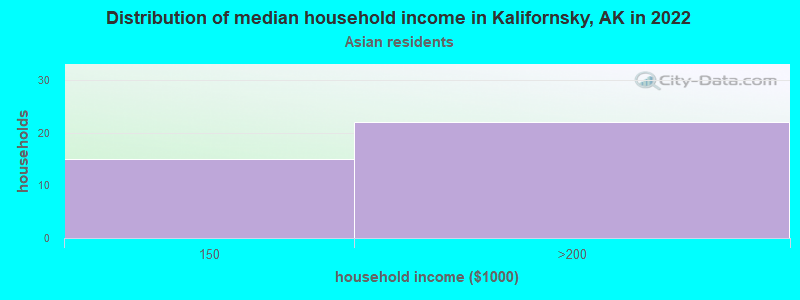
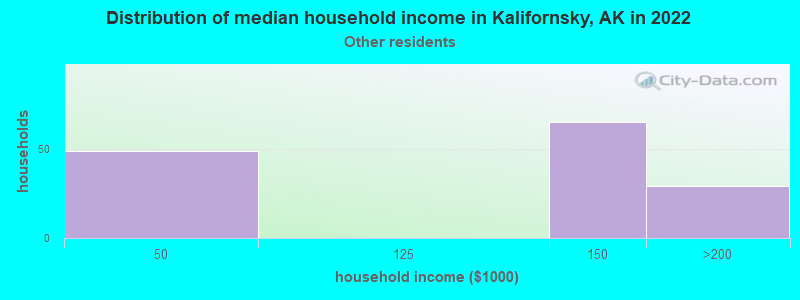
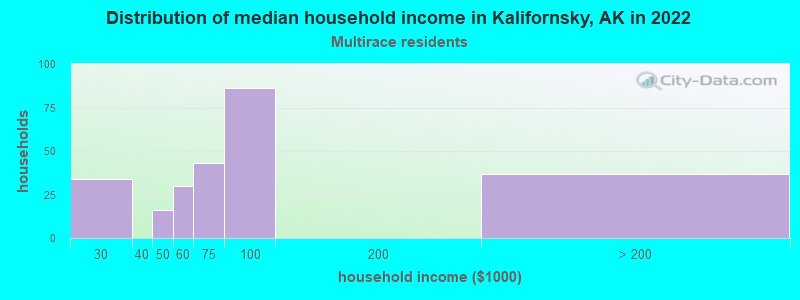
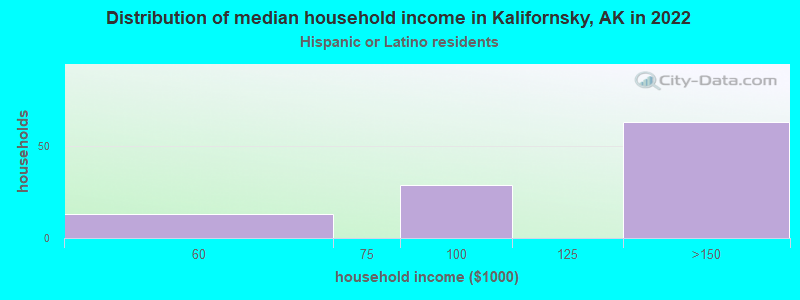
Income and house value in Kalifornsky Median household income in 2022 $93,250 White non-Hispanic householders$77,281 American Indian and Alaska Native householders$140,199 Asian householders$52,528 Some other race householders$73,631 Two or more races householders$122,373 Hispanic or Latino race householdersMedian 2022 house value $307,721 White Non-Hispanic householders$291,293 American Indian or Alaska Native householders $551,692 Asian householders$372,208 Some other race householders$245,196 Two or more races householders$398,444 Hispanic or Latino householders
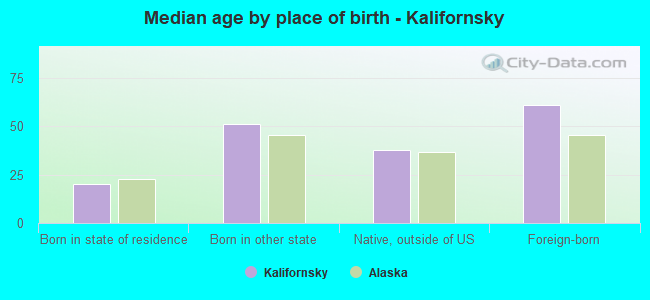
Median age by race in Kalifornsky
36.7 Median age for White residents34.4 40.5 5.2 Median age for Black or African American residents51.4 Median age for American Indian / Alaska Native residents46.6 53.0 65.7 Median age for Asian residents21.2 Median age for Other race residents34.1 23.5 17.4 Median age for Two or more races residents17.0 18.0 39.4 Median age for White alone residents35.1 40.6 19.9 Median age for Hispanic or Latino residents26.0 11.2
Owner/renter occupied households by race in Kalifornsky
House owners and renters - White residents 2,288 85.1% Owner occupied399 14.9% Renter occupiedHouse owners and renters - American Indian / Alaska Native residents 79 53.0% Owner occupied70 47.0% Renter occupiedHouse owners and renters - Asian residents 16 67.2% Owner occupied8 32.8% Renter occupiedHouse owners and renters - Other race residents 140 100.0% Owner occupiedHouse owners and renters - Two or more races residents 62 47.2% Owner occupied69 52.8% Renter occupiedHouse owners and renters - White alone residents 2,214 85.2% Owner occupied385 14.8% Renter occupiedHouse owners and renters - Hispanic or Latino residents 151 88.0% Owner occupied21 12.0% Renter occupied
Language usage in Kalifornsky
English speakers - Total 93.0% of residents of Kalifornsky speak English at home.
4.7% of residents speak Spanish at home 305 82.4% Speak English very well65 17.6% Speak English less than very well2.6% of residents speak other language at home 157 77.7% Speak English very well45 22.3% Speak English less than very well
English speakers - Born in the United States 93.7% of residents of Kalifornsky speak English at home.
5.3% of residents speak Spanish at home 254 100.0% Speak English very well0.8% of residents speak other language at home 37 100.0% Speak English very well
English speakers - Native, born elsewhere 35.0% of residents of Kalifornsky speak English at home.
73.3% of residents speak other language at home 44 100.0% Speak English very well
English speakers - Foreign-born 41.4% of residents of Kalifornsky speak English at home.
19.1% of residents speak Spanish at home 31 73.8% Speak English very well11 26.2% Speak English less than very well38.2% of residents speak other language at home 36 42.9% Speak English very well48 57.1% Speak English less than very well
White (Caucasian) - Speak only English Native:
95.5% (5,911)Foreign-born:
73.9% (85)
White (Caucasian) - Speak another language Native:
4.4% (275)Foreign-born:
34.9% (40)
Asian - Speak only English Native:
100.0% (21)Foreign-born:
12.0% (11)
White alone - Speak only English Native:
98.2% (5,915)Foreign-born:
100.0% (53)
Hispanic or Latino - Speak only English Native:
9.6% (26)Foreign-born:
31.4% (20)
Hispanic or Latino - Speak another language Native:
96.3% (266)Foreign-born:
67.8% (44)
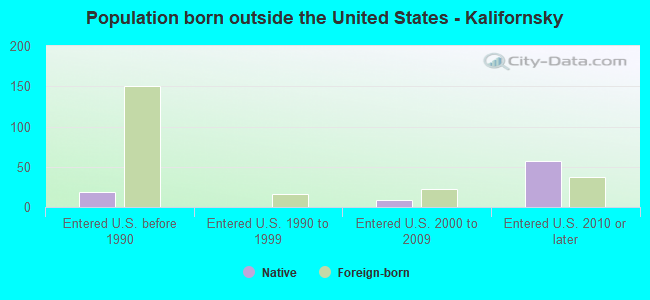
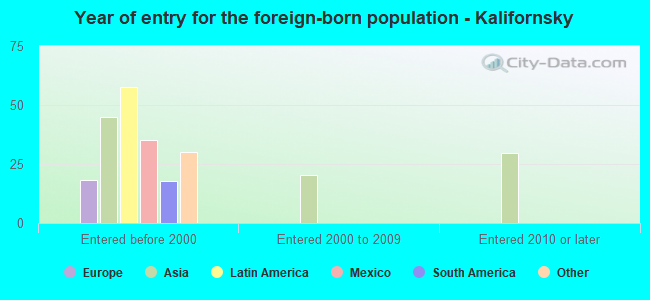
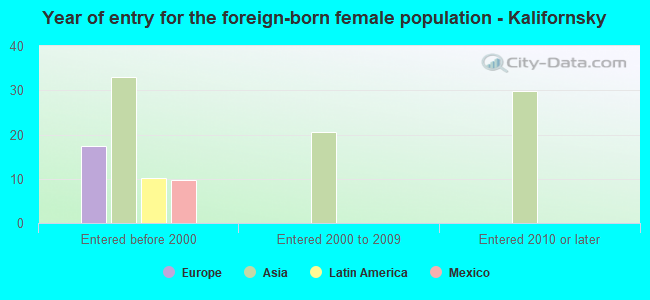
Foreign-born residents in Kalifornsky 222 residents are foreign born (1.1% Asia , 0.8% Latin America , 0.3% North America , 0.3% Europe ).
This city:
2.6%Alaska:
100.0%
Marital status for residents in Kalifornsky Marital status - White (Caucasian) population 15 years and over
Males 32.0% Never married55.7% Now married2.0% Separated1.4% Widowed9.0% DivorcedFemales 16.6% Never married60.1% Now married0.0% Separated5.4% Widowed18.0% DivorcedWomen who gave birth in the past 12 months Now married:
100.0% (57)Unmarried:
0.0% (0)
Women who did not give birth in the past 12 months Now married:
61.1% (769)Unmarried:
38.9% (490)
Marital status - American Indian / Alaska Native population 15 years and over
Males 20.1% Never married33.8% Now married0.0% Separated0.7% Widowed45.3% DivorcedFemales 0.0% Never married90.6% Now married0.0% Separated9.4% Widowed0.0% DivorcedWomen who gave birth in the past 12 months Now married:
100.0% (16)Unmarried:
0.0% (0)
Women who did not give birth in the past 12 months Now married:
100.0% (91)Unmarried:
0.0% (0)
Marital status - Asian population 15 years and over
Males 61.3% Never married38.7% Now married0.0% Separated0.0% Widowed0.0% DivorcedFemales 0.0% Never married100.0% Now married0.0% Separated0.0% Widowed0.0% DivorcedWomen who did not give birth in the past 12 months Now married:
100.0% (31)Unmarried:
0.0% (0)
Marital status - Other race population 15 years and over
Males 0.0% Never married100.0% Now married0.0% Separated0.0% Widowed0.0% DivorcedFemales 84.4% Never married15.6% Now married0.0% Separated0.0% Widowed0.0% DivorcedWomen who did not give birth in the past 12 months Now married:
0.0% (0)Unmarried:
100.0% (239)
Marital status - Two or more races population 15 years and over
Males 60.7% Never married18.7% Now married0.0% Separated0.0% Widowed20.6% DivorcedFemales 12.1% Never married47.4% Now married17.2% Separated23.3% Widowed0.0% DivorcedWomen who did not give birth in the past 12 months Now married:
74.5% (54)Unmarried:
25.5% (18)
Marital status - White alone, not Hispanic / Latino population 15 years and over
Males 29.5% Never married58.5% Now married1.0% Separated1.5% Widowed9.6% DivorcedFemales 16.1% Never married60.4% Now married0.0% Separated5.4% Widowed18.1% DivorcedWomen who gave birth in the past 12 months Now married:
100.0% (58)Unmarried:
0.0% (0)
Women who did not give birth in the past 12 months Now married:
61.1% (779)Unmarried:
38.9% (497)
Marital status - Hispanic or Latino population 15 years and over
Males 55.6% Never married30.1% Now married14.2% Separated0.0% Widowed0.0% DivorcedFemales 100.0% Never married0.0% Now married0.0% Separated0.0% Widowed0.0% Divorced
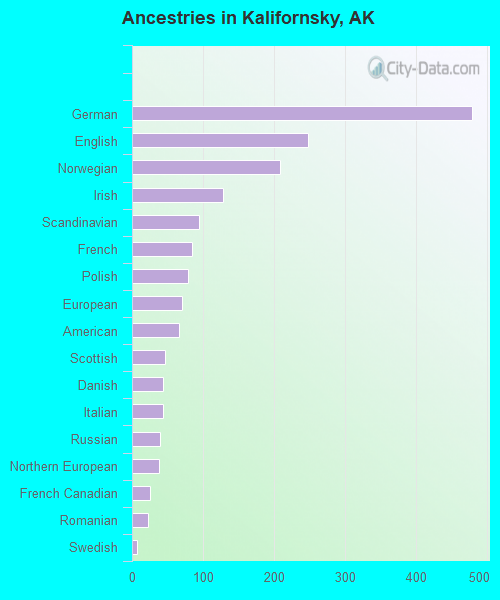
Ancestries in Kalifornsky
646 20.8% English467 15.0% German242 7.8% Northern European238 7.6% Irish150 4.8% Norwegian147 4.7% Italian131 4.2% American65 2.1% French51 1.6% Welsh44 1.4% Scotch-Irish31 1.0% Austrian28 0.9% French Canadian27 0.9% Albanian26 0.8% Swedish25 0.8% European20 0.6% Polish14 0.4% Dutch
Children Nativity (place of birth) in Kalifornsky
Children under 6 years - Living with two parents Both parents native 612 100.0% NativeOne native, one foreign-born parent 17 100.0% NativeChildren under 6 years - Living with one parent Native parent 55 100.0% NativeChildren 6 to 17 years - Living with two parents Both parents native 1,125 100.0% NativeChildren 6 to 17 years - Living with one parent Native parent 256 100.0% NativeForeign-born parent 58 48.3% Native62 51.7% Foreign-born
Grandparents responsible for own grandchildren in Kalifornsky
Grandparents (30 to 59 years) White / Caucasian 49 100.0% Responsible for grandchildrenWhite alone, not Hispanic / Latino 47 100.0% Responsible for grandchildren
Grandparents (60 years and over)