Races in Keansburg, New Jersey (NJ) Detailed Stats
Data:
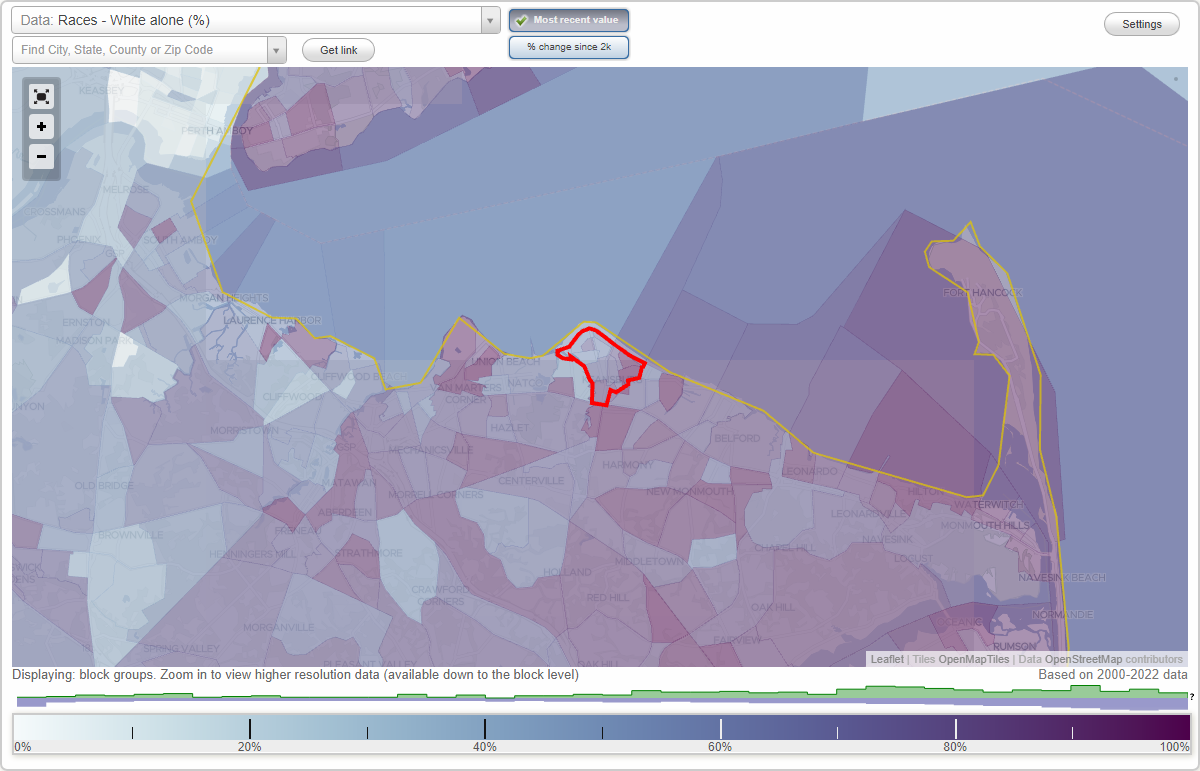
Races - White alone (%)
Races - White alone (% change since 2000)
Races - Black alone (%)
Races - Black alone (% change since 2000)
Races - American Indian alone (%)
Races - American Indian alone (% change since 2000)
Races - Asian alone (%)
Races - Asian alone (% change since 2000)
Races - Hispanic (%)
Races - Hispanic (% change since 2000)
Races - Native Hawaiian and Other Pacific Islander alone (%)
Races - Native Hawaiian and Other Pacific Islander alone (% change since 2000)
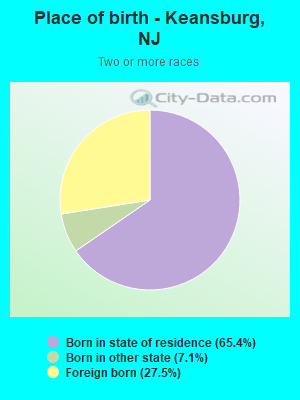
Races - Two or more races(%)
Races - Two or more races(% change since 2000)
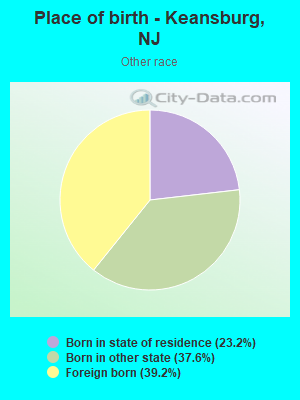
Races - Other race alone (%)
Races - Other race alone (% change since 2000)
Racial diversity
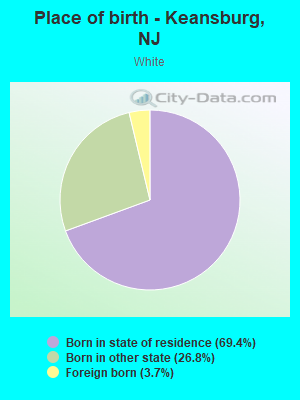
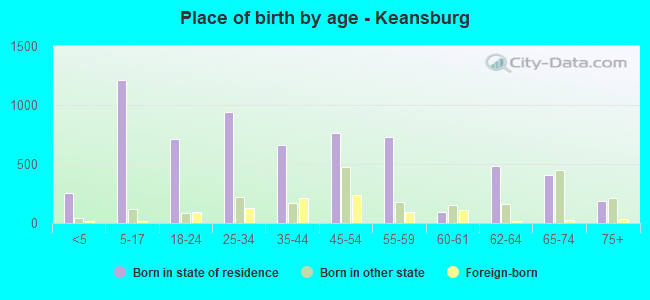
Place of birth - Born in state of residence (%)
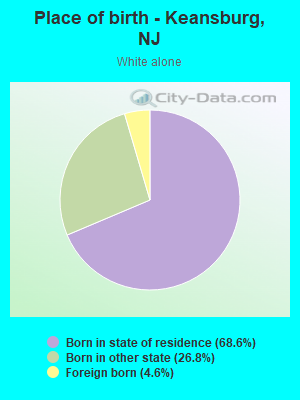
Place of birth - Born in state of residence (%) - White
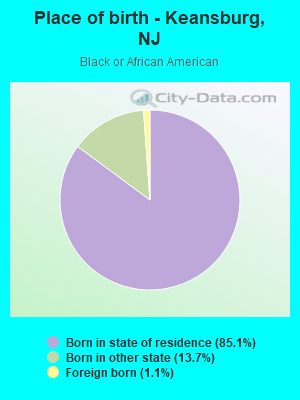
Place of birth - Born in state of residence (%) - Black or African American
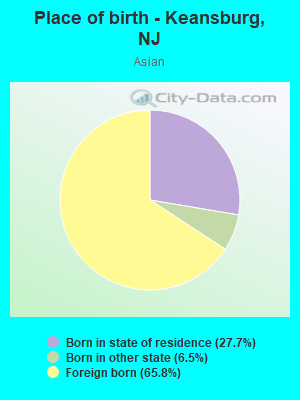
Place of birth - Born in state of residence (%) - Asian
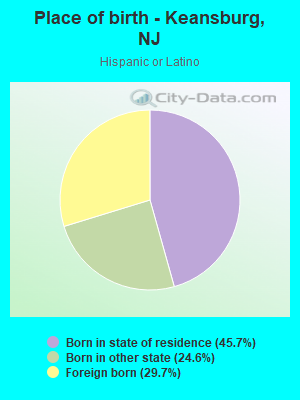
Place of birth - Born in state of residence (%) - Hispanic or Latino
Place of birth - Born in state of residence (%) - American Indian and Alaska Native
Place of birth - Born in state of residence (%) - Multirace
Place of birth - Born in state of residence (%) - Other Race
Place of birth - Born in other state (%)
Place of birth - Born in other state (%) - White
Place of birth - Born in other state (%) - Black or African American
Place of birth - Born in other state (%) - Asian
Place of birth - Born in other state (%) - Hispanic or Latino
Place of birth - Born in other state (%) - American Indian and Alaska Native
Place of birth - Born in other state (%) - Multirace
Place of birth - Born in other state (%) - Other Race
Place of birth - Native, outside of US (%)
Place of birth - Native, outside of US (%) - White
Place of birth - Native, outside of US (%) - Black or African American
Place of birth - Native, outside of US (%) - Asian
Place of birth - Native, outside of US (%) - Hispanic or Latino
Place of birth - Native, outside of US (%) - American Indian and Alaska Native
Place of birth - Native, outside of US (%) - Multirace
Place of birth - Native, outside of US (%) - Other Race
Place of birth - Foreign born (%)
Place of birth - Foreign born (%) - White
Place of birth - Foreign born (%) - Black or African American
Place of birth - Foreign born (%) - Asian
Place of birth - Foreign born (%) - Hispanic or Latino
Place of birth - Foreign born (%) - American Indian and Alaska Native
Place of birth - Foreign born (%) - Multirace
Place of birth - Foreign born (%) - Other Race
Residents speaking English at home (%)
Residents speaking English at home - Born in the United States (%)
Residents speaking English at home - Native, born elsewhere (%)
Residents speaking English at home - Foreign born (%)
Residents speaking Spanish at home (%)
Residents speaking Spanish at home - Born in the United States (%)
Residents speaking Spanish at home - Native, born elsewhere (%)
Residents speaking Spanish at home - Foreign born (%)
Residents speaking other language at home (%)
Residents speaking other language at home - Born in the United States (%)
Residents speaking other language at home - Native, born elsewhere (%)
Residents speaking other language at home - Foreign born (%)
Marital status - Never married (%)
Marital status - Now married (%)
Marital status - Separated (%)
Marital status - Widowed (%)
Marital status - Divorced (%)
Ancestries Reported - Arab (%)
Ancestries Reported - Czech (%)
Ancestries Reported - Danish (%)
Ancestries Reported - Dutch (%)
Ancestries Reported - English (%)
Ancestries Reported - French (%)
Ancestries Reported - French Canadian (%)
Ancestries Reported - German (%)
Ancestries Reported - Greek (%)
Ancestries Reported - Hungarian (%)
Ancestries Reported - Irish (%)
Ancestries Reported - Italian (%)
Ancestries Reported - Lithuanian (%)
Ancestries Reported - Norwegian (%)
Ancestries Reported - Polish (%)
Ancestries Reported - Portuguese (%)
Ancestries Reported - Russian (%)
Ancestries Reported - Scotch-Irish (%)
Ancestries Reported - Scottish (%)
Ancestries Reported - Slovak (%)
Ancestries Reported - Subsaharan African (%)
Ancestries Reported - Swedish (%)
Ancestries Reported - Swiss (%)
Ancestries Reported - Ukrainian (%)
Ancestries Reported - United States (%)
Ancestries Reported - Welsh (%)
Ancestries Reported - West Indian (%)
Ancestries Reported - Other (%)
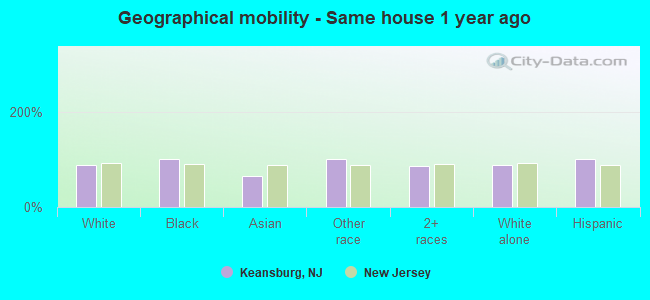
Geographical mobility - Same house 1 year ago (%)
Geographical mobility - Same house 1 year ago (%) - White
Geographical mobility - Same house 1 year ago (%) - Black or African American
Geographical mobility - Same house 1 year ago (%) - Asian
Geographical mobility - Same house 1 year ago (%) - Hispanic or Latino
Geographical mobility - Same house 1 year ago (%) - American Indian and Alaska Native
Geographical mobility - Same house 1 year ago (%) - Multirace
Geographical mobility - Same house 1 year ago (%) - Other Race
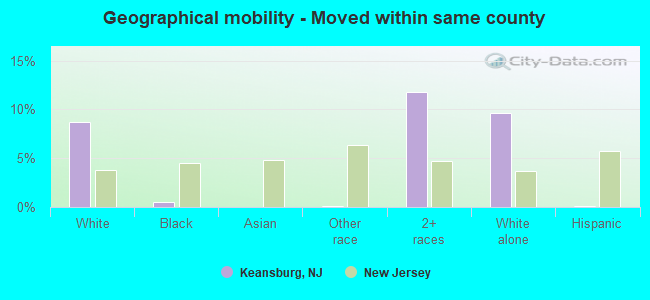
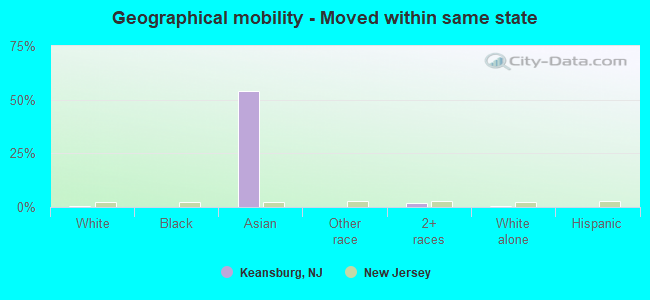
Geographical mobility - Moved within same county (%)
Geographical mobility - Moved within same county (%) - White
Geographical mobility - Moved within same county (%) - Black or African American
Geographical mobility - Moved within same county (%) - Asian
Geographical mobility - Moved within same county (%) - Hispanic or Latino
Geographical mobility - Moved within same county (%) - American Indian and Alaska Native
Geographical mobility - Moved within same county (%) - Multirace
Geographical mobility - Moved within same county (%) - Other Race
Geographical mobility - Moved from different county within same state (%)
Geographical mobility - Moved from different county within same state (%) - White
Geographical mobility - Moved from different county within same state (%) - Black or African American
Geographical mobility - Moved from different county within same state (%) - Asian
Geographical mobility - Moved from different county within same state (%) - Hispanic or Latino
Geographical mobility - Moved from different county within same state (%) - American Indian and Alaska Native
Geographical mobility - Moved from different county within same state (%) - Multirace
Geographical mobility - Moved from different county within same state (%) - Other Race
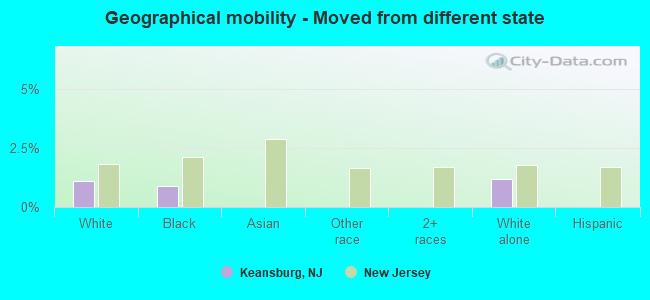
Geographical mobility - Moved from different state (%)
Geographical mobility - Moved from different state (%) - White
Geographical mobility - Moved from different state (%) - Black or African American
Geographical mobility - Moved from different state (%) - Asian
Geographical mobility - Moved from different state (%) - Hispanic or Latino
Geographical mobility - Moved from different state (%) - American Indian and Alaska Native
Geographical mobility - Moved from different state (%) - Multirace
Geographical mobility - Moved from different state (%) - Other Race
Geographical mobility - Moved from abroad (%)
Geographical mobility - Moved from abroad (%) - White
Geographical mobility - Moved from abroad (%) - Black or African American
Geographical mobility - Moved from abroad (%) - Asian
Geographical mobility - Moved from abroad (%) - Hispanic or Latino
Geographical mobility - Moved from abroad (%) - American Indian and Alaska Native
Geographical mobility - Moved from abroad (%) - Multirace
Geographical mobility - Moved from abroad (%) - Other Race
Place of birth for the foreign-born population - Ireland (%)
Place of birth for the foreign-born population - Denmark (%)
Place of birth for the foreign-born population - Norway (%)
Place of birth for the foreign-born population - Sweden (%)
Place of birth for the foreign-born population - United Kingdom (%)
Place of birth for the foreign-born population - England (%)
Place of birth for the foreign-born population - Scotland (%)
Place of birth for the foreign-born population - Other Northern Europe (%)
Place of birth for the foreign-born population - Austria (%)
Place of birth for the foreign-born population - Belgium (%)
Place of birth for the foreign-born population - France (%)
Place of birth for the foreign-born population - Germany (%)
Place of birth for the foreign-born population - Netherlands (%)
Place of birth for the foreign-born population - Switzerland (%)
Place of birth for the foreign-born population - Other Western Europe (%)
Place of birth for the foreign-born population - Greece (%)
Place of birth for the foreign-born population - Italy (%)
Place of birth for the foreign-born population - Portugal (%)
Place of birth for the foreign-born population - Spain (%)
Place of birth for the foreign-born population - Other Southern Europe (%)
Place of birth for the foreign-born population - Albania (%)
Place of birth for the foreign-born population - Belarus (%)
Place of birth for the foreign-born population - Bosnia and Herzegovina (%)
Place of birth for the foreign-born population - Bulgaria (%)
Place of birth for the foreign-born population - Croatia (%)
Place of birth for the foreign-born population - Czechoslovakia (%)
Place of birth for the foreign-born population - Hungary (%)
Place of birth for the foreign-born population - Latvia (%)
Place of birth for the foreign-born population - Lithuania (%)
Place of birth for the foreign-born population - North Macedonia (Macedonia) (%)
Place of birth for the foreign-born population - Moldova (%)
Place of birth for the foreign-born population - Poland (%)
Place of birth for the foreign-born population - Romania (%)
Place of birth for the foreign-born population - Russia (%)
Place of birth for the foreign-born population - Serbia (%)
Place of birth for the foreign-born population - Ukraine (%)
Place of birth for the foreign-born population - Other Eastern Europe (%)
Place of birth for the foreign-born population - China (%)
Place of birth for the foreign-born population - Hong Kong (%)
Place of birth for the foreign-born population - Taiwan (%)
Place of birth for the foreign-born population - Japan (%)
Place of birth for the foreign-born population - Korea (%)
Place of birth for the foreign-born population - Other Eastern Asia (%)
Place of birth for the foreign-born population - Afghanistan (%)
Place of birth for the foreign-born population - Bangladesh (%)
Place of birth for the foreign-born population - India (%)
Place of birth for the foreign-born population - Iran (%)
Place of birth for the foreign-born population - Kazakhstan (%)
Place of birth for the foreign-born population - Nepal (%)
Place of birth for the foreign-born population - Pakistan (%)
Place of birth for the foreign-born population - Sri Lanka (%)
Place of birth for the foreign-born population - Uzbekistan (%)
Place of birth for the foreign-born population - Other South Central Asia (%)
Place of birth for the foreign-born population - Burma (%)
Place of birth for the foreign-born population - Cambodia (%)
Place of birth for the foreign-born population - Indonesia (%)
Place of birth for the foreign-born population - Laos (%)
Place of birth for the foreign-born population - Malaysia (%)
Place of birth for the foreign-born population - Philippines (%)
Place of birth for the foreign-born population - Singapore (%)
Place of birth for the foreign-born population - Thailand (%)
Place of birth for the foreign-born population - Vietnam (%)
Place of birth for the foreign-born population - Other South Eastern Asia (%)
Place of birth for the foreign-born population - Armenia (%)
Place of birth for the foreign-born population - Iraq (%)
Place of birth for the foreign-born population - Israel (%)
Place of birth for the foreign-born population - Jordan (%)
Place of birth for the foreign-born population - Kuwait (%)
Place of birth for the foreign-born population - Lebanon (%)
Place of birth for the foreign-born population - Saudi Arabia (%)
Place of birth for the foreign-born population - Syria (%)
Place of birth for the foreign-born population - Turkey (%)
Place of birth for the foreign-born population - Yemen (%)
Place of birth for the foreign-born population - Other Western Asia (%)
Place of birth for the foreign-born population - Eritrea (%)
Place of birth for the foreign-born population - Ethiopia (%)
Place of birth for the foreign-born population - Kenya (%)
Place of birth for the foreign-born population - Somalia (%)
Place of birth for the foreign-born population - Uganda (%)
Place of birth for the foreign-born population - Zimbabwe (%)
Place of birth for the foreign-born population - Other Eastern Africa (%)
Place of birth for the foreign-born population - Cameroon (%)
Place of birth for the foreign-born population - Congo (%)
Place of birth for the foreign-born population - Democratic Republic of Congo (Zaire) (%)
Place of birth for the foreign-born population - Other Middle Africa (%)
Place of birth for the foreign-born population - Egypt (%)
Place of birth for the foreign-born population - Morocco (%)
Place of birth for the foreign-born population - Sudan (%)
Place of birth for the foreign-born population - Other Northern Africa (%)
Place of birth for the foreign-born population - South Africa (%)
Place of birth for the foreign-born population - Other Southern Africa (%)
Place of birth for the foreign-born population - Cabo Verde (%)
Place of birth for the foreign-born population - Ghana (%)
Place of birth for the foreign-born population - Liberia (%)
Place of birth for the foreign-born population - Nigeria (%)
Place of birth for the foreign-born population - Senegal (%)
Place of birth for the foreign-born population - Sierra Leone (%)
Place of birth for the foreign-born population - Other Western Africa (%)
Place of birth for the foreign-born population - Australia (%)
Place of birth for the foreign-born population - New Zealand (%)
Place of birth for the foreign-born population - Fiji (%)
Place of birth for the foreign-born population - Micronesia (%)
Place of birth for the foreign-born population - Bahamas (%)
Place of birth for the foreign-born population - Barbados (%)
Place of birth for the foreign-born population - Cuba (%)
Place of birth for the foreign-born population - Dominica (%)
Place of birth for the foreign-born population - Dominican Republic (%)
Place of birth for the foreign-born population - Grenada (%)
Place of birth for the foreign-born population - Haiti (%)
Place of birth for the foreign-born population - Jamaica (%)
Place of birth for the foreign-born population - St. Vincent and the Grenadines (%)
Place of birth for the foreign-born population - Trinidad and Tobago (%)
Place of birth for the foreign-born population - West Indies (%)
Place of birth for the foreign-born population - Other Caribbean (%)
Place of birth for the foreign-born population - Belize (%)
Place of birth for the foreign-born population - Costa Rica (%)
Place of birth for the foreign-born population - El Salvador (%)
Place of birth for the foreign-born population - Guatemala (%)
Place of birth for the foreign-born population - Honduras (%)
Place of birth for the foreign-born population - Mexico (%)
Place of birth for the foreign-born population - Nicaragua (%)
Place of birth for the foreign-born population - Panama (%)
Place of birth for the foreign-born population - Other Central America (%)
Place of birth for the foreign-born population - Argentina (%)
Place of birth for the foreign-born population - Bolivia (%)
Place of birth for the foreign-born population - Brazil (%)
Place of birth for the foreign-born population - Chile (%)
Place of birth for the foreign-born population - Colombia (%)
Place of birth for the foreign-born population - Ecuador (%)
Place of birth for the foreign-born population - Guyana (%)
Place of birth for the foreign-born population - Peru (%)
Place of birth for the foreign-born population - Uruguay (%)
Place of birth for the foreign-born population - Venezuela (%)
Place of birth for the foreign-born population - Other South America (%)
Place of birth for the foreign-born population - Canada (%)
Place of birth for the foreign-born population - Other Northern America (%)
Place of birth for the foreign-born population - Other (%)
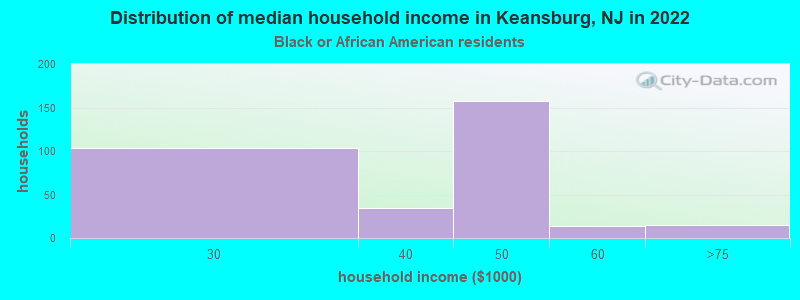
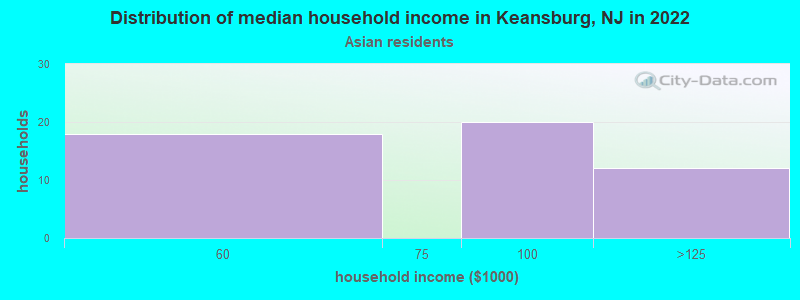
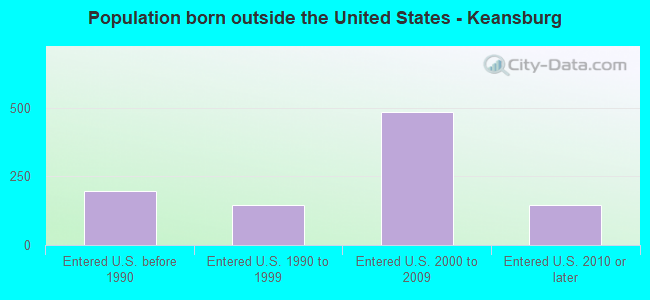
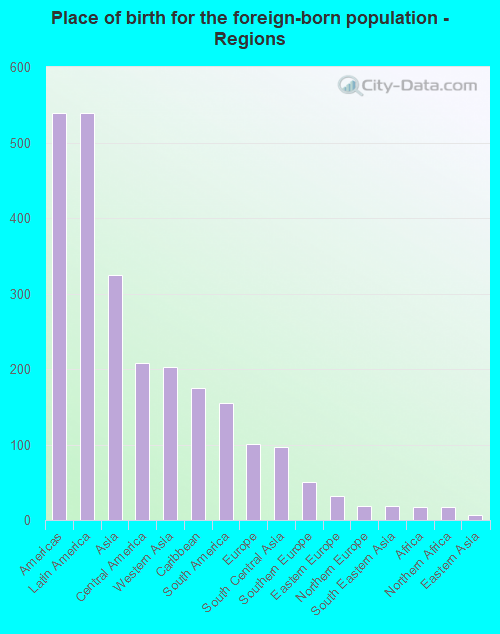
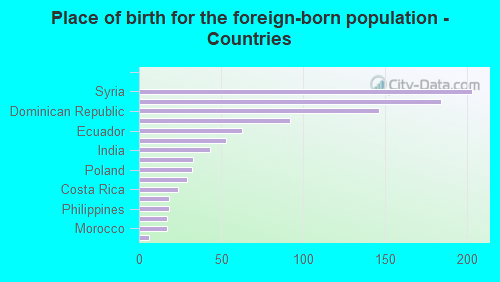
According to 2022 data, the most numerous races in Keansburg, NJ are White alone (6,660 residents), Hispanic (1,653 residents), and Black alone (745 residents). 82.7% of Keansburg residents speak English at home. 10.1% of Keansburg, NJ residents are foreign-born (5.4% born in Latin America, 3.3% born in Asia, 1.0% born in Europe), which is 128.5% less than the foreign-born rate of 23.0% across the entire state of New Jersey.
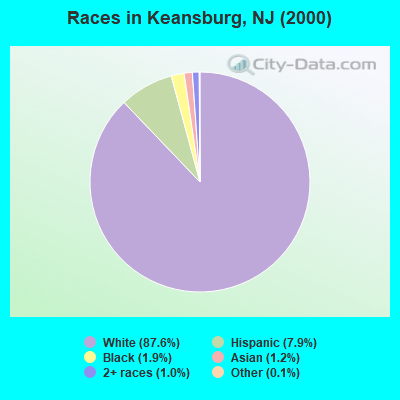
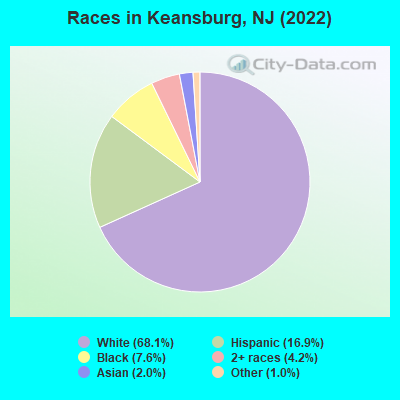
Race distribution in Keansburg
2000 2022
5,557,209 66.0% White alone 1,117,191 13.3% Hispanic 1,096,171 13.0% Black alone 477,012 5.7% Asian alone 133,689 1.6% Two or more races 19,565 0.2% Other race alone 11,338 0.1% American Indian alone 2,175 0.03% Native Hawaiian and Other
4,766,476 51.5% White alone 2,028,470 21.9% Hispanic 1,111,632 12.0% Black alone 923,546 10.0% Asian alone 332,237 3.6% Two or more races 89,847 1.0% Other race alone 8,557 0.09% American Indian alone 934 0.01% Native Hawaiian and Other
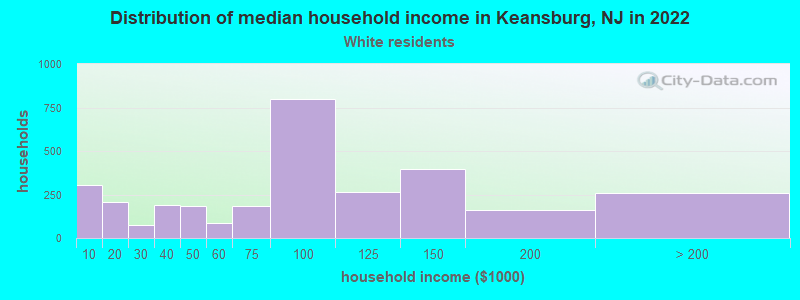
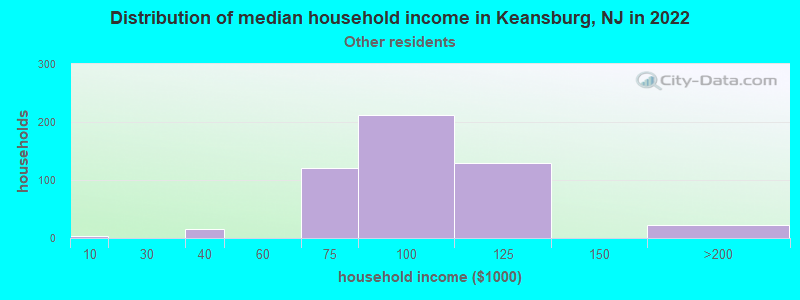
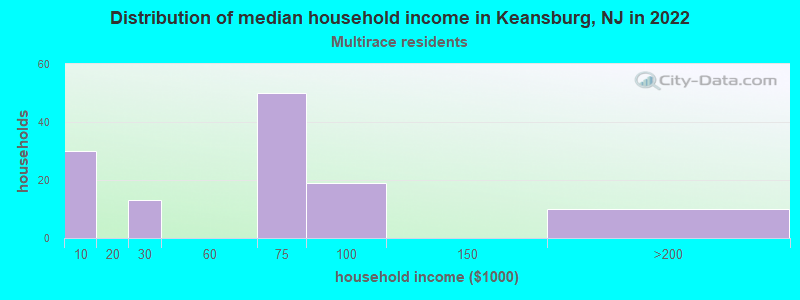
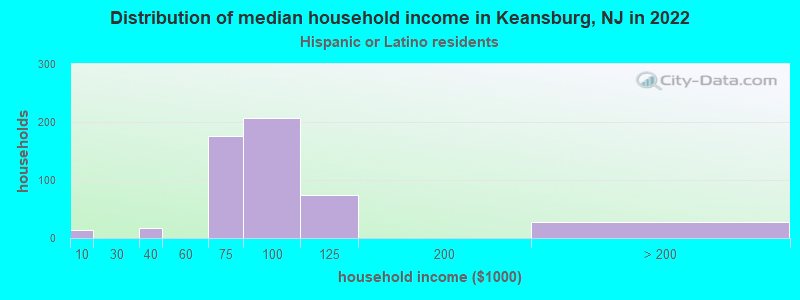
Income and house value in Keansburg Median household income in 2022 $84,369 White non-Hispanic householders$28,607 Black householders$94,086 Some other race householders$61,469 Two or more races householders$99,523 Hispanic or Latino race householdersMedian 2022 house value $273,769 White Non-Hispanic householders$311,367 Black or African American householders$382,942 American Indian or Alaska Native householders $330,862 Asian householders$452,568 Some other race householders$313,316 Two or more races householders$269,034 Hispanic or Latino householders
Median age by race in Keansburg
50.8 Median age for White residents49.0 51.4 25.6 Median age for Black or African American residents16.9 27.5 -501,872,658.7 Median age for American Indian / Alaska Native residents-594,464,500.0 -447,596,532.3 28.5 Median age for Asian residents27.9 24.2 -804,177,544.9 Median age for Native Hawaiian / Pacific Islander residents-860,335,194.7 -713,070,378.3 40.0 Median age for Other race residents56.5 35.3 40.9 Median age for Two or more races residents43.3 14.0 52.9 Median age for White alone residents54.3 52.7 31.5 Median age for Hispanic or Latino residents39.9 26.6
Owner/renter occupied households by race in Keansburg
House owners and renters - White residents 1,775 59.5% Owner occupied1,208 40.5% Renter occupiedHouse owners and renters - Black or African American residents 23 9.1% Owner occupied227 90.9% Renter occupiedHouse owners and renters - Asian residents 92 100.0% Renter occupiedHouse owners and renters - Other race residents 256 49.5% Owner occupied261 50.5% Renter occupiedHouse owners and renters - Two or more races residents 51 35.2% Owner occupied94 64.8% Renter occupiedHouse owners and renters - White alone residents 1,764 59.0% Owner occupied1,227 41.0% Renter occupiedHouse owners and renters - Hispanic or Latino residents 221 47.4% Owner occupied246 52.6% Renter occupied
Language usage in Keansburg
English speakers - Total 82.7% of residents of Keansburg speak English at home.
9.8% of residents speak Spanish at home 601 65.0% Speak English very well324 35.0% Speak English less than very well6.3% of residents speak other language at home 425 70.8% Speak English very well175 29.2% Speak English less than very well
English speakers - Born in the United States 85.7% of residents of Keansburg speak English at home.
8.3% of residents speak Spanish at home 160 83.8% Speak English very well31 16.2% Speak English less than very well6.2% of residents speak other language at home 143 100.0% Speak English very well
English speakers - Foreign-born 7.0% of residents of Keansburg speak English at home.
46.6% of residents speak Spanish at home 215 47.0% Speak English very well242 53.0% Speak English less than very well44.0% of residents speak other language at home 257 59.5% Speak English very well175 40.5% Speak English less than very well
White (Caucasian) - Speak only English Native:
97.5% (6,360)Foreign-born:
16.5% (43)
White (Caucasian) - Speak another language Native:
2.9% (189)Foreign-born:
84.0% (219)
Asian - Speak another language Native:
57.0% (36)Foreign-born:
100.0% (128)
Other race - Speak another language Native:
73.4% (558)Foreign-born:
96.1% (507)
Two or more races - Speak only English Native:
100.0% (483)Foreign-born:
9.0% (20)
White alone - Speak only English Native:
98.7% (6,124)Foreign-born:
14.6% (45)
White alone - Speak another language Native:
1.5% (93)Foreign-born:
89.5% (273)
Hispanic or Latino - Speak another language Native:
50.0% (536)Foreign-born:
96.5% (471)
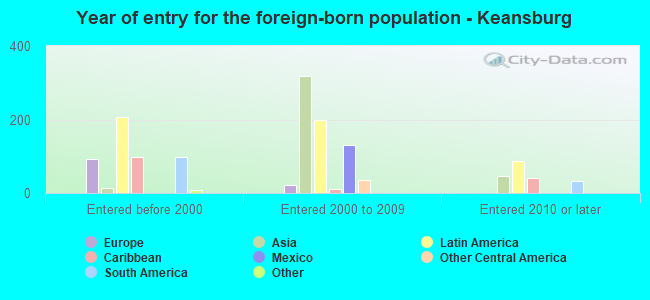
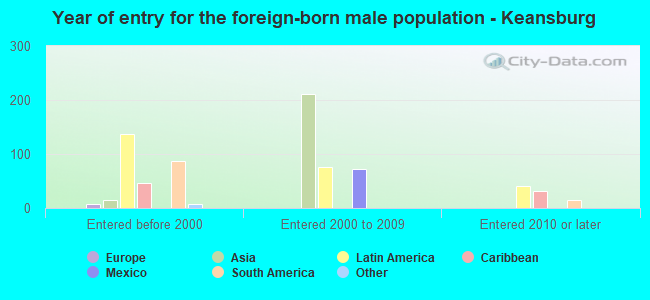
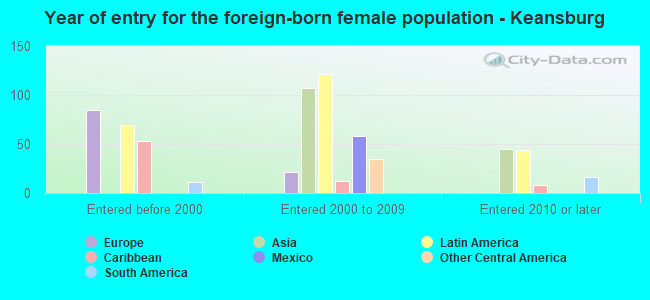
Foreign-born residents in Keansburg 984 residents are foreign born (5.4% Latin America , 3.3% Asia , 1.0% Europe ).
This city:
10.1%New Jersey:
23.2%
Marital status for residents in Keansburg Marital status - White (Caucasian) population 15 years and over
Males 46.2% Never married38.5% Now married1.2% Separated1.0% Widowed13.0% DivorcedFemales 34.6% Never married37.6% Now married3.5% Separated8.7% Widowed15.5% DivorcedWomen who gave birth in the past 12 months Now married:
0.0% (0)Unmarried:
100.0% (8)
Women who did not give birth in the past 12 months Now married:
36.7% (546)Unmarried:
63.3% (943)
Marital status - Black or African American population 15 years and over
Males 68.6% Never married9.6% Now married0.0% Separated0.0% Widowed21.8% DivorcedFemales 72.1% Never married3.6% Now married20.4% Separated2.1% Widowed1.8% DivorcedWomen who did not give birth in the past 12 months Now married:
29.2% (68)Unmarried:
70.8% (164)
Marital status - Asian population 15 years and over
Males 72.9% Never married21.5% Now married0.0% Separated5.6% Widowed0.0% DivorcedFemales 21.3% Never married78.7% Now married0.0% Separated0.0% Widowed0.0% DivorcedWomen who gave birth in the past 12 months Now married:
100.0% (9)Unmarried:
0.0% (0)
Women who did not give birth in the past 12 months Now married:
70.5% (32)Unmarried:
29.5% (13)
Marital status - Other race population 15 years and over
Males 21.5% Never married78.5% Now married0.0% Separated0.0% Widowed0.0% DivorcedFemales 46.3% Never married52.6% Now married0.0% Separated0.0% Widowed1.1% DivorcedWomen who did not give birth in the past 12 months Now married:
42.4% (188)Unmarried:
57.6% (255)
Marital status - Two or more races population 15 years and over
Males 22.8% Never married49.8% Now married0.0% Separated0.0% Widowed27.4% DivorcedFemales 28.0% Never married56.8% Now married0.0% Separated0.0% Widowed15.2% DivorcedWomen who did not give birth in the past 12 months Now married:
52.1% (54)Unmarried:
47.9% (50)
Marital status - White alone, not Hispanic / Latino population 15 years and over
Males 44.0% Never married39.6% Now married1.3% Separated1.0% Widowed14.0% DivorcedFemales 33.5% Never married37.8% Now married3.5% Separated9.0% Widowed16.1% DivorcedWomen who gave birth in the past 12 months Now married:
0.0% (0)Unmarried:
100.0% (9)
Women who did not give birth in the past 12 months Now married:
37.1% (530)Unmarried:
62.9% (899)
Marital status - Hispanic or Latino population 15 years and over
Males 43.7% Never married45.4% Now married0.0% Separated0.0% Widowed10.9% DivorcedFemales 47.3% Never married51.4% Now married0.6% Separated0.0% Widowed0.8% DivorcedWomen who did not give birth in the past 12 months Now married:
41.4% (179)Unmarried:
58.6% (254)
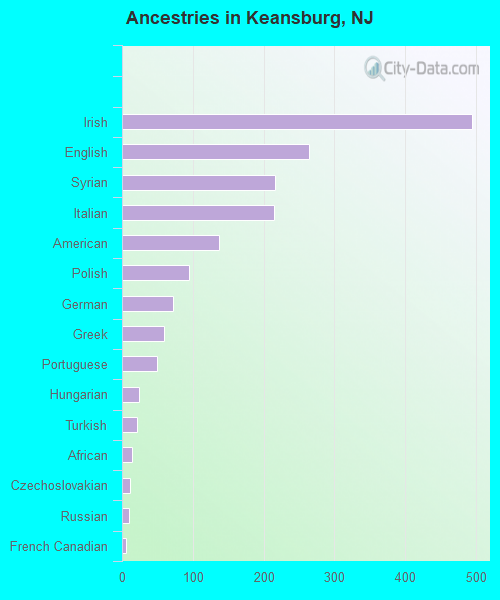
Ancestries in Keansburg
494 15.2% Irish265 8.1% English216 6.6% Syrian215 6.6% Italian137 4.2% American94 2.9% Polish72 2.2% German59 1.8% Greek49 1.5% Portuguese24 0.7% Hungarian21 0.6% Turkish14 0.4% African11 0.3% Czechoslovakian10 0.3% Russian6 0.2% French Canadian
Children Nativity (place of birth) in Keansburg
Children under 6 years - Living with two parents Both parents native 87 100.0% NativeOne native, one foreign-born parent 10 100.0% NativeChildren under 6 years - Living with one parent Native parent 199 100.0% Native
Children 6 to 17 years - Living with two parents Both parents native 262 100.0% NativeBoth parents foreign-born 322 100.0% NativeOne native, one foreign-born parent 72 100.0% NativeChildren 6 to 17 years - Living with one parent Native parent 824 100.0% Native
Grandparents responsible for own grandchildren in Keansburg
Grandparents (30 to 59 years) White / Caucasian 68 87.5% Responsible for grandchildren10 12.5% Not responsible for grandchildrenBlack or African American 33 100.0% Not responsible for grandchildrenAsian 12 100.0% Not responsible for grandchildrenWhite alone, not Hispanic / Latino 22 66.4% Responsible for grandchildren11 33.6% Not responsible for grandchildrenGrandparents (60 years and over) White / Caucasian 70 58.1% Responsible for grandchildren50 41.9% Not responsible for grandchildrenWhite alone, not Hispanic / Latino 71 61.7% Responsible for grandchildren44 38.3% Not responsible for grandchildren