Races in Kiefer, Oklahoma (OK) Detailed Stats
Data:
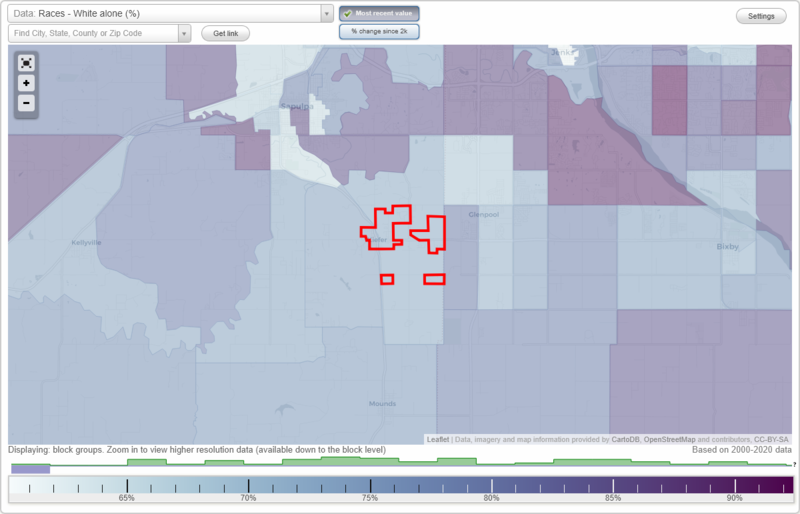
Races - White alone (%)
Races - White alone (% change since 2000)
Races - Black alone (%)
Races - Black alone (% change since 2000)
Races - American Indian alone (%)
Races - American Indian alone (% change since 2000)
Races - Asian alone (%)
Races - Asian alone (% change since 2000)
Races - Hispanic (%)
Races - Hispanic (% change since 2000)
Races - Native Hawaiian and Other Pacific Islander alone (%)
Races - Native Hawaiian and Other Pacific Islander alone (% change since 2000)
Races - Two or more races(%)
Races - Two or more races(% change since 2000)
Races - Other race alone (%)
Races - Other race alone (% change since 2000)
Racial diversity
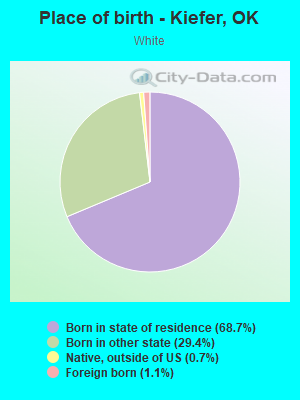
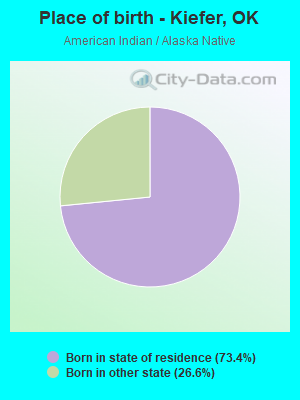
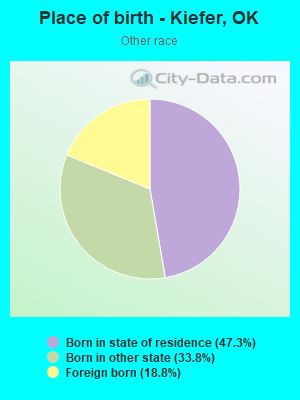
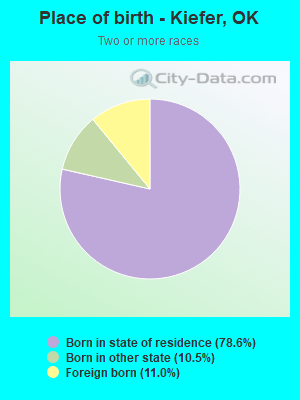
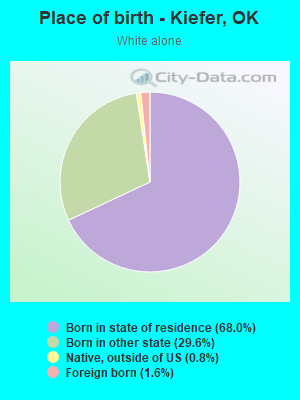
Place of birth - Born in state of residence (%)
Place of birth - Born in state of residence (%) - White
Place of birth - Born in state of residence (%) - Black or African American
Place of birth - Born in state of residence (%) - Asian
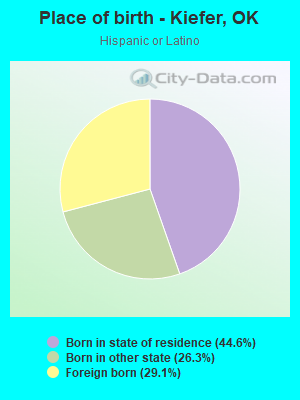
Place of birth - Born in state of residence (%) - Hispanic or Latino
Place of birth - Born in state of residence (%) - American Indian and Alaska Native
Place of birth - Born in state of residence (%) - Multirace
Place of birth - Born in state of residence (%) - Other Race
Place of birth - Born in other state (%)
Place of birth - Born in other state (%) - White
Place of birth - Born in other state (%) - Black or African American
Place of birth - Born in other state (%) - Asian
Place of birth - Born in other state (%) - Hispanic or Latino
Place of birth - Born in other state (%) - American Indian and Alaska Native
Place of birth - Born in other state (%) - Multirace
Place of birth - Born in other state (%) - Other Race
Place of birth - Native, outside of US (%)
Place of birth - Native, outside of US (%) - White
Place of birth - Native, outside of US (%) - Black or African American
Place of birth - Native, outside of US (%) - Asian
Place of birth - Native, outside of US (%) - Hispanic or Latino
Place of birth - Native, outside of US (%) - American Indian and Alaska Native
Place of birth - Native, outside of US (%) - Multirace
Place of birth - Native, outside of US (%) - Other Race
Place of birth - Foreign born (%)
Place of birth - Foreign born (%) - White
Place of birth - Foreign born (%) - Black or African American
Place of birth - Foreign born (%) - Asian
Place of birth - Foreign born (%) - Hispanic or Latino
Place of birth - Foreign born (%) - American Indian and Alaska Native
Place of birth - Foreign born (%) - Multirace
Place of birth - Foreign born (%) - Other Race
Residents speaking English at home (%)
Residents speaking English at home - Born in the United States (%)
Residents speaking English at home - Native, born elsewhere (%)
Residents speaking English at home - Foreign born (%)
Residents speaking Spanish at home (%)
Residents speaking Spanish at home - Born in the United States (%)
Residents speaking Spanish at home - Native, born elsewhere (%)
Residents speaking Spanish at home - Foreign born (%)
Residents speaking other language at home (%)
Residents speaking other language at home - Born in the United States (%)
Residents speaking other language at home - Native, born elsewhere (%)
Residents speaking other language at home - Foreign born (%)
Marital status - Never married (%)
Marital status - Now married (%)
Marital status - Separated (%)
Marital status - Widowed (%)
Marital status - Divorced (%)
Ancestries Reported - Arab (%)
Ancestries Reported - Czech (%)
Ancestries Reported - Danish (%)
Ancestries Reported - Dutch (%)
Ancestries Reported - English (%)
Ancestries Reported - French (%)
Ancestries Reported - French Canadian (%)
Ancestries Reported - German (%)
Ancestries Reported - Greek (%)
Ancestries Reported - Hungarian (%)
Ancestries Reported - Irish (%)
Ancestries Reported - Italian (%)
Ancestries Reported - Lithuanian (%)
Ancestries Reported - Norwegian (%)
Ancestries Reported - Polish (%)
Ancestries Reported - Portuguese (%)
Ancestries Reported - Russian (%)
Ancestries Reported - Scotch-Irish (%)
Ancestries Reported - Scottish (%)
Ancestries Reported - Slovak (%)
Ancestries Reported - Subsaharan African (%)
Ancestries Reported - Swedish (%)
Ancestries Reported - Swiss (%)
Ancestries Reported - Ukrainian (%)
Ancestries Reported - United States (%)
Ancestries Reported - Welsh (%)
Ancestries Reported - West Indian (%)
Ancestries Reported - Other (%)
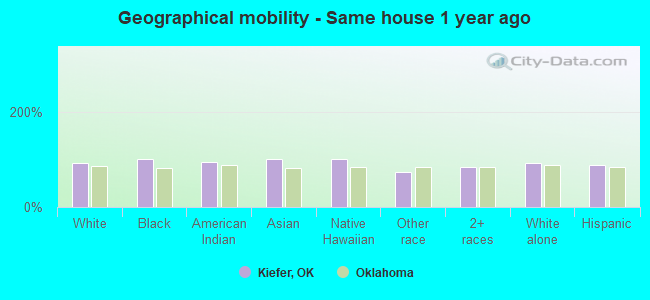
Geographical mobility - Same house 1 year ago (%)
Geographical mobility - Same house 1 year ago (%) - White
Geographical mobility - Same house 1 year ago (%) - Black or African American
Geographical mobility - Same house 1 year ago (%) - Asian
Geographical mobility - Same house 1 year ago (%) - Hispanic or Latino
Geographical mobility - Same house 1 year ago (%) - American Indian and Alaska Native
Geographical mobility - Same house 1 year ago (%) - Multirace
Geographical mobility - Same house 1 year ago (%) - Other Race
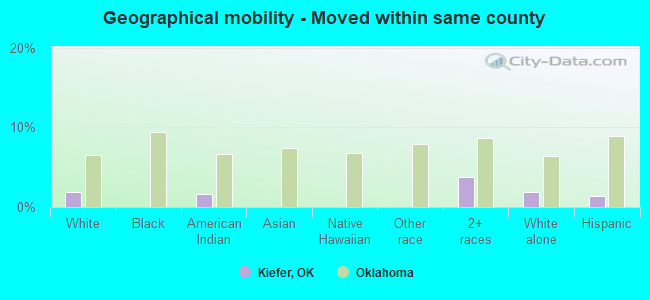
Geographical mobility - Moved within same county (%)
Geographical mobility - Moved within same county (%) - White
Geographical mobility - Moved within same county (%) - Black or African American
Geographical mobility - Moved within same county (%) - Asian
Geographical mobility - Moved within same county (%) - Hispanic or Latino
Geographical mobility - Moved within same county (%) - American Indian and Alaska Native
Geographical mobility - Moved within same county (%) - Multirace
Geographical mobility - Moved within same county (%) - Other Race
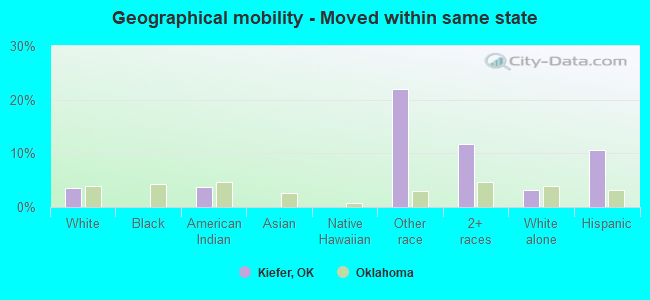
Geographical mobility - Moved from different county within same state (%)
Geographical mobility - Moved from different county within same state (%) - White
Geographical mobility - Moved from different county within same state (%) - Black or African American
Geographical mobility - Moved from different county within same state (%) - Asian
Geographical mobility - Moved from different county within same state (%) - Hispanic or Latino
Geographical mobility - Moved from different county within same state (%) - American Indian and Alaska Native
Geographical mobility - Moved from different county within same state (%) - Multirace
Geographical mobility - Moved from different county within same state (%) - Other Race
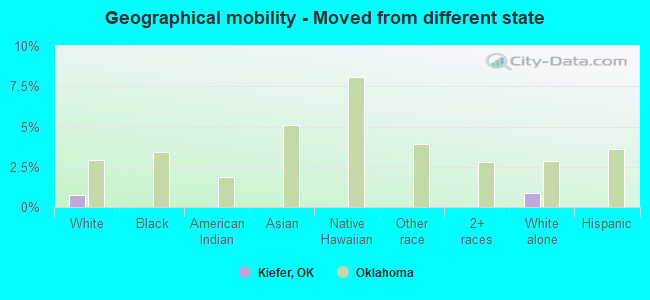
Geographical mobility - Moved from different state (%)
Geographical mobility - Moved from different state (%) - White
Geographical mobility - Moved from different state (%) - Black or African American
Geographical mobility - Moved from different state (%) - Asian
Geographical mobility - Moved from different state (%) - Hispanic or Latino
Geographical mobility - Moved from different state (%) - American Indian and Alaska Native
Geographical mobility - Moved from different state (%) - Multirace
Geographical mobility - Moved from different state (%) - Other Race
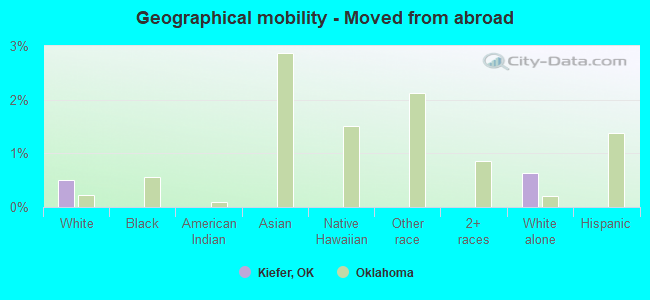
Geographical mobility - Moved from abroad (%)
Geographical mobility - Moved from abroad (%) - White
Geographical mobility - Moved from abroad (%) - Black or African American
Geographical mobility - Moved from abroad (%) - Asian
Geographical mobility - Moved from abroad (%) - Hispanic or Latino
Geographical mobility - Moved from abroad (%) - American Indian and Alaska Native
Geographical mobility - Moved from abroad (%) - Multirace
Geographical mobility - Moved from abroad (%) - Other Race
Place of birth for the foreign-born population - Ireland (%)
Place of birth for the foreign-born population - Denmark (%)
Place of birth for the foreign-born population - Norway (%)
Place of birth for the foreign-born population - Sweden (%)
Place of birth for the foreign-born population - United Kingdom (%)
Place of birth for the foreign-born population - England (%)
Place of birth for the foreign-born population - Scotland (%)
Place of birth for the foreign-born population - Other Northern Europe (%)
Place of birth for the foreign-born population - Austria (%)
Place of birth for the foreign-born population - Belgium (%)
Place of birth for the foreign-born population - France (%)
Place of birth for the foreign-born population - Germany (%)
Place of birth for the foreign-born population - Netherlands (%)
Place of birth for the foreign-born population - Switzerland (%)
Place of birth for the foreign-born population - Other Western Europe (%)
Place of birth for the foreign-born population - Greece (%)
Place of birth for the foreign-born population - Italy (%)
Place of birth for the foreign-born population - Portugal (%)
Place of birth for the foreign-born population - Spain (%)
Place of birth for the foreign-born population - Other Southern Europe (%)
Place of birth for the foreign-born population - Albania (%)
Place of birth for the foreign-born population - Belarus (%)
Place of birth for the foreign-born population - Bosnia and Herzegovina (%)
Place of birth for the foreign-born population - Bulgaria (%)
Place of birth for the foreign-born population - Croatia (%)
Place of birth for the foreign-born population - Czechoslovakia (%)
Place of birth for the foreign-born population - Hungary (%)
Place of birth for the foreign-born population - Latvia (%)
Place of birth for the foreign-born population - Lithuania (%)
Place of birth for the foreign-born population - North Macedonia (Macedonia) (%)
Place of birth for the foreign-born population - Moldova (%)
Place of birth for the foreign-born population - Poland (%)
Place of birth for the foreign-born population - Romania (%)
Place of birth for the foreign-born population - Russia (%)
Place of birth for the foreign-born population - Serbia (%)
Place of birth for the foreign-born population - Ukraine (%)
Place of birth for the foreign-born population - Other Eastern Europe (%)
Place of birth for the foreign-born population - China (%)
Place of birth for the foreign-born population - Hong Kong (%)
Place of birth for the foreign-born population - Taiwan (%)
Place of birth for the foreign-born population - Japan (%)
Place of birth for the foreign-born population - Korea (%)
Place of birth for the foreign-born population - Other Eastern Asia (%)
Place of birth for the foreign-born population - Afghanistan (%)
Place of birth for the foreign-born population - Bangladesh (%)
Place of birth for the foreign-born population - India (%)
Place of birth for the foreign-born population - Iran (%)
Place of birth for the foreign-born population - Kazakhstan (%)
Place of birth for the foreign-born population - Nepal (%)
Place of birth for the foreign-born population - Pakistan (%)
Place of birth for the foreign-born population - Sri Lanka (%)
Place of birth for the foreign-born population - Uzbekistan (%)
Place of birth for the foreign-born population - Other South Central Asia (%)
Place of birth for the foreign-born population - Burma (%)
Place of birth for the foreign-born population - Cambodia (%)
Place of birth for the foreign-born population - Indonesia (%)
Place of birth for the foreign-born population - Laos (%)
Place of birth for the foreign-born population - Malaysia (%)
Place of birth for the foreign-born population - Philippines (%)
Place of birth for the foreign-born population - Singapore (%)
Place of birth for the foreign-born population - Thailand (%)
Place of birth for the foreign-born population - Vietnam (%)
Place of birth for the foreign-born population - Other South Eastern Asia (%)
Place of birth for the foreign-born population - Armenia (%)
Place of birth for the foreign-born population - Iraq (%)
Place of birth for the foreign-born population - Israel (%)
Place of birth for the foreign-born population - Jordan (%)
Place of birth for the foreign-born population - Kuwait (%)
Place of birth for the foreign-born population - Lebanon (%)
Place of birth for the foreign-born population - Saudi Arabia (%)
Place of birth for the foreign-born population - Syria (%)
Place of birth for the foreign-born population - Turkey (%)
Place of birth for the foreign-born population - Yemen (%)
Place of birth for the foreign-born population - Other Western Asia (%)
Place of birth for the foreign-born population - Eritrea (%)
Place of birth for the foreign-born population - Ethiopia (%)
Place of birth for the foreign-born population - Kenya (%)
Place of birth for the foreign-born population - Somalia (%)
Place of birth for the foreign-born population - Uganda (%)
Place of birth for the foreign-born population - Zimbabwe (%)
Place of birth for the foreign-born population - Other Eastern Africa (%)
Place of birth for the foreign-born population - Cameroon (%)
Place of birth for the foreign-born population - Congo (%)
Place of birth for the foreign-born population - Democratic Republic of Congo (Zaire) (%)
Place of birth for the foreign-born population - Other Middle Africa (%)
Place of birth for the foreign-born population - Egypt (%)
Place of birth for the foreign-born population - Morocco (%)
Place of birth for the foreign-born population - Sudan (%)
Place of birth for the foreign-born population - Other Northern Africa (%)
Place of birth for the foreign-born population - South Africa (%)
Place of birth for the foreign-born population - Other Southern Africa (%)
Place of birth for the foreign-born population - Cabo Verde (%)
Place of birth for the foreign-born population - Ghana (%)
Place of birth for the foreign-born population - Liberia (%)
Place of birth for the foreign-born population - Nigeria (%)
Place of birth for the foreign-born population - Senegal (%)
Place of birth for the foreign-born population - Sierra Leone (%)
Place of birth for the foreign-born population - Other Western Africa (%)
Place of birth for the foreign-born population - Australia (%)
Place of birth for the foreign-born population - New Zealand (%)
Place of birth for the foreign-born population - Fiji (%)
Place of birth for the foreign-born population - Micronesia (%)
Place of birth for the foreign-born population - Bahamas (%)
Place of birth for the foreign-born population - Barbados (%)
Place of birth for the foreign-born population - Cuba (%)
Place of birth for the foreign-born population - Dominica (%)
Place of birth for the foreign-born population - Dominican Republic (%)
Place of birth for the foreign-born population - Grenada (%)
Place of birth for the foreign-born population - Haiti (%)
Place of birth for the foreign-born population - Jamaica (%)
Place of birth for the foreign-born population - St. Vincent and the Grenadines (%)
Place of birth for the foreign-born population - Trinidad and Tobago (%)
Place of birth for the foreign-born population - West Indies (%)
Place of birth for the foreign-born population - Other Caribbean (%)
Place of birth for the foreign-born population - Belize (%)
Place of birth for the foreign-born population - Costa Rica (%)
Place of birth for the foreign-born population - El Salvador (%)
Place of birth for the foreign-born population - Guatemala (%)
Place of birth for the foreign-born population - Honduras (%)
Place of birth for the foreign-born population - Mexico (%)
Place of birth for the foreign-born population - Nicaragua (%)
Place of birth for the foreign-born population - Panama (%)
Place of birth for the foreign-born population - Other Central America (%)
Place of birth for the foreign-born population - Argentina (%)
Place of birth for the foreign-born population - Bolivia (%)
Place of birth for the foreign-born population - Brazil (%)
Place of birth for the foreign-born population - Chile (%)
Place of birth for the foreign-born population - Colombia (%)
Place of birth for the foreign-born population - Ecuador (%)
Place of birth for the foreign-born population - Guyana (%)
Place of birth for the foreign-born population - Peru (%)
Place of birth for the foreign-born population - Uruguay (%)
Place of birth for the foreign-born population - Venezuela (%)
Place of birth for the foreign-born population - Other South America (%)
Place of birth for the foreign-born population - Canada (%)
Place of birth for the foreign-born population - Other Northern America (%)
Place of birth for the foreign-born population - Other (%)
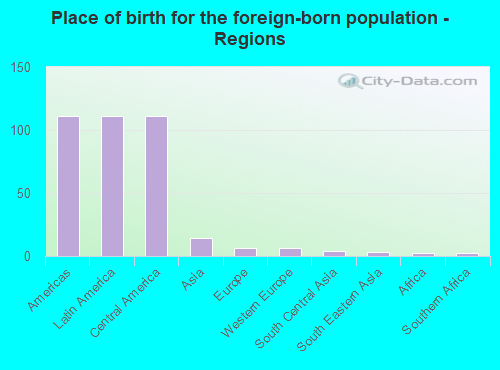
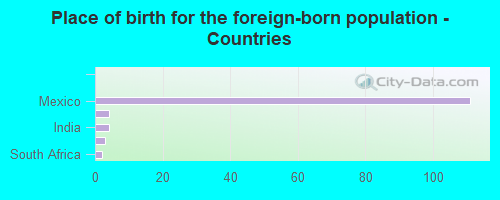
According to 2022 data, the most numerous races in Kiefer, OK are White alone (1,449 residents), Hispanic (293 residents), and Two or more races (243 residents). 91.7% of Kiefer residents speak English at home. 5.9% of Kiefer, OK residents are foreign-born (4.9% born in Latin America, 0.7% born in Asia), which is about the same as the foreign-born rate of 6.0% across the entire state of Oklahoma.
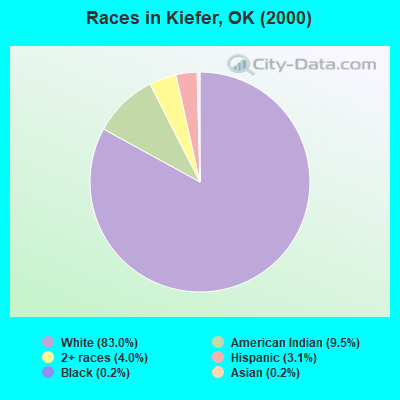
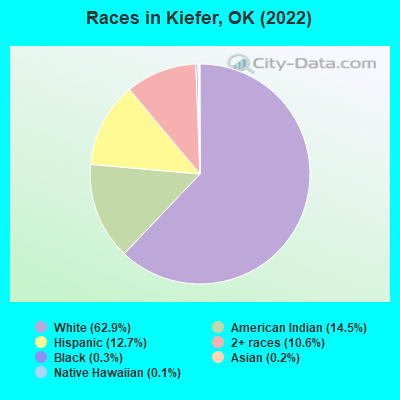
Race distribution in Kiefer
2000 2022
2,556,368 74.1% White alone 266,158 7.7% American Indian alone 257,981 7.5% Black alone 179,304 5.2% Hispanic 140,249 4.1% Two or more races 46,172 1.3% Asian alone 2,322 0.07% Other race alone 2,100 0.06% Native Hawaiian and Other
2,517,403 62.6% White alone 486,692 12.1% Hispanic 364,453 9.1% Two or more races 273,650 6.8% American Indian alone 268,543 6.7% Black alone 92,672 2.3% Asian alone 10,786 0.3% Other race alone 5,601 0.1% Native Hawaiian and Other
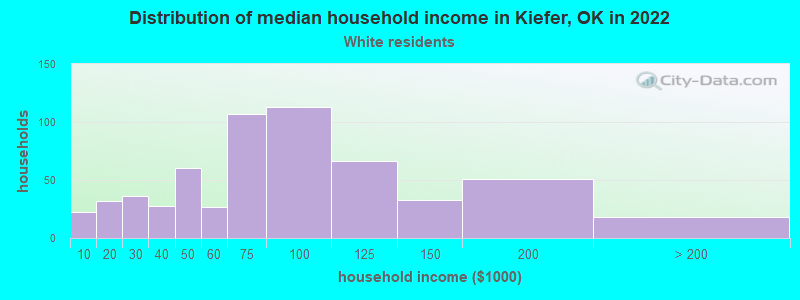
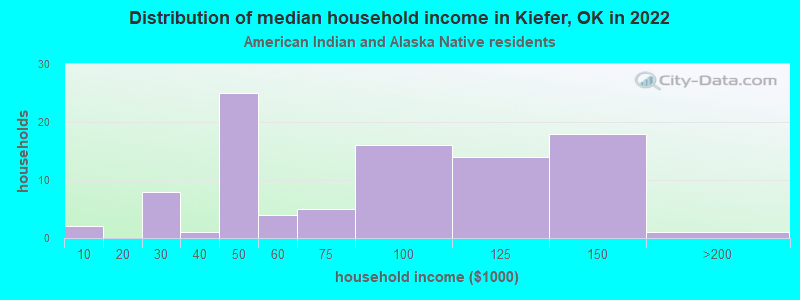
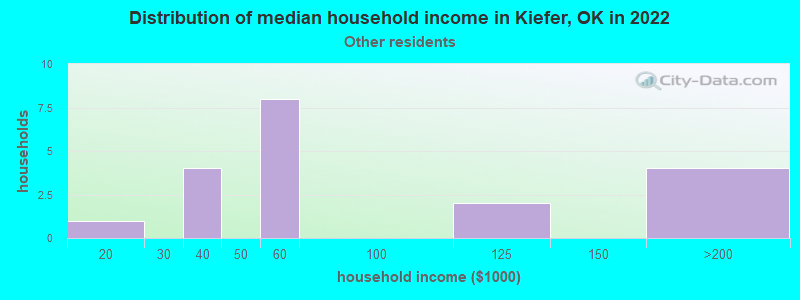
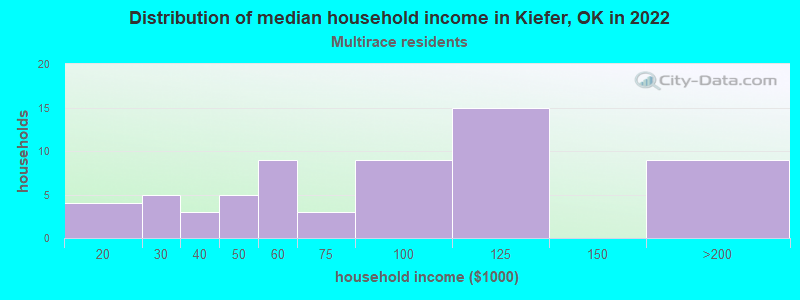
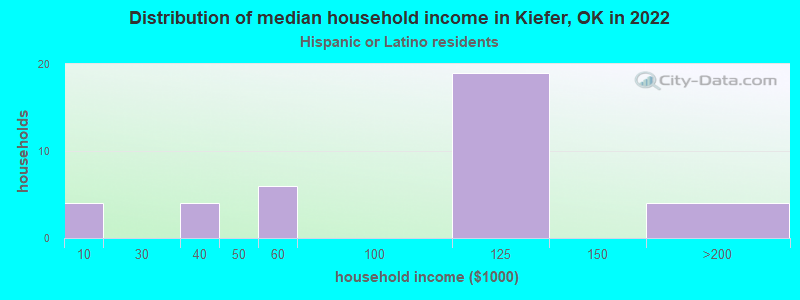
Income and house value in Kiefer Median household income in 2022 $65,974 White non-Hispanic householders$93,759 American Indian and Alaska Native householders$98,399 Two or more races householders$140,960 Hispanic or Latino race householdersMedian 2022 house value $216,300 White Non-Hispanic householders$258,320 American Indian or Alaska Native householders$366,126 Some other race householders$235,243 Two or more races householders$266,931 Hispanic or Latino householders
Median age by race in Kiefer
36.7 Median age for White residents36.7 38.4 -788,025,889.2 Median age for Black or African American residents-425,460,636.1 -797,417,271.2 31.8 Median age for American Indian / Alaska Native residents32.4 30.2 -1,038,720,537.7 Median age for Asian residents-662,601,625.4 -1,102,770,329.5 -666,666,666.0 Median age for Native Hawaiian / Pacific Islander residents-666,666,666.0 -666,666,666.0 21.4 Median age for Other race residents18.9 43.4 17.7 Median age for Two or more races residents18.0 15.9 37.5 Median age for White alone residents37.2 39.0 24.1 Median age for Hispanic or Latino residents22.4 34.4
Owner/renter occupied households by race in Kiefer
House owners and renters - White residents 491 81.0% Owner occupied115 19.0% Renter occupiedHouse owners and renters - American Indian / Alaska Native residents 58 69.1% Owner occupied26 30.9% Renter occupiedHouse owners and renters - Asian residents 5 100.0% Owner occupiedHouse owners and renters - Native Hawaiian / Pacific Islander residents 3 100.0% Renter occupiedHouse owners and renters - Other race residents 16 100.0% Owner occupiedHouse owners and renters - Two or more races residents 42 89.9% Owner occupied5 10.1% Renter occupiedHouse owners and renters - White alone residents 488 81.6% Owner occupied110 18.4% Renter occupiedHouse owners and renters - Hispanic or Latino residents 34 87.8% Owner occupied5 12.2% Renter occupied
Language usage in Kiefer
English speakers - Total 91.7% of residents of Kiefer speak English at home.
6.1% of residents speak Spanish at home 106 80.9% Speak English very well25 19.1% Speak English less than very well1.8% of residents speak other language at home 35 92.1% Speak English very well3 7.9% Speak English less than very well
English speakers - Born in the United States 95.0% of residents of Kiefer speak English at home.
2.6% of residents speak Spanish at home 15 100.0% Speak English very well1.7% of residents speak other language at home 10 100.0% Speak English very well
All residents speak only English at home
English speakers - Foreign-born 20.9% of residents of Kiefer speak English at home.
98.2% of residents speak Spanish at home 86 79.6% Speak English very well22 20.4% Speak English less than very well4.5% of residents speak other language at home 2 40.0% Speak English very well3 60.0% Speak English less than very well
White (Caucasian) - Speak only English Native:
98.2% (1,388)Foreign-born:
91.4% (16)
White (Caucasian) - Speak another language Native:
1.8% (25)Foreign-born:
15.0% (3)
Other race - Speak only English Native:
41.4% (14)Foreign-born:
8.4% (4)
Other race - Speak another language Native:
58.6% (20)Foreign-born:
91.6% (39)
Two or more races - Speak another language Native:
4.4% (12)Foreign-born:
100.0% (144)
White alone - Speak only English Native:
99.3% (1,344)Foreign-born:
63.3% (15)
White alone - Speak another language Native:
0.6% (8)Foreign-born:
7.7% (2)
Hispanic or Latino - Speak another language Native:
19.6% (30)Foreign-born:
96.1% (74)
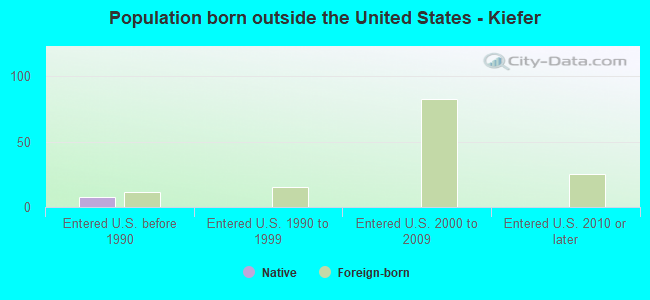
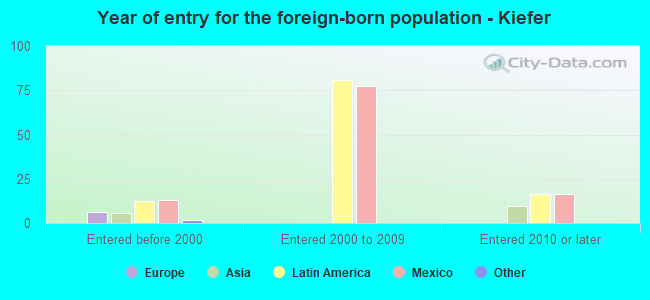
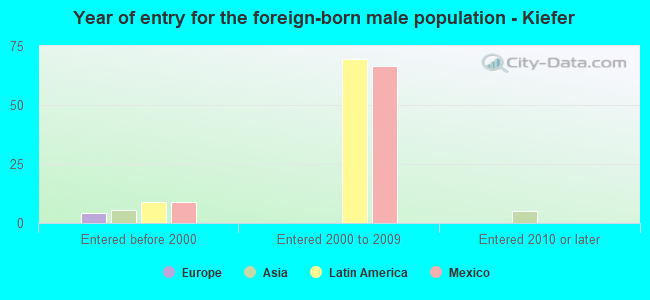
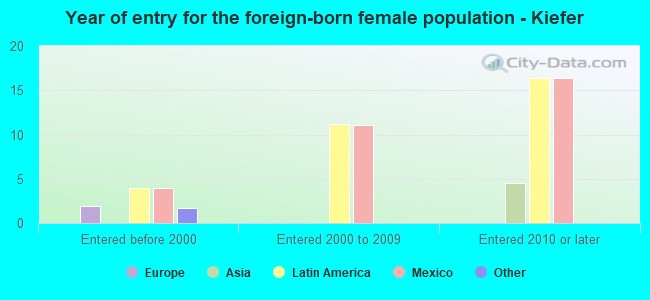
Foreign-born residents in Kiefer 136 residents are foreign born (4.9% Latin America , 0.7% Asia ).
This city:
5.9%Oklahoma:
6.1%
Marital status for residents in Kiefer Marital status - White (Caucasian) population 15 years and over
Males 21.2% Never married64.1% Now married0.6% Separated1.7% Widowed12.4% DivorcedFemales 21.7% Never married58.5% Now married0.0% Separated7.0% Widowed12.7% DivorcedWomen who gave birth in the past 12 months Now married:
76.5% (13)Unmarried:
23.5% (4)
Women who did not give birth in the past 12 months Now married:
57.7% (179)Unmarried:
42.3% (132)
Marital status - American Indian / Alaska Native population 15 years and over
Males 23.3% Never married66.3% Now married0.0% Separated2.3% Widowed8.1% DivorcedFemales 19.3% Never married50.7% Now married7.9% Separated5.0% Widowed17.1% DivorcedWomen who gave birth in the past 12 months Now married:
50.0% (10)Unmarried:
50.0% (10)
Women who did not give birth in the past 12 months Now married:
62.2% (75)Unmarried:
37.8% (45)
Marital status - Asian population 15 years and over
Males 0.0% Never married100.0% Now married0.0% Separated0.0% Widowed0.0% DivorcedFemales 0.0% Never married100.0% Now married0.0% Separated0.0% Widowed0.0% DivorcedMarital status - Other race population 15 years and over
Males 62.0% Never married26.0% Now married0.0% Separated0.0% Widowed12.0% DivorcedFemales 0.0% Never married100.0% Now married0.0% Separated0.0% Widowed0.0% DivorcedWomen who did not give birth in the past 12 months Now married:
100.0% (2)Unmarried:
0.0% (0)
Marital status - Two or more races population 15 years and over
Males 51.9% Never married45.2% Now married0.0% Separated0.0% Widowed2.9% DivorcedFemales 58.2% Never married34.5% Now married2.7% Separated0.0% Widowed4.5% DivorcedWomen who gave birth in the past 12 months Now married:
63.6% (8)Unmarried:
36.4% (5)
Women who did not give birth in the past 12 months Now married:
33.7% (36)Unmarried:
66.3% (71)
Marital status - White alone, not Hispanic / Latino population 15 years and over
Males 21.9% Never married62.9% Now married0.6% Separated1.8% Widowed12.8% DivorcedFemales 21.3% Never married59.9% Now married0.0% Separated7.2% Widowed11.6% DivorcedWomen who gave birth in the past 12 months Now married:
76.5% (13)Unmarried:
23.5% (4)
Women who did not give birth in the past 12 months Now married:
59.4% (179)Unmarried:
40.6% (122)
Marital status - Hispanic or Latino population 15 years and over
Males 44.5% Never married50.8% Now married0.0% Separated0.0% Widowed4.7% DivorcedFemales 44.2% Never married40.4% Now married0.0% Separated0.0% Widowed15.4% DivorcedWomen who did not give birth in the past 12 months Now married:
32.5% (15)Unmarried:
67.5% (31)
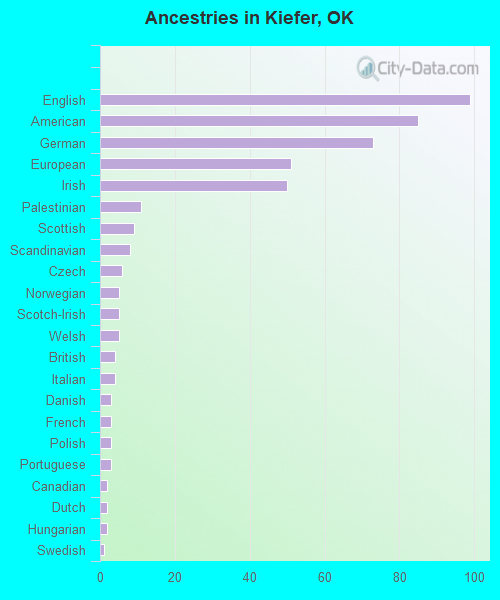
Ancestries in Kiefer
99 11.2% English85 9.6% American73 8.3% German51 5.8% European50 5.7% Irish11 1.2% Palestinian9 1.0% Scottish8 0.9% Scandinavian6 0.7% Czech5 0.6% Norwegian5 0.6% Scotch-Irish5 0.6% Welsh4 0.5% British4 0.5% Italian3 0.3% Danish3 0.3% French3 0.3% Polish3 0.3% Portuguese2 0.2% Canadian2 0.2% Dutch2 0.2% Hungarian1 0.1% Swedish
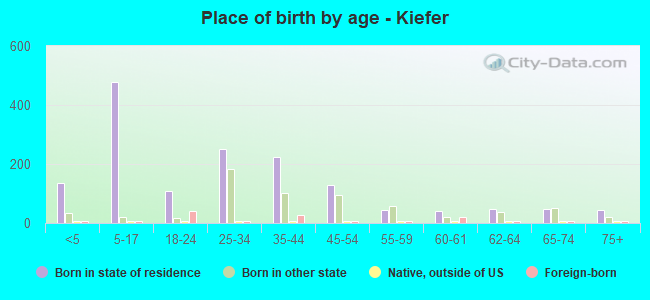
Children Nativity (place of birth) in Kiefer
Children under 6 years - Living with two parents Both parents native 135 100.0% NativeBoth parents foreign-born 9 100.0% NativeChildren under 6 years - Living with one parent Native parent 47 100.0% NativeChildren 6 to 17 years - Living with two parents Both parents native 261 100.0% NativeOne native, one foreign-born parent 14 100.0% NativeChildren 6 to 17 years - Living with one parent Native parent 143 100.0% NativeForeign-born parent 3 49.9% Native3 50.1% Foreign-born
Grandparents responsible for own grandchildren in Kiefer
Grandparents (30 to 59 years) White / Caucasian 9 64.5% Responsible for grandchildren5 35.5% Not responsible for grandchildrenBlack or African American 3 100.0% Responsible for grandchildrenAmerican Indian / Alaska Native 8 100.0% Responsible for grandchildrenTwo or more races 3 100.0% Responsible for grandchildrenWhite alone, not Hispanic / Latino 10 64.6% Responsible for grandchildren5 35.4% Not responsible for grandchildren
Grandparents (60 years and over) White / Caucasian 7 100.0% Responsible for grandchildrenWhite alone, not Hispanic / Latino 5 100.0% Responsible for grandchildren