Races in Killingworth, Connecticut (CT) Detailed Stats
Ancestries, Foreign-born residents, place of birth

Recent posts about races in Killingworth, Connecticut on our local forum with over 2,400,000 registered users:
 | Considering a move back to CT and I want to buy a house (53 replies) |
| 2024 Connecticut Town Tournament VI (Celebrating the 10-Year Anniversary & Dazzleman's Memorial) (722 replies) |
| Weekend/Second Home Suggestions & Questions from NYC (53 replies) |
| Connecticut TOWN TOURNAMENT V (2022) (831 replies) |
| Does Connecticut Have the Best Pizza in America? (457 replies) |
| The Tesla Battle in Connecticut (147 replies) |
Latest news about races in Killingworth, CT collected exclusively by city-data.com from local newspapers, TV, and radio stations
3.4% of Killingworth, CT residents are foreign-born (1.4% born in Europe, 1.0% born in North America, 0.7% born in Latin America), which is 342.5% less than the foreign-born rate of 15.0% across the entire state of Connecticut.
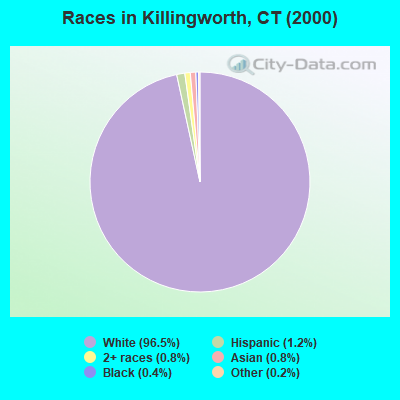
Race distribution in Killingworth

- 5,80896.5%White alone
- 711.2%Hispanic
- 500.8%Asian alone
- 510.8%Two or more races
- 250.4%Black alone
- 100.2%Other race alone
- 30.05%American Indian alone
2000
2022
-
- 2,638,84577.5%White alone
- 320,3239.4%Hispanic
- 295,5718.7%Black alone
- 81,5642.4%Asian alone
- 52,8961.6%Two or more races
- 8,1410.2%Other race alone
- 7,2670.2%American Indian alone
- 9580.03%Native Hawaiian and Other
Pacific Islander alone

-
- 2,246,91362.0%White alone
- 658,97818.2%Hispanic
- 353,9739.8%Black alone
- 172,9294.8%Asian alone
- 159,6314.4%Two or more races
- 29,7610.8%Other race alone
- 3,4280.09%American Indian alone
- 5920.02%Native Hawaiian and Other
Pacific Islander alone

Income and house value in Killingworth
- Median household income in 2022
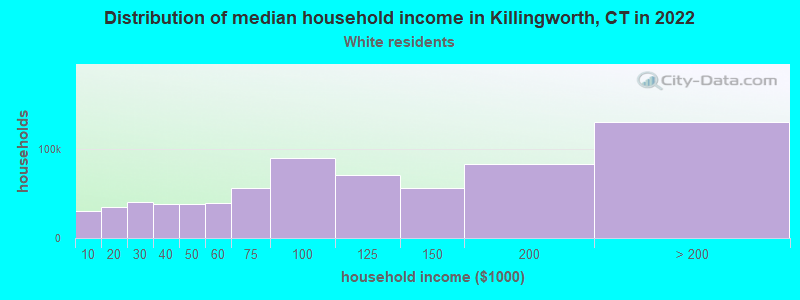
- $139,518White non-Hispanic householders
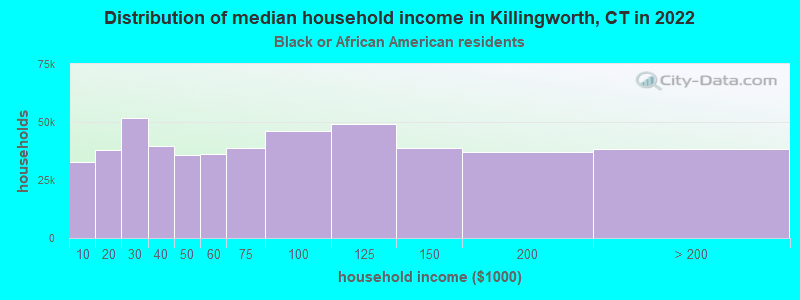
- $176,412Black householders
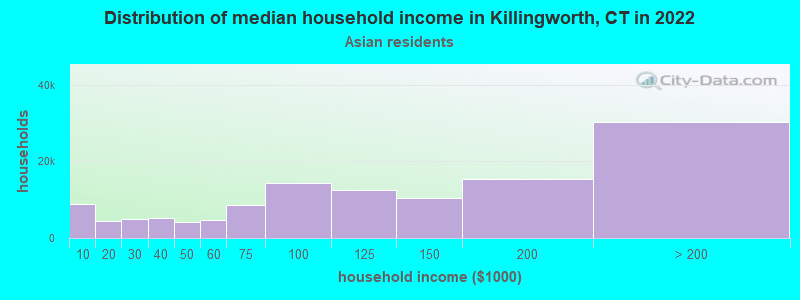
- over $200,000Asian householders
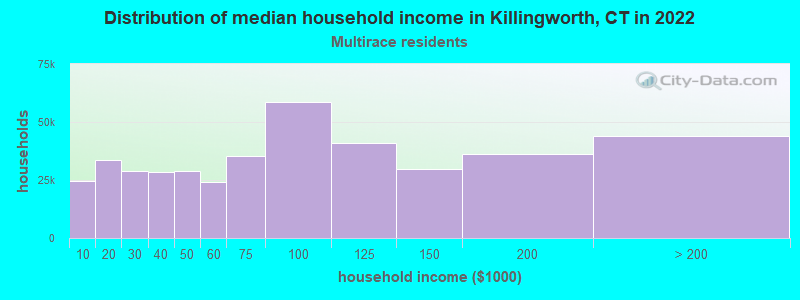
- over $200,000Two or more races householders
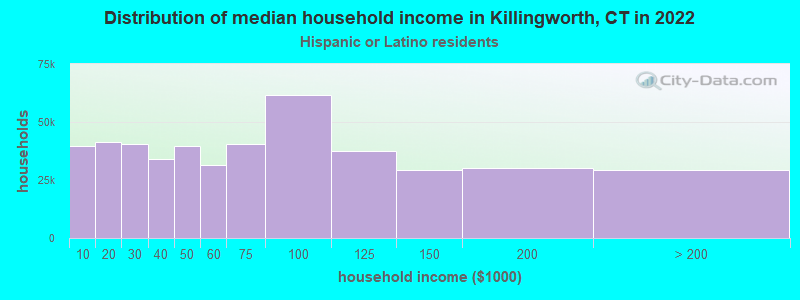
- $105,122Hispanic or Latino race householders
- Median 2022 house value
- $515,611White Non-Hispanic householders
- $266,777Black or African American householders
- $756,662Asian householders
- $783,686Two or more races householders
- $486,425Hispanic or Latino householders
Household income for White non-Hispanic householders
Household income for Black householders
Household income for Asian householders
Household income for Two or more races householders
Household income for Hispanic or Latino race householders
Foreign-born residents in Killingworth
204 residents are foreign born (1.4% Europe, 1.0% North America, 0.7% Latin America).
| This city: | 3.4% |
| Connecticut: | 10.9% |
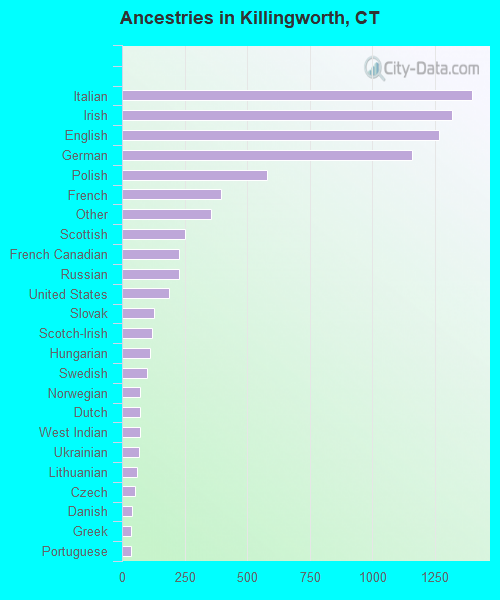
Ancestries in Killingworth

- 1,39816.8%Italian
- 1,31915.8%Irish
- 1,26815.2%English
- 1,15813.9%German
- 5817.0%Polish
- 3954.7%French
- 3544.2%Other
- 2533.0%Scottish
- 2282.7%French Canadian
- 2272.7%Russian
- 1872.2%United States
- 1291.5%Slovak
- 1211.5%Scotch-Irish
- 1101.3%Hungarian
- 991.2%Swedish
- 730.9%Norwegian
- 710.9%Dutch
- 700.8%West Indian
- 660.8%Ukrainian
- 580.7%Lithuanian
- 520.6%Czech
- 380.5%Danish
- 340.4%Greek
- 340.4%Portuguese
- 120.1%Swiss
- 80.10%Welsh
Zip codes: 06419.