Races in Lacy-Lakeview, Texas (TX) Detailed Stats
Data:
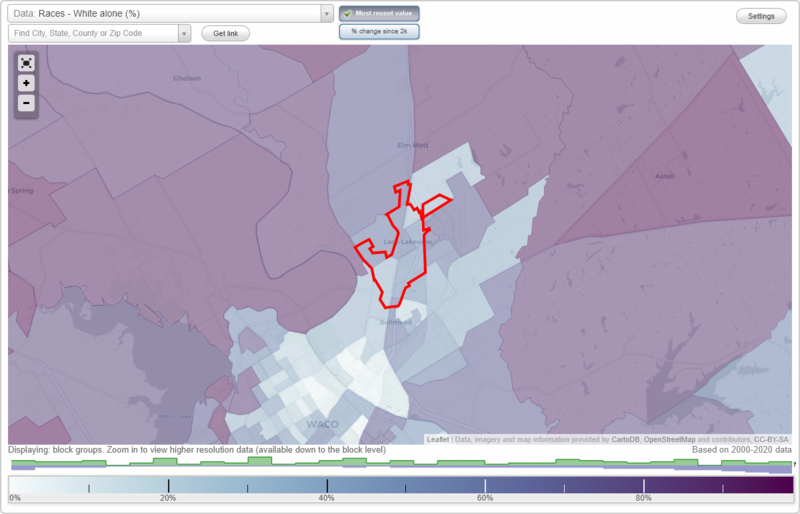
Races - White alone (%)
Races - White alone (% change since 2000)
Races - Black alone (%)
Races - Black alone (% change since 2000)
Races - American Indian alone (%)
Races - American Indian alone (% change since 2000)
Races - Asian alone (%)
Races - Asian alone (% change since 2000)
Races - Hispanic (%)
Races - Hispanic (% change since 2000)
Races - Native Hawaiian and Other Pacific Islander alone (%)
Races - Native Hawaiian and Other Pacific Islander alone (% change since 2000)
Races - Two or more races(%)
Races - Two or more races(% change since 2000)
Races - Other race alone (%)
Races - Other race alone (% change since 2000)
Racial diversity
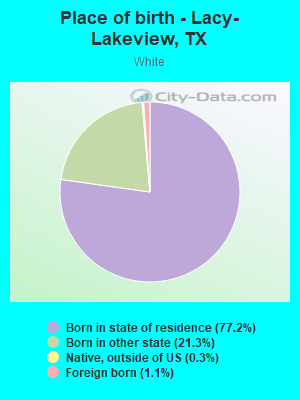
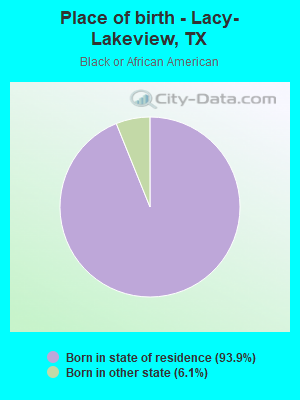
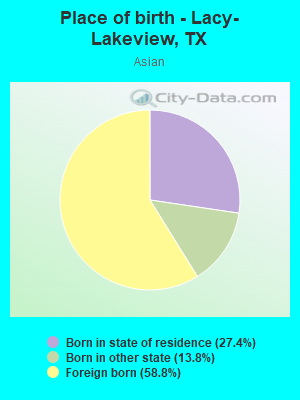
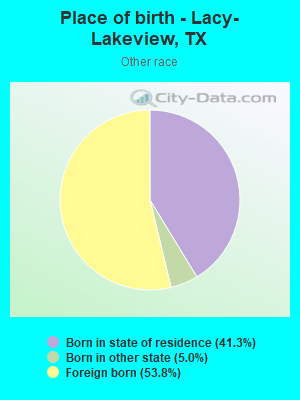
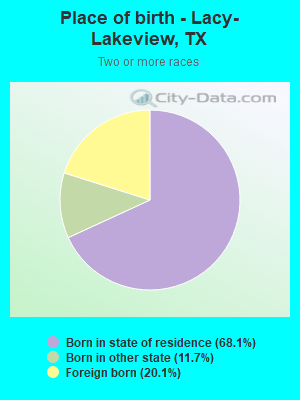
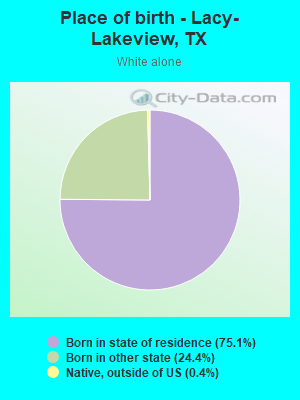
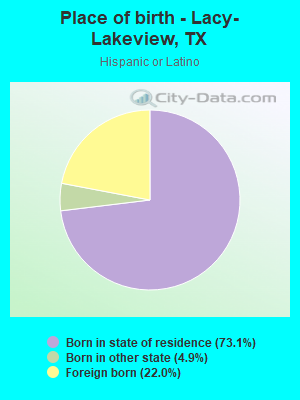
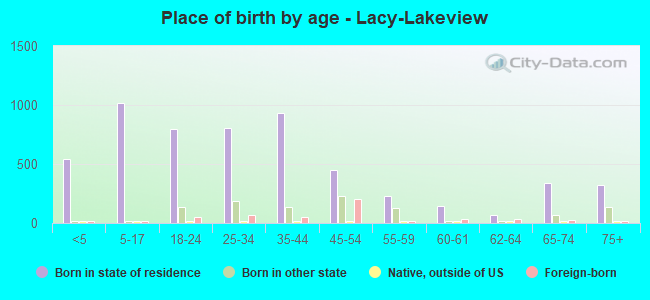
Place of birth - Born in state of residence (%)
Place of birth - Born in state of residence (%) - White
Place of birth - Born in state of residence (%) - Black or African American
Place of birth - Born in state of residence (%) - Asian
Place of birth - Born in state of residence (%) - Hispanic or Latino
Place of birth - Born in state of residence (%) - American Indian and Alaska Native
Place of birth - Born in state of residence (%) - Multirace
Place of birth - Born in state of residence (%) - Other Race
Place of birth - Born in other state (%)
Place of birth - Born in other state (%) - White
Place of birth - Born in other state (%) - Black or African American
Place of birth - Born in other state (%) - Asian
Place of birth - Born in other state (%) - Hispanic or Latino
Place of birth - Born in other state (%) - American Indian and Alaska Native
Place of birth - Born in other state (%) - Multirace
Place of birth - Born in other state (%) - Other Race
Place of birth - Native, outside of US (%)
Place of birth - Native, outside of US (%) - White
Place of birth - Native, outside of US (%) - Black or African American
Place of birth - Native, outside of US (%) - Asian
Place of birth - Native, outside of US (%) - Hispanic or Latino
Place of birth - Native, outside of US (%) - American Indian and Alaska Native
Place of birth - Native, outside of US (%) - Multirace
Place of birth - Native, outside of US (%) - Other Race
Place of birth - Foreign born (%)
Place of birth - Foreign born (%) - White
Place of birth - Foreign born (%) - Black or African American
Place of birth - Foreign born (%) - Asian
Place of birth - Foreign born (%) - Hispanic or Latino
Place of birth - Foreign born (%) - American Indian and Alaska Native
Place of birth - Foreign born (%) - Multirace
Place of birth - Foreign born (%) - Other Race
Residents speaking English at home (%)
Residents speaking English at home - Born in the United States (%)
Residents speaking English at home - Native, born elsewhere (%)
Residents speaking English at home - Foreign born (%)
Residents speaking Spanish at home (%)
Residents speaking Spanish at home - Born in the United States (%)
Residents speaking Spanish at home - Native, born elsewhere (%)
Residents speaking Spanish at home - Foreign born (%)
Residents speaking other language at home (%)
Residents speaking other language at home - Born in the United States (%)
Residents speaking other language at home - Native, born elsewhere (%)
Residents speaking other language at home - Foreign born (%)
Marital status - Never married (%)
Marital status - Now married (%)
Marital status - Separated (%)
Marital status - Widowed (%)
Marital status - Divorced (%)
Ancestries Reported - Arab (%)
Ancestries Reported - Czech (%)
Ancestries Reported - Danish (%)
Ancestries Reported - Dutch (%)
Ancestries Reported - English (%)
Ancestries Reported - French (%)
Ancestries Reported - French Canadian (%)
Ancestries Reported - German (%)
Ancestries Reported - Greek (%)
Ancestries Reported - Hungarian (%)
Ancestries Reported - Irish (%)
Ancestries Reported - Italian (%)
Ancestries Reported - Lithuanian (%)
Ancestries Reported - Norwegian (%)
Ancestries Reported - Polish (%)
Ancestries Reported - Portuguese (%)
Ancestries Reported - Russian (%)
Ancestries Reported - Scotch-Irish (%)
Ancestries Reported - Scottish (%)
Ancestries Reported - Slovak (%)
Ancestries Reported - Subsaharan African (%)
Ancestries Reported - Swedish (%)
Ancestries Reported - Swiss (%)
Ancestries Reported - Ukrainian (%)
Ancestries Reported - United States (%)
Ancestries Reported - Welsh (%)
Ancestries Reported - West Indian (%)
Ancestries Reported - Other (%)
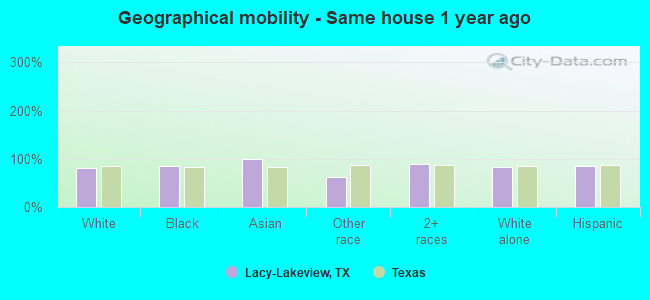
Geographical mobility - Same house 1 year ago (%)
Geographical mobility - Same house 1 year ago (%) - White
Geographical mobility - Same house 1 year ago (%) - Black or African American
Geographical mobility - Same house 1 year ago (%) - Asian
Geographical mobility - Same house 1 year ago (%) - Hispanic or Latino
Geographical mobility - Same house 1 year ago (%) - American Indian and Alaska Native
Geographical mobility - Same house 1 year ago (%) - Multirace
Geographical mobility - Same house 1 year ago (%) - Other Race
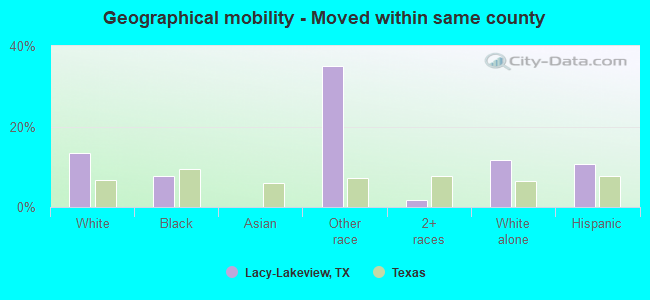
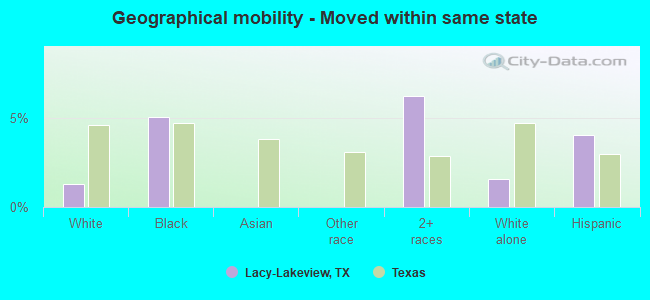
Geographical mobility - Moved within same county (%)
Geographical mobility - Moved within same county (%) - White
Geographical mobility - Moved within same county (%) - Black or African American
Geographical mobility - Moved within same county (%) - Asian
Geographical mobility - Moved within same county (%) - Hispanic or Latino
Geographical mobility - Moved within same county (%) - American Indian and Alaska Native
Geographical mobility - Moved within same county (%) - Multirace
Geographical mobility - Moved within same county (%) - Other Race
Geographical mobility - Moved from different county within same state (%)
Geographical mobility - Moved from different county within same state (%) - White
Geographical mobility - Moved from different county within same state (%) - Black or African American
Geographical mobility - Moved from different county within same state (%) - Asian
Geographical mobility - Moved from different county within same state (%) - Hispanic or Latino
Geographical mobility - Moved from different county within same state (%) - American Indian and Alaska Native
Geographical mobility - Moved from different county within same state (%) - Multirace
Geographical mobility - Moved from different county within same state (%) - Other Race
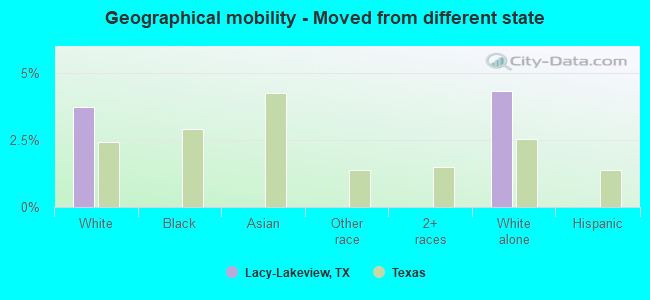
Geographical mobility - Moved from different state (%)
Geographical mobility - Moved from different state (%) - White
Geographical mobility - Moved from different state (%) - Black or African American
Geographical mobility - Moved from different state (%) - Asian
Geographical mobility - Moved from different state (%) - Hispanic or Latino
Geographical mobility - Moved from different state (%) - American Indian and Alaska Native
Geographical mobility - Moved from different state (%) - Multirace
Geographical mobility - Moved from different state (%) - Other Race
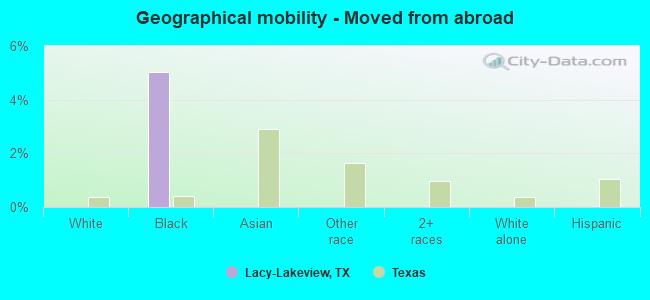
Geographical mobility - Moved from abroad (%)
Geographical mobility - Moved from abroad (%) - White
Geographical mobility - Moved from abroad (%) - Black or African American
Geographical mobility - Moved from abroad (%) - Asian
Geographical mobility - Moved from abroad (%) - Hispanic or Latino
Geographical mobility - Moved from abroad (%) - American Indian and Alaska Native
Geographical mobility - Moved from abroad (%) - Multirace
Geographical mobility - Moved from abroad (%) - Other Race
Place of birth for the foreign-born population - Ireland (%)
Place of birth for the foreign-born population - Denmark (%)
Place of birth for the foreign-born population - Norway (%)
Place of birth for the foreign-born population - Sweden (%)
Place of birth for the foreign-born population - United Kingdom (%)
Place of birth for the foreign-born population - England (%)
Place of birth for the foreign-born population - Scotland (%)
Place of birth for the foreign-born population - Other Northern Europe (%)
Place of birth for the foreign-born population - Austria (%)
Place of birth for the foreign-born population - Belgium (%)
Place of birth for the foreign-born population - France (%)
Place of birth for the foreign-born population - Germany (%)
Place of birth for the foreign-born population - Netherlands (%)
Place of birth for the foreign-born population - Switzerland (%)
Place of birth for the foreign-born population - Other Western Europe (%)
Place of birth for the foreign-born population - Greece (%)
Place of birth for the foreign-born population - Italy (%)
Place of birth for the foreign-born population - Portugal (%)
Place of birth for the foreign-born population - Spain (%)
Place of birth for the foreign-born population - Other Southern Europe (%)
Place of birth for the foreign-born population - Albania (%)
Place of birth for the foreign-born population - Belarus (%)
Place of birth for the foreign-born population - Bosnia and Herzegovina (%)
Place of birth for the foreign-born population - Bulgaria (%)
Place of birth for the foreign-born population - Croatia (%)
Place of birth for the foreign-born population - Czechoslovakia (%)
Place of birth for the foreign-born population - Hungary (%)
Place of birth for the foreign-born population - Latvia (%)
Place of birth for the foreign-born population - Lithuania (%)
Place of birth for the foreign-born population - North Macedonia (Macedonia) (%)
Place of birth for the foreign-born population - Moldova (%)
Place of birth for the foreign-born population - Poland (%)
Place of birth for the foreign-born population - Romania (%)
Place of birth for the foreign-born population - Russia (%)
Place of birth for the foreign-born population - Serbia (%)
Place of birth for the foreign-born population - Ukraine (%)
Place of birth for the foreign-born population - Other Eastern Europe (%)
Place of birth for the foreign-born population - China (%)
Place of birth for the foreign-born population - Hong Kong (%)
Place of birth for the foreign-born population - Taiwan (%)
Place of birth for the foreign-born population - Japan (%)
Place of birth for the foreign-born population - Korea (%)
Place of birth for the foreign-born population - Other Eastern Asia (%)
Place of birth for the foreign-born population - Afghanistan (%)
Place of birth for the foreign-born population - Bangladesh (%)
Place of birth for the foreign-born population - India (%)
Place of birth for the foreign-born population - Iran (%)
Place of birth for the foreign-born population - Kazakhstan (%)
Place of birth for the foreign-born population - Nepal (%)
Place of birth for the foreign-born population - Pakistan (%)
Place of birth for the foreign-born population - Sri Lanka (%)
Place of birth for the foreign-born population - Uzbekistan (%)
Place of birth for the foreign-born population - Other South Central Asia (%)
Place of birth for the foreign-born population - Burma (%)
Place of birth for the foreign-born population - Cambodia (%)
Place of birth for the foreign-born population - Indonesia (%)
Place of birth for the foreign-born population - Laos (%)
Place of birth for the foreign-born population - Malaysia (%)
Place of birth for the foreign-born population - Philippines (%)
Place of birth for the foreign-born population - Singapore (%)
Place of birth for the foreign-born population - Thailand (%)
Place of birth for the foreign-born population - Vietnam (%)
Place of birth for the foreign-born population - Other South Eastern Asia (%)
Place of birth for the foreign-born population - Armenia (%)
Place of birth for the foreign-born population - Iraq (%)
Place of birth for the foreign-born population - Israel (%)
Place of birth for the foreign-born population - Jordan (%)
Place of birth for the foreign-born population - Kuwait (%)
Place of birth for the foreign-born population - Lebanon (%)
Place of birth for the foreign-born population - Saudi Arabia (%)
Place of birth for the foreign-born population - Syria (%)
Place of birth for the foreign-born population - Turkey (%)
Place of birth for the foreign-born population - Yemen (%)
Place of birth for the foreign-born population - Other Western Asia (%)
Place of birth for the foreign-born population - Eritrea (%)
Place of birth for the foreign-born population - Ethiopia (%)
Place of birth for the foreign-born population - Kenya (%)
Place of birth for the foreign-born population - Somalia (%)
Place of birth for the foreign-born population - Uganda (%)
Place of birth for the foreign-born population - Zimbabwe (%)
Place of birth for the foreign-born population - Other Eastern Africa (%)
Place of birth for the foreign-born population - Cameroon (%)
Place of birth for the foreign-born population - Congo (%)
Place of birth for the foreign-born population - Democratic Republic of Congo (Zaire) (%)
Place of birth for the foreign-born population - Other Middle Africa (%)
Place of birth for the foreign-born population - Egypt (%)
Place of birth for the foreign-born population - Morocco (%)
Place of birth for the foreign-born population - Sudan (%)
Place of birth for the foreign-born population - Other Northern Africa (%)
Place of birth for the foreign-born population - South Africa (%)
Place of birth for the foreign-born population - Other Southern Africa (%)
Place of birth for the foreign-born population - Cabo Verde (%)
Place of birth for the foreign-born population - Ghana (%)
Place of birth for the foreign-born population - Liberia (%)
Place of birth for the foreign-born population - Nigeria (%)
Place of birth for the foreign-born population - Senegal (%)
Place of birth for the foreign-born population - Sierra Leone (%)
Place of birth for the foreign-born population - Other Western Africa (%)
Place of birth for the foreign-born population - Australia (%)
Place of birth for the foreign-born population - New Zealand (%)
Place of birth for the foreign-born population - Fiji (%)
Place of birth for the foreign-born population - Micronesia (%)
Place of birth for the foreign-born population - Bahamas (%)
Place of birth for the foreign-born population - Barbados (%)
Place of birth for the foreign-born population - Cuba (%)
Place of birth for the foreign-born population - Dominica (%)
Place of birth for the foreign-born population - Dominican Republic (%)
Place of birth for the foreign-born population - Grenada (%)
Place of birth for the foreign-born population - Haiti (%)
Place of birth for the foreign-born population - Jamaica (%)
Place of birth for the foreign-born population - St. Vincent and the Grenadines (%)
Place of birth for the foreign-born population - Trinidad and Tobago (%)
Place of birth for the foreign-born population - West Indies (%)
Place of birth for the foreign-born population - Other Caribbean (%)
Place of birth for the foreign-born population - Belize (%)
Place of birth for the foreign-born population - Costa Rica (%)
Place of birth for the foreign-born population - El Salvador (%)
Place of birth for the foreign-born population - Guatemala (%)
Place of birth for the foreign-born population - Honduras (%)
Place of birth for the foreign-born population - Mexico (%)
Place of birth for the foreign-born population - Nicaragua (%)
Place of birth for the foreign-born population - Panama (%)
Place of birth for the foreign-born population - Other Central America (%)
Place of birth for the foreign-born population - Argentina (%)
Place of birth for the foreign-born population - Bolivia (%)
Place of birth for the foreign-born population - Brazil (%)
Place of birth for the foreign-born population - Chile (%)
Place of birth for the foreign-born population - Colombia (%)
Place of birth for the foreign-born population - Ecuador (%)
Place of birth for the foreign-born population - Guyana (%)
Place of birth for the foreign-born population - Peru (%)
Place of birth for the foreign-born population - Uruguay (%)
Place of birth for the foreign-born population - Venezuela (%)
Place of birth for the foreign-born population - Other South America (%)
Place of birth for the foreign-born population - Canada (%)
Place of birth for the foreign-born population - Other Northern America (%)
Place of birth for the foreign-born population - Other (%)
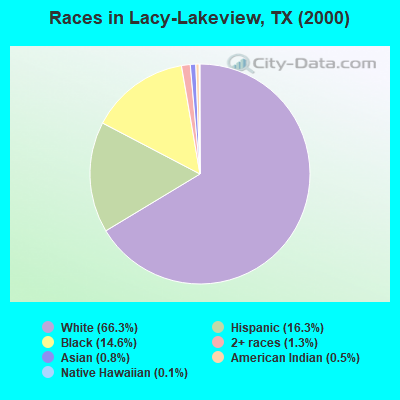
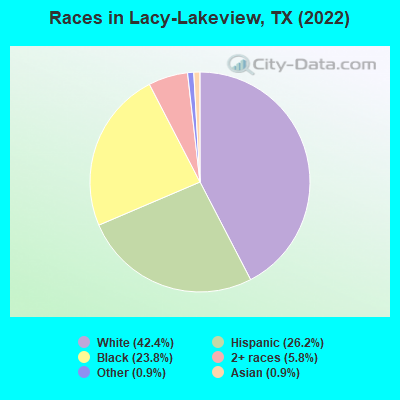
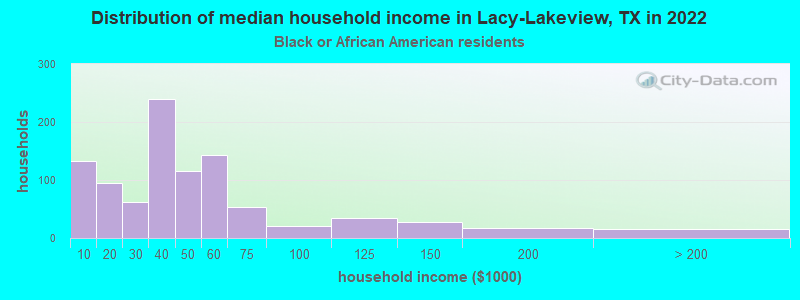
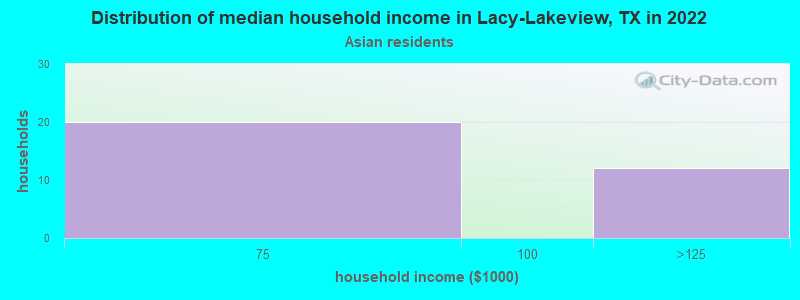
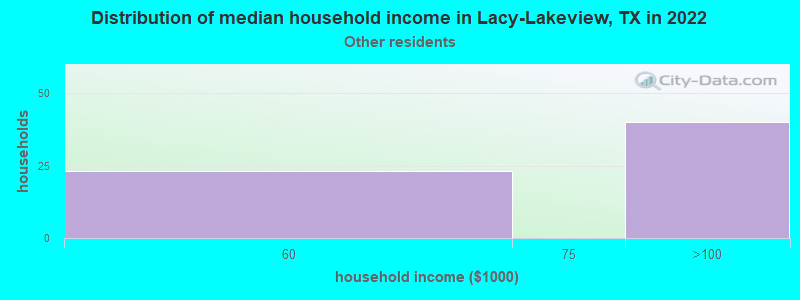
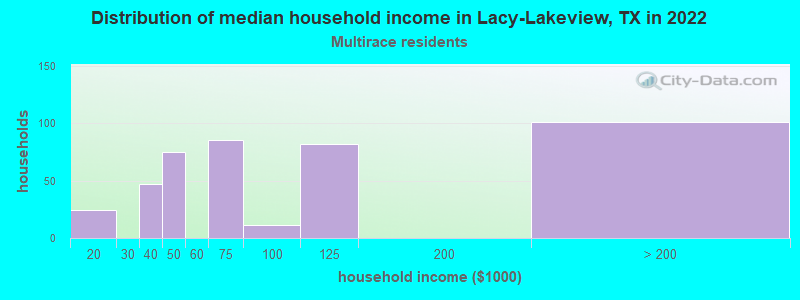
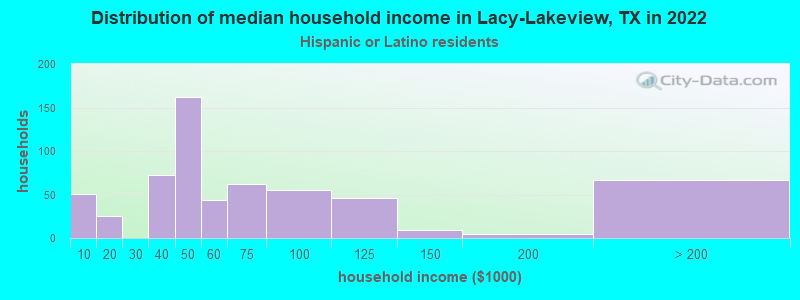
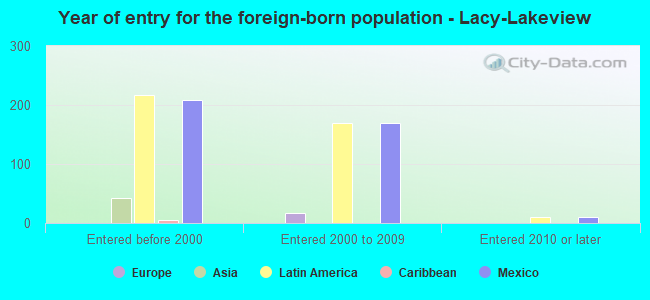
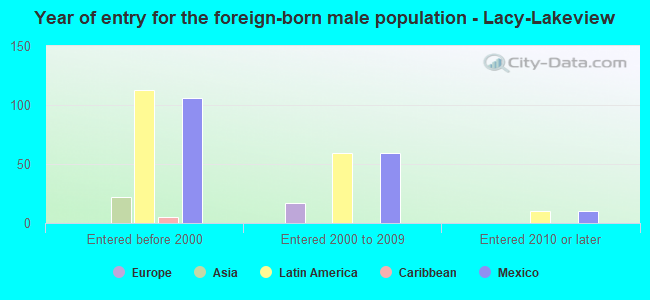
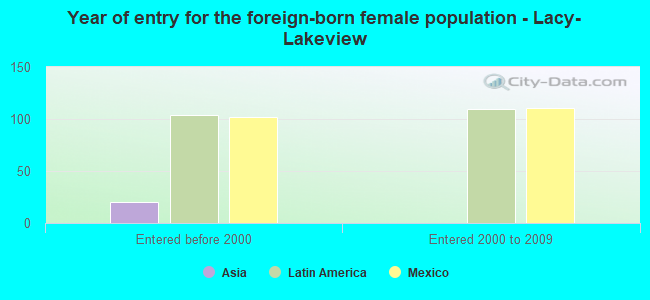
According to 2022 data, the most numerous races in Lacy-Lakeview, TX are Hispanic (1,928 residents), White alone (3,117 residents), and Black alone (1,752 residents). 84.5% of Lacy-Lakeview residents speak English at home. 6.7% of Lacy-Lakeview, TX residents are foreign-born (5.8% born in Latin America), which is 154.9% less than the foreign-born rate of 17.0% across the entire state of Texas.
Race distribution in Lacy-Lakeview
2000 2022
10,933,313 52.4% White alone 6,669,666 32.0% Hispanic 2,364,255 11.3% Black alone 554,445 2.7% Asian alone 230,567 1.1% Two or more races 68,859 0.3% American Indian alone 19,958 0.10% Other race alone 10,757 0.05% Native Hawaiian and Other
12,070,642 40.2% Hispanic 11,683,430 38.9% White alone 3,508,706 11.7% Black alone 1,608,173 5.4% Asian alone 956,560 3.2% Two or more races 125,763 0.4% Other race alone 47,023 0.2% American Indian alone 29,275 0.10% Native Hawaiian and Other
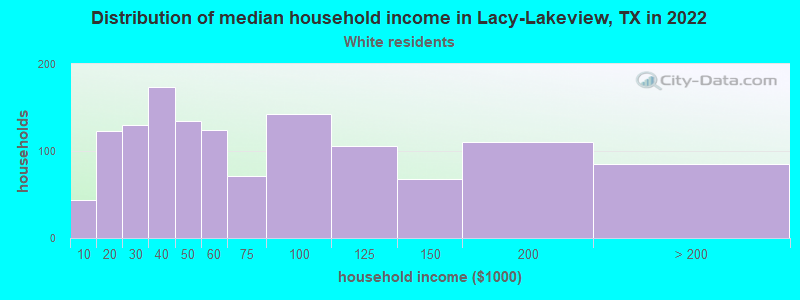
Income and house value in Lacy-Lakeview Median household income in 2022 $53,408 White non-Hispanic householders$49,871 Black householders$87,690 Some other race householders$68,248 Two or more races householders$50,709 Hispanic or Latino race householdersMedian 2022 house value $168,691 White Non-Hispanic householders$172,453 Black or African American householders$165,555 Some other race householders$203,809 Two or more races householders$160,225 Hispanic or Latino householders
Median age by race in Lacy-Lakeview
38.4 Median age for White residents36.9 40.4 39.4 Median age for Black or African American residents32.1 46.0 -678,328,473.6 Median age for American Indian / Alaska Native residents-647,780,924.8 -711,764,705.2 64.7 Median age for Asian residents-674,509,803.2 -846,529,813.4 -581,560,283.1 Median age for Native Hawaiian / Pacific Islander residents-612,729,233.5 -577,777,777.2 29.9 Median age for Other race residents31.6 23.3 21.7 Median age for Two or more races residents25.5 22.9 41.1 Median age for White alone residents40.9 41.4 23.2 Median age for Hispanic or Latino residents26.2 23.1
Owner/renter occupied households by race in Lacy-Lakeview
House owners and renters - White residents 762 54.5% Owner occupied636 45.5% Renter occupiedHouse owners and renters - Black or African American residents 230 26.2% Owner occupied648 73.8% Renter occupiedHouse owners and renters - Asian residents 30 100.0% Owner occupiedHouse owners and renters - Other race residents 53 88.6% Owner occupied7 11.4% Renter occupiedHouse owners and renters - Two or more races residents 260 47.2% Owner occupied290 52.8% Renter occupiedHouse owners and renters - White alone residents 696 54.5% Owner occupied580 45.5% Renter occupiedHouse owners and renters - Hispanic or Latino residents 335 50.8% Owner occupied325 49.2% Renter occupied
Language usage in Lacy-Lakeview
English speakers - Total 84.5% of residents of Lacy-Lakeview speak English at home.
14.4% of residents speak Spanish at home 714 73.2% Speak English very well261 26.8% Speak English less than very well1.6% of residents speak other language at home 46 43.4% Speak English very well60 56.6% Speak English less than very well
English speakers - Born in the United States 92.9% of residents of Lacy-Lakeview speak English at home.
5.5% of residents speak Spanish at home 50 89.3% Speak English very well6 10.7% Speak English less than very well1.0% of residents speak other language at home 10 100.0% Speak English very well
All residents speak only English at home
English speakers - Foreign-born 6.9% of residents of Lacy-Lakeview speak English at home.
79.4% of residents speak Spanish at home 181 48.8% Speak English very well190 51.2% Speak English less than very well13.9% of residents speak other language at home 9 13.8% Speak English very well56 86.2% Speak English less than very well
White (Caucasian) - Speak another language Native:
3.9% (118)Foreign-born:
88.3% (32)
Asian - Speak another language Native:
84.2% (22)Foreign-born:
96.7% (40)
Other race - Speak another language Native:
61.3% (43)Foreign-born:
100.0% (105)
Two or more races - Speak only English Native:
67.7% (1,120)Foreign-born:
6.9% (32)
Two or more races - Speak another language Native:
32.8% (542)Foreign-born:
89.4% (413)
Hispanic or Latino - Speak only English Native:
49.5% (588)Foreign-born:
7.8% (33)
Hispanic or Latino - Speak another language Native:
49.0% (582)Foreign-born:
91.8% (389)
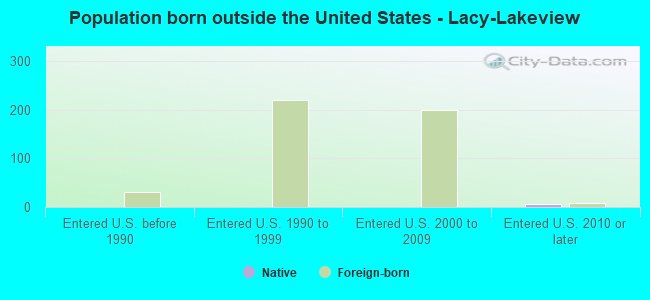
Foreign-born residents in Lacy-Lakeview 490 residents are foreign born (5.8% Latin America ).
This city:
6.7%Texas:
17.1%
Marital status for residents in Lacy-Lakeview Marital status - White (Caucasian) population 15 years and over
Males 42.1% Never married40.2% Now married0.6% Separated0.5% Widowed16.5% DivorcedFemales 24.6% Never married37.3% Now married0.0% Separated12.8% Widowed25.3% DivorcedWomen who gave birth in the past 12 months Now married:
35.0% (31)Unmarried:
65.0% (57)
Women who did not give birth in the past 12 months Now married:
40.1% (284)Unmarried:
59.9% (424)
Marital status - Black or African American population 15 years and over
Males 63.9% Never married21.9% Now married0.0% Separated6.0% Widowed8.2% DivorcedFemales 32.1% Never married17.2% Now married0.9% Separated10.3% Widowed39.6% DivorcedWomen who did not give birth in the past 12 months Now married:
13.0% (67)Unmarried:
87.0% (447)
Marital status - Asian population 15 years and over
Males 0.0% Never married100.0% Now married0.0% Separated0.0% Widowed0.0% DivorcedFemales 45.7% Never married54.3% Now married0.0% Separated0.0% Widowed0.0% DivorcedWomen who did not give birth in the past 12 months Now married:
0.0% (0)Unmarried:
100.0% (17)
Marital status - Other race population 15 years and over
Males 50.6% Never married49.4% Now married0.0% Separated0.0% Widowed0.0% DivorcedFemales 28.8% Never married55.8% Now married15.4% Separated0.0% Widowed0.0% DivorcedWomen who did not give birth in the past 12 months Now married:
68.1% (30)Unmarried:
31.9% (14)
Marital status - Two or more races population 15 years and over
Males 42.8% Never married43.4% Now married0.0% Separated11.1% Widowed2.7% DivorcedFemales 46.2% Never married45.1% Now married0.0% Separated0.0% Widowed8.7% DivorcedWomen who gave birth in the past 12 months Now married:
0.0% (0)Unmarried:
100.0% (109)
Women who did not give birth in the past 12 months Now married:
47.5% (393)Unmarried:
52.5% (434)
Marital status - White alone, not Hispanic / Latino population 15 years and over
Males 43.6% Never married35.1% Now married0.8% Separated0.6% Widowed19.9% DivorcedFemales 25.5% Never married30.9% Now married0.0% Separated14.6% Widowed28.9% DivorcedWomen who gave birth in the past 12 months Now married:
23.5% (20)Unmarried:
76.5% (67)
Women who did not give birth in the past 12 months Now married:
34.2% (239)Unmarried:
65.8% (459)
Marital status - Hispanic or Latino population 15 years and over
Males 47.4% Never married52.6% Now married0.0% Separated0.0% Widowed0.0% DivorcedFemales 42.7% Never married56.2% Now married1.1% Separated0.0% Widowed0.0% DivorcedWomen who gave birth in the past 12 months Now married:
21.1% (16)Unmarried:
78.9% (59)
Women who did not give birth in the past 12 months Now married:
53.6% (305)Unmarried:
46.4% (264)
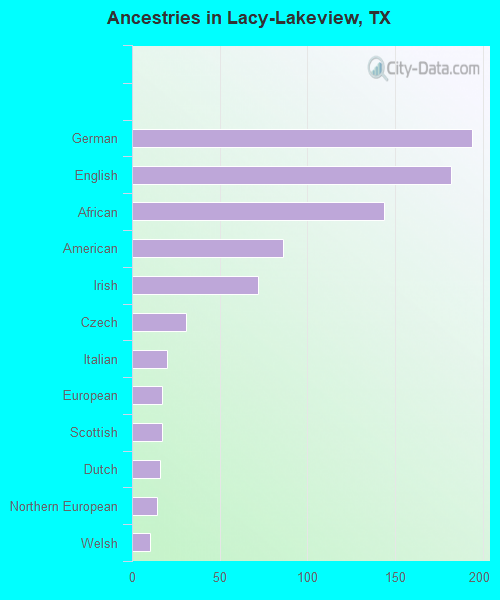
Ancestries in Lacy-Lakeview
194 5.1% German182 4.8% English144 3.8% African86 2.3% American72 1.9% Irish31 0.8% Czech20 0.5% Italian17 0.4% European17 0.4% Scottish16 0.4% Dutch14 0.4% Northern European10 0.3% Welsh1 0.03% British
Children Nativity (place of birth) in Lacy-Lakeview
Children under 6 years - Living with two parents Both parents native 206 100.0% NativeOne native, one foreign-born parent 9 100.0% NativeChildren under 6 years - Living with one parent Native parent 317 100.0% NativeForeign-born parent 14 100.0% Native
Children 6 to 17 years - Living with two parents Both parents native 313 100.0% NativeBoth parents foreign-born 67 100.0% NativeOne native, one foreign-born parent 33 100.0% NativeChildren 6 to 17 years - Living with one parent Native parent 487 100.0% Native
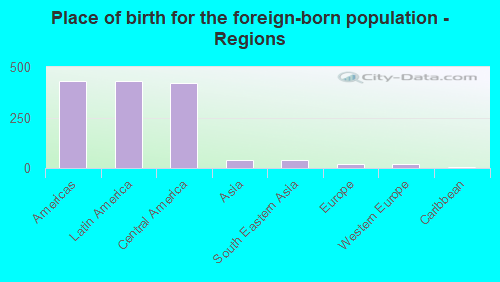
Place of birth for residents in Lacy-Lakeview 430 Americas430 Latin America423 Central America41 Asia41 South Eastern Asia18 Europe18 Western Europe6 Caribbean
Grandparents responsible for own grandchildren in Lacy-Lakeview
Grandparents (30 to 59 years) White / Caucasian 55 58.8% Responsible for grandchildren39 41.2% Not responsible for grandchildrenTwo or more races 96 100.0% Responsible for grandchildrenWhite alone, not Hispanic / Latino 64 54.2% Responsible for grandchildren54 45.8% Not responsible for grandchildrenHispanic or Latino 56 100.0% Responsible for grandchildren
Grandparents (60 years and over) White / Caucasian 10 100.0% Not responsible for grandchildrenWhite alone, not Hispanic / Latino 13 100.0% Not responsible for grandchildren