Races in Lakeland Highlands, Florida (FL) Detailed Stats
Data:
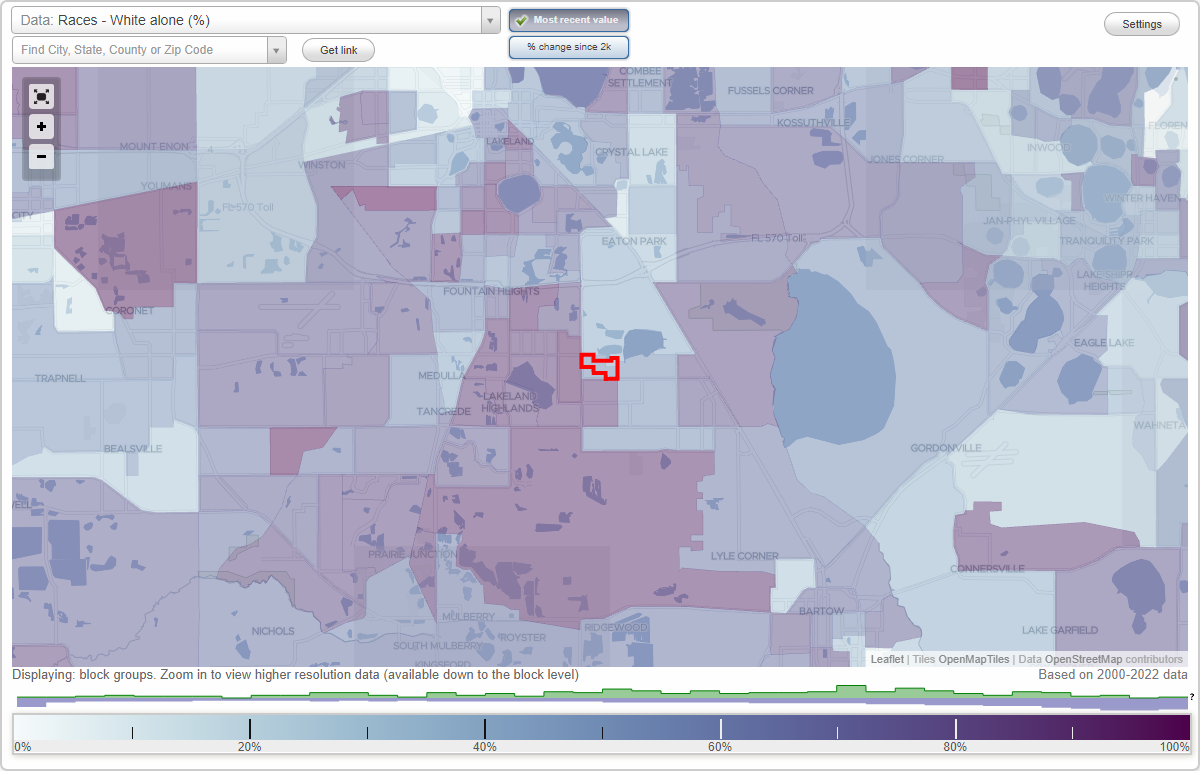
Races - White alone (%)
Races - White alone (% change since 2000)
Races - Black alone (%)
Races - Black alone (% change since 2000)
Races - American Indian alone (%)
Races - American Indian alone (% change since 2000)
Races - Asian alone (%)
Races - Asian alone (% change since 2000)
Races - Hispanic (%)
Races - Hispanic (% change since 2000)
Races - Native Hawaiian and Other Pacific Islander alone (%)
Races - Native Hawaiian and Other Pacific Islander alone (% change since 2000)
Races - Two or more races(%)
Races - Two or more races(% change since 2000)
Races - Other race alone (%)
Races - Other race alone (% change since 2000)
Racial diversity
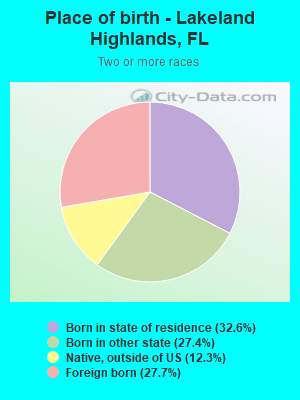
Place of birth - Born in state of residence (%)
Place of birth - Born in state of residence (%) - White
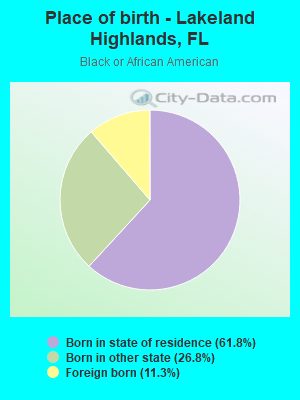
Place of birth - Born in state of residence (%) - Black or African American
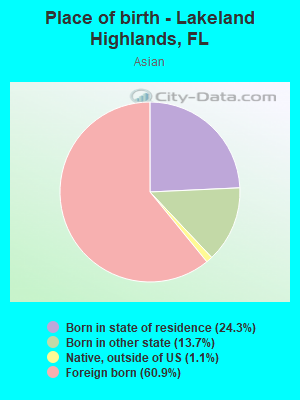
Place of birth - Born in state of residence (%) - Asian
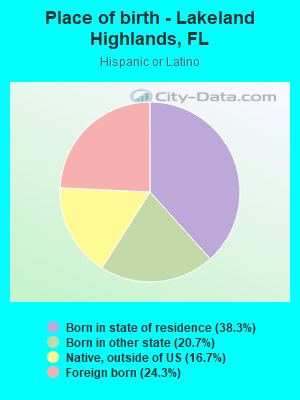
Place of birth - Born in state of residence (%) - Hispanic or Latino
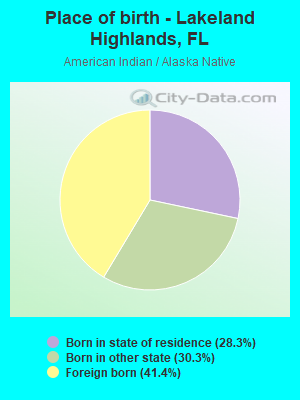
Place of birth - Born in state of residence (%) - American Indian and Alaska Native
Place of birth - Born in state of residence (%) - Multirace
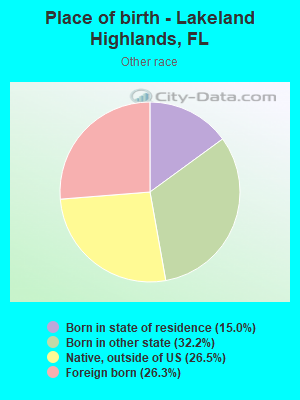
Place of birth - Born in state of residence (%) - Other Race
Place of birth - Born in other state (%)
Place of birth - Born in other state (%) - White
Place of birth - Born in other state (%) - Black or African American
Place of birth - Born in other state (%) - Asian
Place of birth - Born in other state (%) - Hispanic or Latino
Place of birth - Born in other state (%) - American Indian and Alaska Native
Place of birth - Born in other state (%) - Multirace
Place of birth - Born in other state (%) - Other Race
Place of birth - Native, outside of US (%)
Place of birth - Native, outside of US (%) - White
Place of birth - Native, outside of US (%) - Black or African American
Place of birth - Native, outside of US (%) - Asian
Place of birth - Native, outside of US (%) - Hispanic or Latino
Place of birth - Native, outside of US (%) - American Indian and Alaska Native
Place of birth - Native, outside of US (%) - Multirace
Place of birth - Native, outside of US (%) - Other Race
Place of birth - Foreign born (%)
Place of birth - Foreign born (%) - White
Place of birth - Foreign born (%) - Black or African American
Place of birth - Foreign born (%) - Asian
Place of birth - Foreign born (%) - Hispanic or Latino
Place of birth - Foreign born (%) - American Indian and Alaska Native
Place of birth - Foreign born (%) - Multirace
Place of birth - Foreign born (%) - Other Race
Residents speaking English at home (%)
Residents speaking English at home - Born in the United States (%)
Residents speaking English at home - Native, born elsewhere (%)
Residents speaking English at home - Foreign born (%)
Residents speaking Spanish at home (%)
Residents speaking Spanish at home - Born in the United States (%)
Residents speaking Spanish at home - Native, born elsewhere (%)
Residents speaking Spanish at home - Foreign born (%)
Residents speaking other language at home (%)
Residents speaking other language at home - Born in the United States (%)
Residents speaking other language at home - Native, born elsewhere (%)
Residents speaking other language at home - Foreign born (%)
Marital status - Never married (%)
Marital status - Now married (%)
Marital status - Separated (%)
Marital status - Widowed (%)
Marital status - Divorced (%)
Ancestries Reported - Arab (%)
Ancestries Reported - Czech (%)
Ancestries Reported - Danish (%)
Ancestries Reported - Dutch (%)
Ancestries Reported - English (%)
Ancestries Reported - French (%)
Ancestries Reported - French Canadian (%)
Ancestries Reported - German (%)
Ancestries Reported - Greek (%)
Ancestries Reported - Hungarian (%)
Ancestries Reported - Irish (%)
Ancestries Reported - Italian (%)
Ancestries Reported - Lithuanian (%)
Ancestries Reported - Norwegian (%)
Ancestries Reported - Polish (%)
Ancestries Reported - Portuguese (%)
Ancestries Reported - Russian (%)
Ancestries Reported - Scotch-Irish (%)
Ancestries Reported - Scottish (%)
Ancestries Reported - Slovak (%)
Ancestries Reported - Subsaharan African (%)
Ancestries Reported - Swedish (%)
Ancestries Reported - Swiss (%)
Ancestries Reported - Ukrainian (%)
Ancestries Reported - United States (%)
Ancestries Reported - Welsh (%)
Ancestries Reported - West Indian (%)
Ancestries Reported - Other (%)
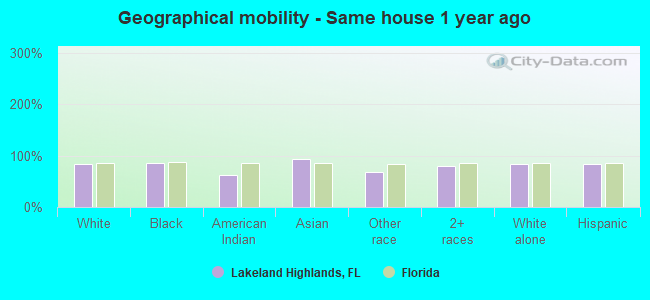
Geographical mobility - Same house 1 year ago (%)
Geographical mobility - Same house 1 year ago (%) - White
Geographical mobility - Same house 1 year ago (%) - Black or African American
Geographical mobility - Same house 1 year ago (%) - Asian
Geographical mobility - Same house 1 year ago (%) - Hispanic or Latino
Geographical mobility - Same house 1 year ago (%) - American Indian and Alaska Native
Geographical mobility - Same house 1 year ago (%) - Multirace
Geographical mobility - Same house 1 year ago (%) - Other Race
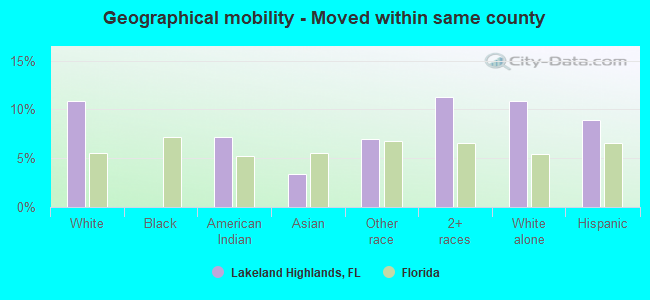
Geographical mobility - Moved within same county (%)
Geographical mobility - Moved within same county (%) - White
Geographical mobility - Moved within same county (%) - Black or African American
Geographical mobility - Moved within same county (%) - Asian
Geographical mobility - Moved within same county (%) - Hispanic or Latino
Geographical mobility - Moved within same county (%) - American Indian and Alaska Native
Geographical mobility - Moved within same county (%) - Multirace
Geographical mobility - Moved within same county (%) - Other Race
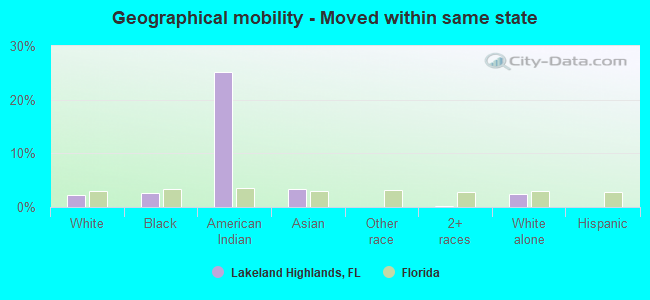
Geographical mobility - Moved from different county within same state (%)
Geographical mobility - Moved from different county within same state (%) - White
Geographical mobility - Moved from different county within same state (%) - Black or African American
Geographical mobility - Moved from different county within same state (%) - Asian
Geographical mobility - Moved from different county within same state (%) - Hispanic or Latino
Geographical mobility - Moved from different county within same state (%) - American Indian and Alaska Native
Geographical mobility - Moved from different county within same state (%) - Multirace
Geographical mobility - Moved from different county within same state (%) - Other Race
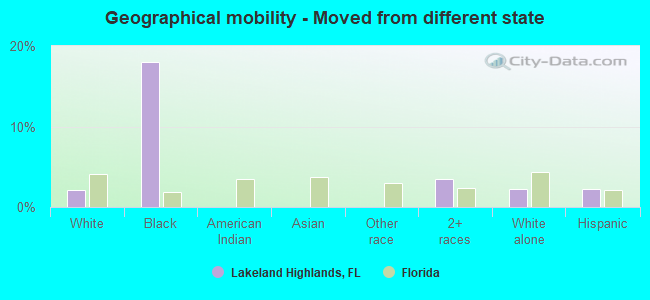
Geographical mobility - Moved from different state (%)
Geographical mobility - Moved from different state (%) - White
Geographical mobility - Moved from different state (%) - Black or African American
Geographical mobility - Moved from different state (%) - Asian
Geographical mobility - Moved from different state (%) - Hispanic or Latino
Geographical mobility - Moved from different state (%) - American Indian and Alaska Native
Geographical mobility - Moved from different state (%) - Multirace
Geographical mobility - Moved from different state (%) - Other Race
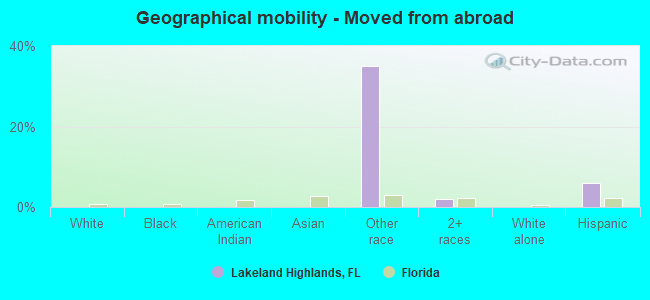
Geographical mobility - Moved from abroad (%)
Geographical mobility - Moved from abroad (%) - White
Geographical mobility - Moved from abroad (%) - Black or African American
Geographical mobility - Moved from abroad (%) - Asian
Geographical mobility - Moved from abroad (%) - Hispanic or Latino
Geographical mobility - Moved from abroad (%) - American Indian and Alaska Native
Geographical mobility - Moved from abroad (%) - Multirace
Geographical mobility - Moved from abroad (%) - Other Race
Place of birth for the foreign-born population - Ireland (%)
Place of birth for the foreign-born population - Denmark (%)
Place of birth for the foreign-born population - Norway (%)
Place of birth for the foreign-born population - Sweden (%)
Place of birth for the foreign-born population - United Kingdom (%)
Place of birth for the foreign-born population - England (%)
Place of birth for the foreign-born population - Scotland (%)
Place of birth for the foreign-born population - Other Northern Europe (%)
Place of birth for the foreign-born population - Austria (%)
Place of birth for the foreign-born population - Belgium (%)
Place of birth for the foreign-born population - France (%)
Place of birth for the foreign-born population - Germany (%)
Place of birth for the foreign-born population - Netherlands (%)
Place of birth for the foreign-born population - Switzerland (%)
Place of birth for the foreign-born population - Other Western Europe (%)
Place of birth for the foreign-born population - Greece (%)
Place of birth for the foreign-born population - Italy (%)
Place of birth for the foreign-born population - Portugal (%)
Place of birth for the foreign-born population - Spain (%)
Place of birth for the foreign-born population - Other Southern Europe (%)
Place of birth for the foreign-born population - Albania (%)
Place of birth for the foreign-born population - Belarus (%)
Place of birth for the foreign-born population - Bosnia and Herzegovina (%)
Place of birth for the foreign-born population - Bulgaria (%)
Place of birth for the foreign-born population - Croatia (%)
Place of birth for the foreign-born population - Czechoslovakia (%)
Place of birth for the foreign-born population - Hungary (%)
Place of birth for the foreign-born population - Latvia (%)
Place of birth for the foreign-born population - Lithuania (%)
Place of birth for the foreign-born population - North Macedonia (Macedonia) (%)
Place of birth for the foreign-born population - Moldova (%)
Place of birth for the foreign-born population - Poland (%)
Place of birth for the foreign-born population - Romania (%)
Place of birth for the foreign-born population - Russia (%)
Place of birth for the foreign-born population - Serbia (%)
Place of birth for the foreign-born population - Ukraine (%)
Place of birth for the foreign-born population - Other Eastern Europe (%)
Place of birth for the foreign-born population - China (%)
Place of birth for the foreign-born population - Hong Kong (%)
Place of birth for the foreign-born population - Taiwan (%)
Place of birth for the foreign-born population - Japan (%)
Place of birth for the foreign-born population - Korea (%)
Place of birth for the foreign-born population - Other Eastern Asia (%)
Place of birth for the foreign-born population - Afghanistan (%)
Place of birth for the foreign-born population - Bangladesh (%)
Place of birth for the foreign-born population - India (%)
Place of birth for the foreign-born population - Iran (%)
Place of birth for the foreign-born population - Kazakhstan (%)
Place of birth for the foreign-born population - Nepal (%)
Place of birth for the foreign-born population - Pakistan (%)
Place of birth for the foreign-born population - Sri Lanka (%)
Place of birth for the foreign-born population - Uzbekistan (%)
Place of birth for the foreign-born population - Other South Central Asia (%)
Place of birth for the foreign-born population - Burma (%)
Place of birth for the foreign-born population - Cambodia (%)
Place of birth for the foreign-born population - Indonesia (%)
Place of birth for the foreign-born population - Laos (%)
Place of birth for the foreign-born population - Malaysia (%)
Place of birth for the foreign-born population - Philippines (%)
Place of birth for the foreign-born population - Singapore (%)
Place of birth for the foreign-born population - Thailand (%)
Place of birth for the foreign-born population - Vietnam (%)
Place of birth for the foreign-born population - Other South Eastern Asia (%)
Place of birth for the foreign-born population - Armenia (%)
Place of birth for the foreign-born population - Iraq (%)
Place of birth for the foreign-born population - Israel (%)
Place of birth for the foreign-born population - Jordan (%)
Place of birth for the foreign-born population - Kuwait (%)
Place of birth for the foreign-born population - Lebanon (%)
Place of birth for the foreign-born population - Saudi Arabia (%)
Place of birth for the foreign-born population - Syria (%)
Place of birth for the foreign-born population - Turkey (%)
Place of birth for the foreign-born population - Yemen (%)
Place of birth for the foreign-born population - Other Western Asia (%)
Place of birth for the foreign-born population - Eritrea (%)
Place of birth for the foreign-born population - Ethiopia (%)
Place of birth for the foreign-born population - Kenya (%)
Place of birth for the foreign-born population - Somalia (%)
Place of birth for the foreign-born population - Uganda (%)
Place of birth for the foreign-born population - Zimbabwe (%)
Place of birth for the foreign-born population - Other Eastern Africa (%)
Place of birth for the foreign-born population - Cameroon (%)
Place of birth for the foreign-born population - Congo (%)
Place of birth for the foreign-born population - Democratic Republic of Congo (Zaire) (%)
Place of birth for the foreign-born population - Other Middle Africa (%)
Place of birth for the foreign-born population - Egypt (%)
Place of birth for the foreign-born population - Morocco (%)
Place of birth for the foreign-born population - Sudan (%)
Place of birth for the foreign-born population - Other Northern Africa (%)
Place of birth for the foreign-born population - South Africa (%)
Place of birth for the foreign-born population - Other Southern Africa (%)
Place of birth for the foreign-born population - Cabo Verde (%)
Place of birth for the foreign-born population - Ghana (%)
Place of birth for the foreign-born population - Liberia (%)
Place of birth for the foreign-born population - Nigeria (%)
Place of birth for the foreign-born population - Senegal (%)
Place of birth for the foreign-born population - Sierra Leone (%)
Place of birth for the foreign-born population - Other Western Africa (%)
Place of birth for the foreign-born population - Australia (%)
Place of birth for the foreign-born population - New Zealand (%)
Place of birth for the foreign-born population - Fiji (%)
Place of birth for the foreign-born population - Micronesia (%)
Place of birth for the foreign-born population - Bahamas (%)
Place of birth for the foreign-born population - Barbados (%)
Place of birth for the foreign-born population - Cuba (%)
Place of birth for the foreign-born population - Dominica (%)
Place of birth for the foreign-born population - Dominican Republic (%)
Place of birth for the foreign-born population - Grenada (%)
Place of birth for the foreign-born population - Haiti (%)
Place of birth for the foreign-born population - Jamaica (%)
Place of birth for the foreign-born population - St. Vincent and the Grenadines (%)
Place of birth for the foreign-born population - Trinidad and Tobago (%)
Place of birth for the foreign-born population - West Indies (%)
Place of birth for the foreign-born population - Other Caribbean (%)
Place of birth for the foreign-born population - Belize (%)
Place of birth for the foreign-born population - Costa Rica (%)
Place of birth for the foreign-born population - El Salvador (%)
Place of birth for the foreign-born population - Guatemala (%)
Place of birth for the foreign-born population - Honduras (%)
Place of birth for the foreign-born population - Mexico (%)
Place of birth for the foreign-born population - Nicaragua (%)
Place of birth for the foreign-born population - Panama (%)
Place of birth for the foreign-born population - Other Central America (%)
Place of birth for the foreign-born population - Argentina (%)
Place of birth for the foreign-born population - Bolivia (%)
Place of birth for the foreign-born population - Brazil (%)
Place of birth for the foreign-born population - Chile (%)
Place of birth for the foreign-born population - Colombia (%)
Place of birth for the foreign-born population - Ecuador (%)
Place of birth for the foreign-born population - Guyana (%)
Place of birth for the foreign-born population - Peru (%)
Place of birth for the foreign-born population - Uruguay (%)
Place of birth for the foreign-born population - Venezuela (%)
Place of birth for the foreign-born population - Other South America (%)
Place of birth for the foreign-born population - Canada (%)
Place of birth for the foreign-born population - Other Northern America (%)
Place of birth for the foreign-born population - Other (%)
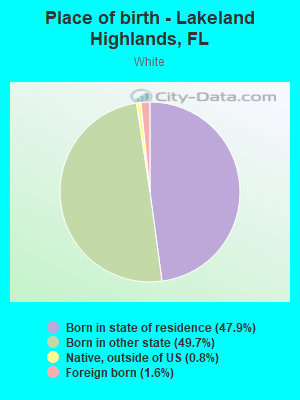
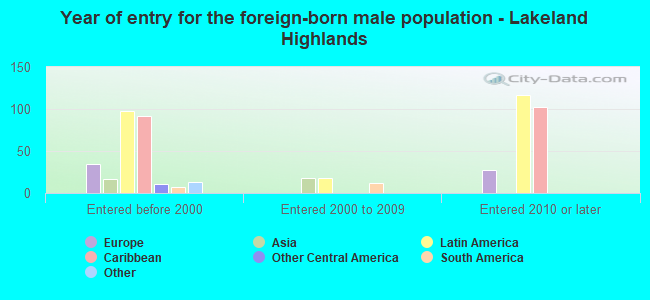
According to 2022 data, the most numerous races in Lakeland Highlands, FL are White alone (9,075 residents), Hispanic (1,696 residents), and Black alone (227 residents). 88.3% of Lakeland Highlands residents speak English at home. 5.5% of Lakeland Highlands, FL residents are foreign-born (3.4% born in Latin America, 0.9% born in Asia, 0.8% born in Europe), which is 279.1% less than the foreign-born rate of 21.0% across the entire state of Florida.
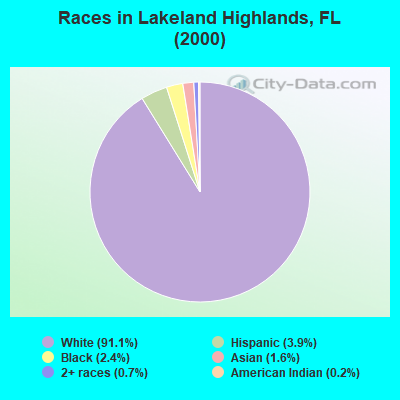
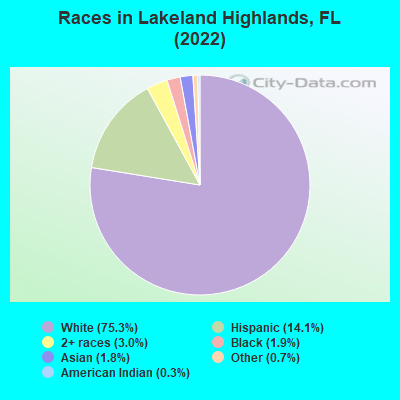
Race distribution in Lakeland Highlands
2000 2022
10,458,509 65.4% White alone 2,682,715 16.8% Hispanic 2,264,268 14.2% Black alone 261,693 1.6% Asian alone 236,954 1.5% Two or more races 42,358 0.3% American Indian alone 28,994 0.2% Other race alone 6,887 0.04% Native Hawaiian and Other
11,309,403 50.8% White alone 6,025,039 27.1% Hispanic 3,241,015 14.6% Black alone 861,630 3.9% Two or more races 623,692 2.8% Asian alone 152,054 0.7% Other race alone 22,504 0.1% American Indian alone 9,486 0.04% Native Hawaiian and Other
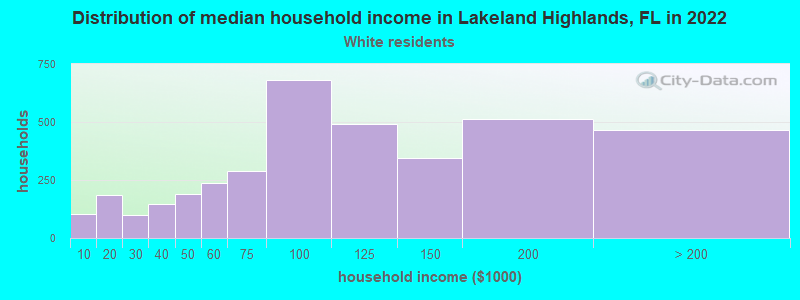
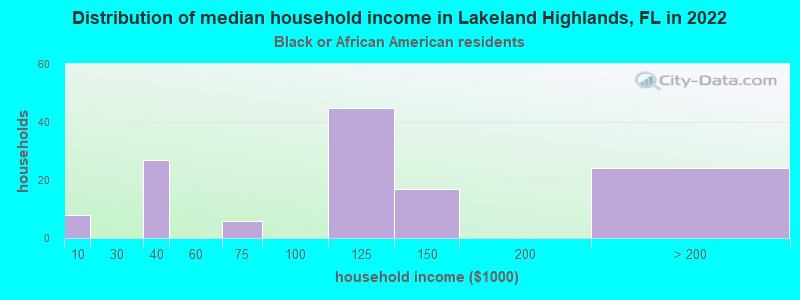
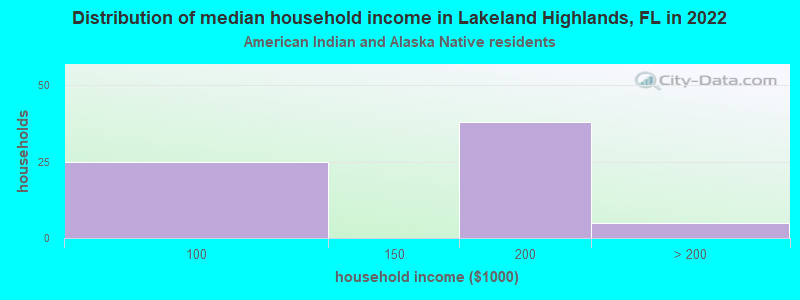
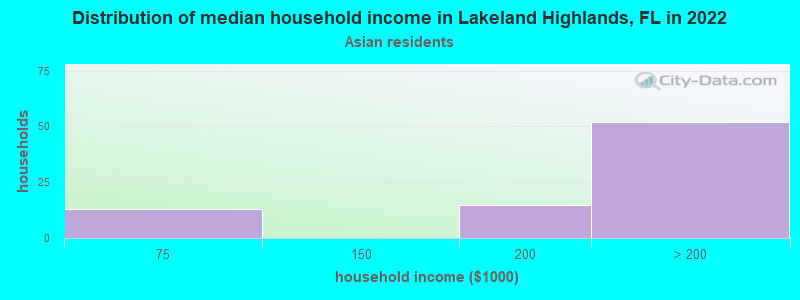
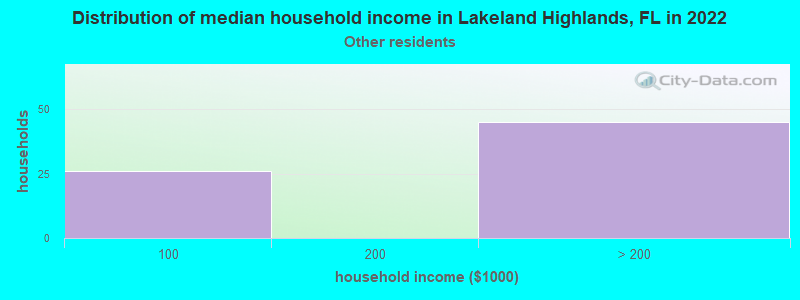
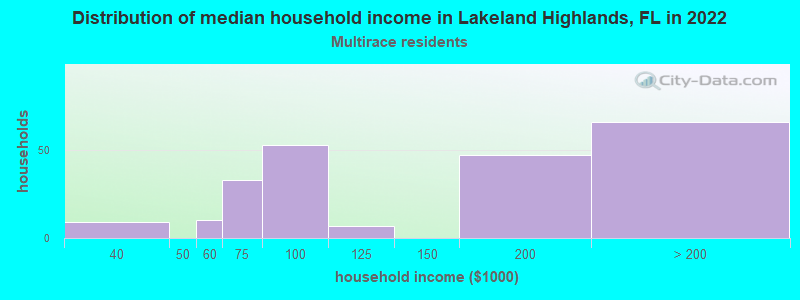
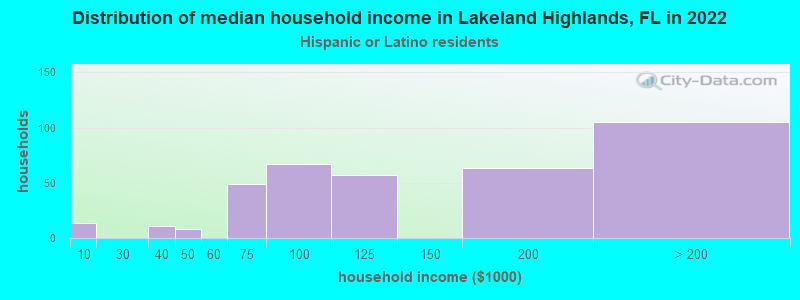
Income and house value in Lakeland Highlands Median household income in 2022 $95,922 White non-Hispanic householders$104,742 Black householders$140,003 American Indian and Alaska Native householdersover $200,000 Asian householders$119,986 Hispanic or Latino race householdersMedian 2022 house value $428,638 White Non-Hispanic householders$424,008 Black or African American householders$537,452 American Indian or Alaska Native householders $605,584 Asian householders$417,724 Some other race householders$330,739 Two or more races householders$405,817 Hispanic or Latino householders
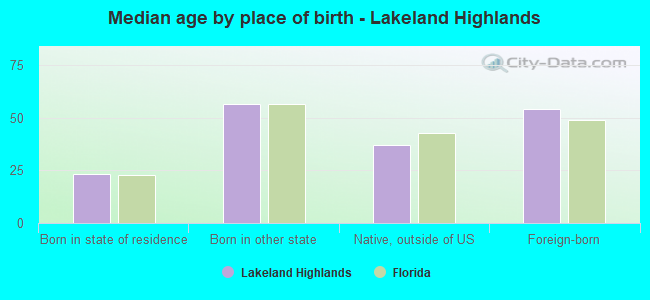
Median age by race in Lakeland Highlands
49.7 Median age for White residents48.4 51.0 39.8 Median age for Black or African American residents28.3 55.6 33.4 Median age for American Indian / Alaska Native residents45.0 30.8 53.0 Median age for Asian residents38.4 51.8 -679,849,340.2 Median age for Native Hawaiian / Pacific Islander residents-858,307,848.3 -443,298,968.6 29.0 Median age for Other race residents16.4 30.3 30.4 Median age for Two or more races residents40.8 22.4 48.1 Median age for White alone residents46.8 50.9 35.2 Median age for Hispanic or Latino residents30.6 35.5
Owner/renter occupied households by race in Lakeland Highlands
House owners and renters - White residents 3,330 86.8% Owner occupied505 13.2% Renter occupiedHouse owners and renters - Black or African American residents 52 42.5% Owner occupied70 57.5% Renter occupiedHouse owners and renters - American Indian / Alaska Native residents 33 50.2% Owner occupied32 49.8% Renter occupiedHouse owners and renters - Asian residents 74 95.3% Owner occupied4 4.7% Renter occupiedHouse owners and renters - Other race residents 35 58.7% Owner occupied24 41.3% Renter occupiedHouse owners and renters - Two or more races residents 217 100.0% Owner occupiedHouse owners and renters - White alone residents 3,321 85.9% Owner occupied546 14.1% Renter occupiedHouse owners and renters - Hispanic or Latino residents 354 87.7% Owner occupied50 12.3% Renter occupied
Language usage in Lakeland Highlands
English speakers - Total 88.3% of residents of Lakeland Highlands speak English at home.
6.7% of residents speak Spanish at home 588 75.2% Speak English very well194 24.8% Speak English less than very well2.2% of residents speak other language at home 180 71.1% Speak English very well73 28.9% Speak English less than very well
English speakers - Born in the United States 96.3% of residents of Lakeland Highlands speak English at home.
3.3% of residents speak Spanish at home 153 89.5% Speak English very well18 10.5% Speak English less than very well0.7% of residents speak other language at home 28 77.8% Speak English very well8 22.2% Speak English less than very well
English speakers - Native, born elsewhere 36.0% of residents of Lakeland Highlands speak English at home.
58.8% of residents speak Spanish at home 139 72.8% Speak English very well52 27.2% Speak English less than very well9.8% of residents speak other language at home 29 90.6% Speak English very well3 9.4% Speak English less than very well
English speakers - Foreign-born 36.6% of residents of Lakeland Highlands speak English at home.
35.7% of residents speak Spanish at home 160 58.0% Speak English very well116 42.0% Speak English less than very well20.8% of residents speak other language at home 115 71.4% Speak English very well46 28.6% Speak English less than very well
White (Caucasian) - Speak only English Native:
100.0% (8,674)Foreign-born:
56.8% (83)
White (Caucasian) - Speak another language Native:
1.6% (137)Foreign-born:
48.5% (71)
Black or African American - Speak only English Native:
93.2% (234)Foreign-born:
90.4% (28)
American Indian / Alaska Native - Speak only English Native:
77.0% (57)Foreign-born:
12.9% (5)
Asian - Speak only English Native:
69.4% (58)Foreign-born:
25.7% (32)
Asian - Speak another language Native:
29.5% (25)Foreign-born:
73.5% (92)
Other race - Speak another language Native:
36.5% (81)Foreign-born:
100.0% (99)
Two or more races - Speak only English Native:
67.2% (489)Foreign-born:
70.0% (221)
Two or more races - Speak another language Native:
31.9% (232)Foreign-born:
48.3% (153)
White alone - Speak only English Native:
98.8% (8,576)Foreign-born:
60.0% (90)
White alone - Speak another language Native:
1.2% (105)Foreign-born:
38.4% (58)
Hispanic or Latino - Speak only English Native:
62.1% (737)Foreign-born:
27.3% (111)
Hispanic or Latino - Speak another language Native:
35.2% (418)Foreign-born:
75.2% (305)
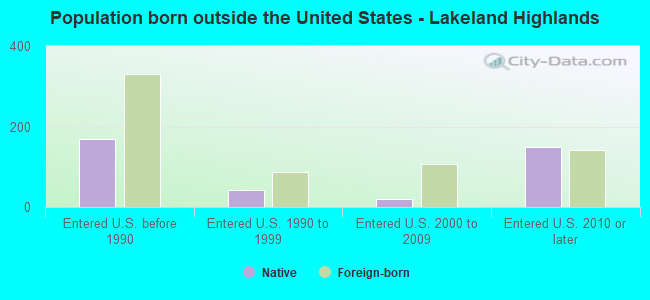
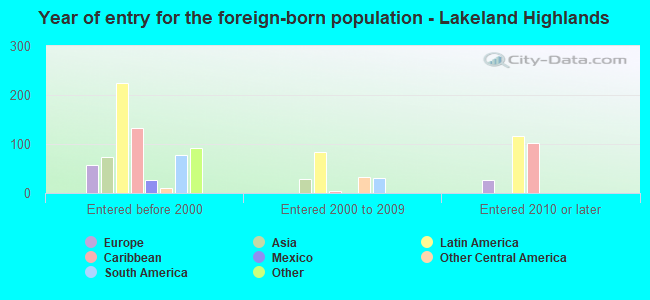
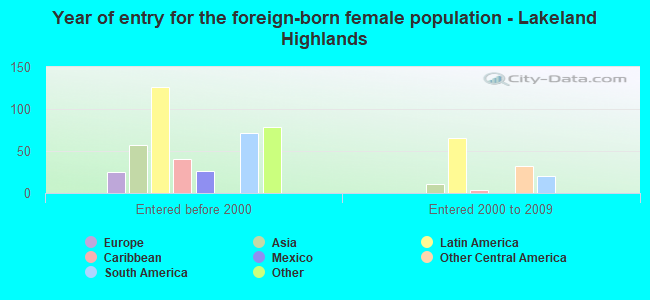
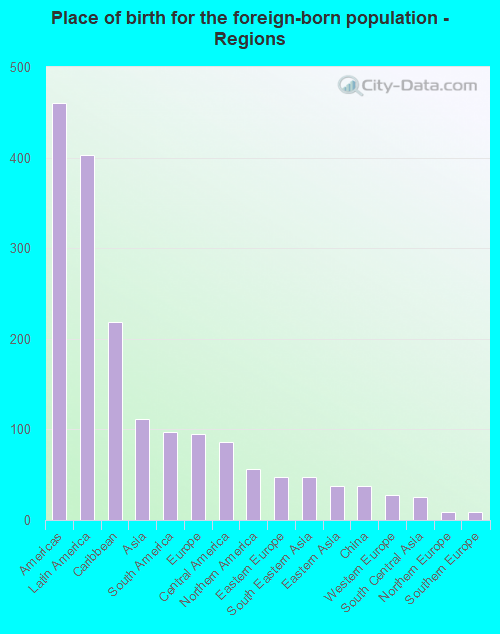
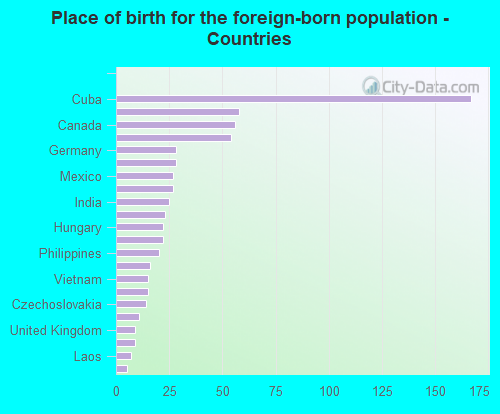
Foreign-born residents in Lakeland Highlands 668 residents are foreign born (3.4% Latin America , 0.9% Asia , 0.8% Europe ).
This city:
5.5%Florida:
21.1%
Marital status for residents in Lakeland Highlands Marital status - White (Caucasian) population 15 years and over
Males 23.0% Never married64.2% Now married0.2% Separated2.3% Widowed10.2% DivorcedFemales 22.2% Never married57.2% Now married2.2% Separated7.7% Widowed10.7% DivorcedWomen who gave birth in the past 12 months Now married:
100.0% (62)Unmarried:
0.0% (0)
Women who did not give birth in the past 12 months Now married:
48.6% (772)Unmarried:
51.4% (816)
Marital status - Black or African American population 15 years and over
Males 36.6% Never married63.4% Now married0.0% Separated0.0% Widowed0.0% DivorcedFemales 12.5% Never married25.8% Now married20.3% Separated0.0% Widowed41.4% DivorcedWomen who did not give birth in the past 12 months Now married:
69.8% (41)Unmarried:
30.2% (18)
Marital status - American Indian / Alaska Native population 15 years and over
Males 69.2% Never married15.4% Now married0.0% Separated0.0% Widowed15.4% DivorcedFemales 81.3% Never married0.0% Now married0.0% Separated0.0% Widowed18.8% DivorcedWomen who did not give birth in the past 12 months Now married:
0.0% (0)Unmarried:
100.0% (52)
Marital status - Asian population 15 years and over
Males 9.5% Never married78.6% Now married0.0% Separated11.9% Widowed0.0% DivorcedFemales 6.1% Never married65.8% Now married0.0% Separated28.1% Widowed0.0% DivorcedWomen who did not give birth in the past 12 months Now married:
76.7% (24)Unmarried:
23.3% (7)
Marital status - Other race population 15 years and over
Males 37.9% Never married62.1% Now married0.0% Separated0.0% Widowed0.0% DivorcedFemales 48.2% Never married51.8% Now married0.0% Separated0.0% Widowed0.0% DivorcedWomen who did not give birth in the past 12 months Now married:
39.4% (76)Unmarried:
60.6% (116)
Marital status - Two or more races population 15 years and over
Males 43.2% Never married44.8% Now married0.0% Separated5.8% Widowed6.2% DivorcedFemales 31.6% Never married52.4% Now married0.0% Separated0.0% Widowed16.0% DivorcedWomen who did not give birth in the past 12 months Now married:
34.0% (86)Unmarried:
66.0% (167)
Marital status - White alone, not Hispanic / Latino population 15 years and over
Males 22.5% Never married65.1% Now married0.2% Separated2.4% Widowed9.9% DivorcedFemales 22.0% Never married56.3% Now married2.4% Separated8.1% Widowed11.2% DivorcedWomen who gave birth in the past 12 months Now married:
100.0% (71)Unmarried:
0.0% (0)
Women who did not give birth in the past 12 months Now married:
47.3% (765)Unmarried:
52.7% (853)
Marital status - Hispanic or Latino population 15 years and over
Males 28.1% Never married57.3% Now married0.0% Separated4.2% Widowed10.4% DivorcedFemales 27.7% Never married64.8% Now married0.0% Separated1.6% Widowed5.9% DivorcedWomen who did not give birth in the past 12 months Now married:
56.3% (282)Unmarried:
43.7% (219)
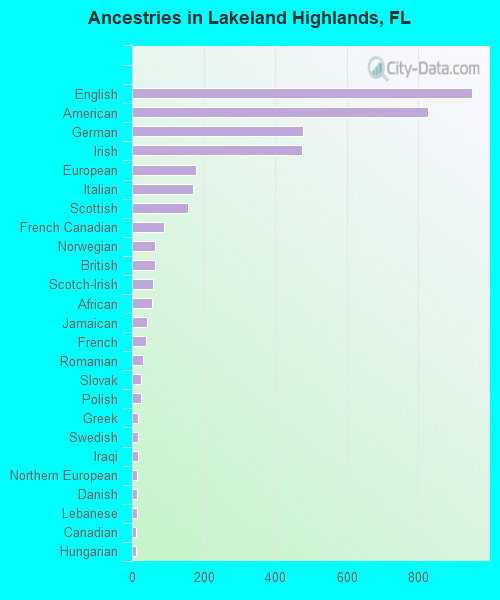
Ancestries in Lakeland Highlands
950 17.7% English826 15.4% American477 8.9% German475 8.9% Irish178 3.3% European170 3.2% Italian156 2.9% Scottish89 1.7% French Canadian64 1.2% Norwegian63 1.2% British59 1.1% Scotch-Irish57 1.1% African41 0.8% Jamaican40 0.7% French31 0.6% Romanian26 0.5% Slovak24 0.4% Polish18 0.3% Greek17 0.3% Swedish16 0.3% Iraqi15 0.3% Northern European14 0.3% Danish13 0.2% Lebanese10 0.2% Canadian10 0.2% Hungarian10 0.2% Portuguese9 0.2% Swiss8 0.1% Czech8 0.1% Welsh
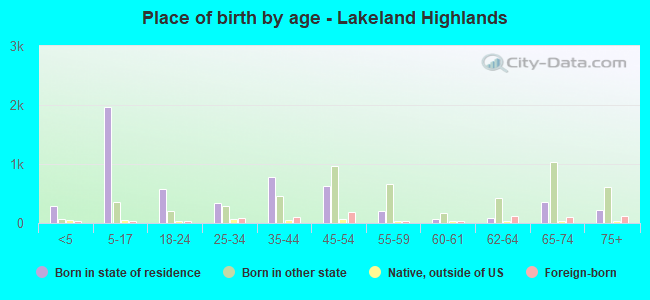
Children Nativity (place of birth) in Lakeland Highlands
Children under 6 years - Living with two parents Both parents native 427 100.0% NativeBoth parents foreign-born 41 100.0% NativeChildren under 6 years - Living with one parent Native parent 57 100.0% NativeChildren 6 to 17 years - Living with two parents Both parents native 1,328 99.2% Native11 0.8% Foreign-bornBoth parents foreign-born 110 100.0% NativeOne native, one foreign-born parent 121 100.0% NativeChildren 6 to 17 years - Living with one parent Native parent 507 100.0% NativeForeign-born parent 19 67.1% Native9 32.9% Foreign-born
Grandparents responsible for own grandchildren in Lakeland Highlands
Grandparents (30 to 59 years) White / Caucasian 19 100.0% Responsible for grandchildrenWhite alone, not Hispanic / Latino 23 100.0% Responsible for grandchildren
Grandparents (60 years and over) White / Caucasian 52 100.0% Not responsible for grandchildrenWhite alone, not Hispanic / Latino 33 100.0% Not responsible for grandchildren