Races in Lansing, Kansas (KS) Detailed Stats
Ancestries, Foreign-born residents, place of birth
Settings
X


Recent posts about races in Lansing, Kansas on our local forum with over 2,400,000 registered users:
 | BAD Parts of Kansas to avoid (0 replies) |
| Some general questions about Kansas (134 replies) |
| Ex "City Boy" yearns to become a "Country Boy" (67 replies) |
Latest news about races in Lansing, KS collected exclusively by city-data.com from local newspapers, TV, and radio stations
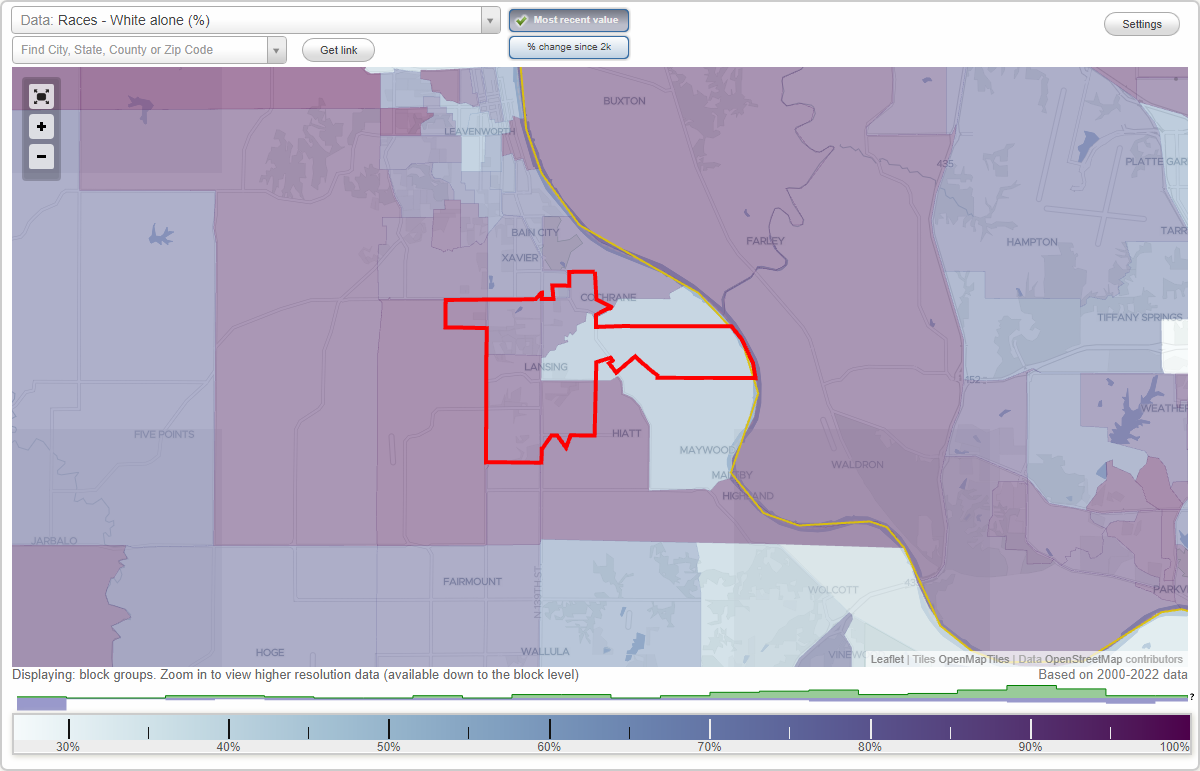
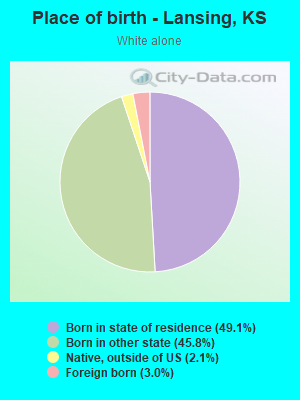
According to 2022 data, the most numerous races in Lansing, KS are White alone (8,284 residents), Hispanic (737 residents), and Black alone (1,550 residents). 95.2% of Lansing residents speak English at home. 3.6% of Lansing, KS residents are foreign-born (1.3% born in Europe, 1.2% born in Latin America, 0.9% born in Asia), which is 92.7% less than the foreign-born rate of 7.0% across the entire state of Kansas.
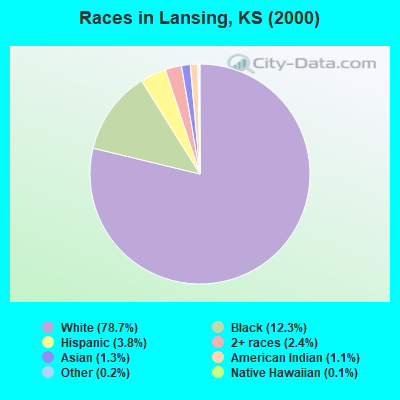
Race distribution in Lansing
2000
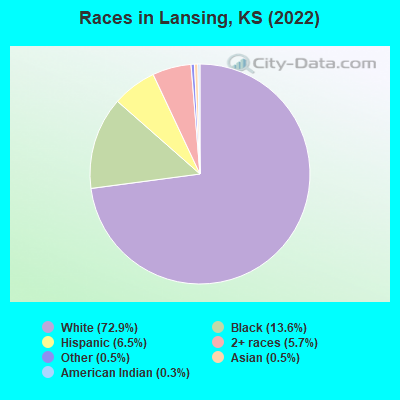
2022

- 7,23878.7%White alone
- 1,13112.3%Black alone
- 3543.8%Hispanic
- 2202.4%Two or more races
- 1211.3%Asian alone
- 1001.1%American Indian alone
- 220.2%Other race alone
- 130.1%Native Hawaiian and Other
Pacific Islander alone
-
- 8,28472.9%White alone
- 1,55013.6%Black alone
- 7376.5%Hispanic
- 6505.7%Two or more races
- 600.5%Asian alone
- 620.5%Other race alone
- 320.3%American Indian alone
- 30.03%Native Hawaiian and Other
Pacific Islander alone
2000
2022
-
- 2,233,99783.1%White alone
- 188,2527.0%Hispanic
- 151,4075.6%Black alone
- 46,3011.7%Asian alone
- 42,5081.6%Two or more races
- 22,3220.8%American Indian alone
- 2,4770.09%Other race alone
- 1,1540.04%Native Hawaiian and Other
Pacific Islander alone

-
- 2,147,94373.1%White alone
- 381,74613.0%Hispanic
- 147,6665.0%Black alone
- 145,3624.9%Two or more races
- 85,0852.9%Asian alone
- 13,2630.5%Other race alone
- 12,0650.4%American Indian alone
- 4,0200.1%Native Hawaiian and Other
Pacific Islander alone

Income and house value in Lansing
- Median household income in 2022
- $93,582White non-Hispanic householders
- $3,024Two or more races householders
- Median 2022 house value
- $265,548White Non-Hispanic householders
- $267,210Black or African American householders
- $250,821American Indian or Alaska Native householders
- $445,351Asian householders
- $154,388Some other race householders
- $270,773Two or more races householders
- $213,056Hispanic or Latino householders
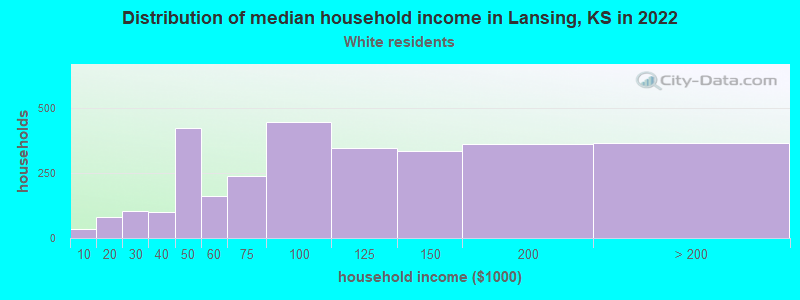
Household income for White non-Hispanic householders
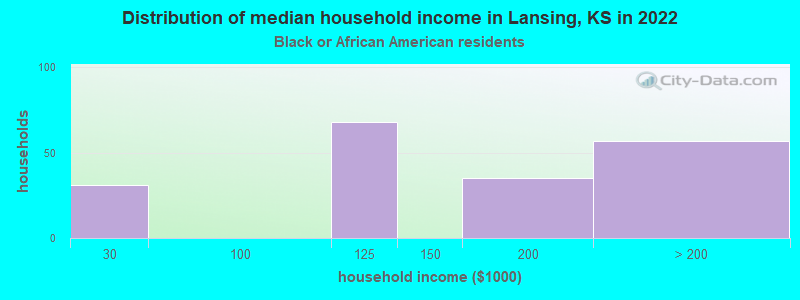
Household income for Black householders
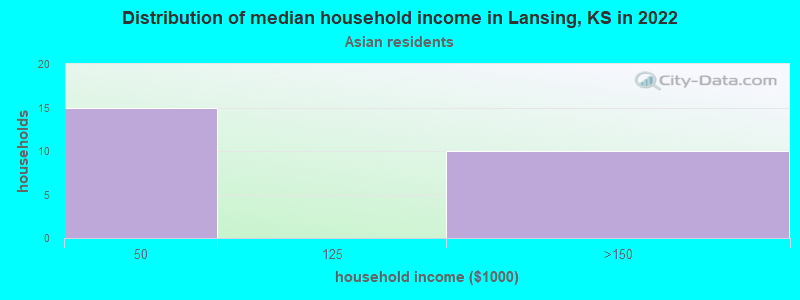
Household income for Asian householders
Household income for Some other race householders
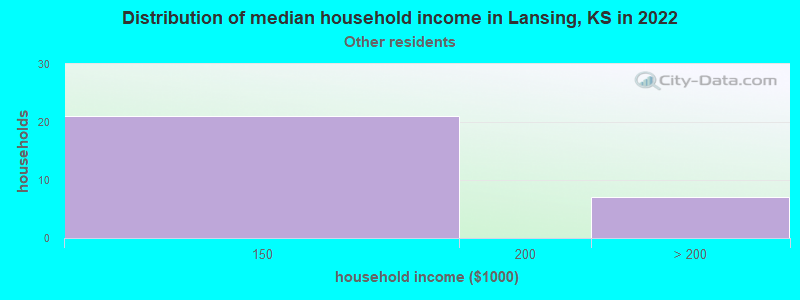
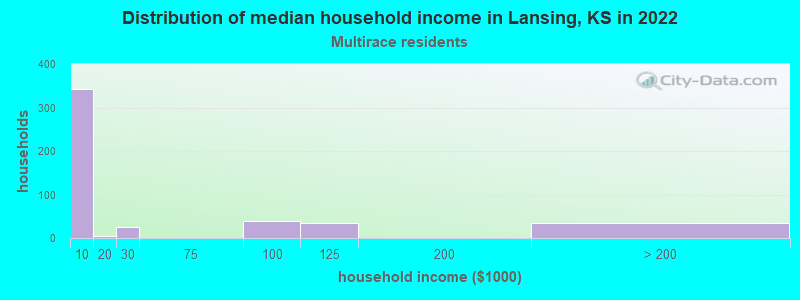
Household income for Two or more races householders
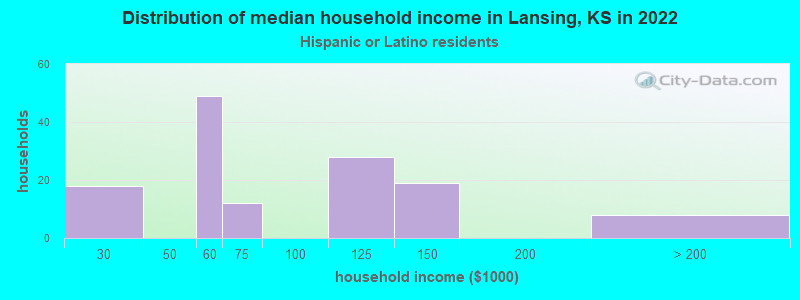
Household income for Hispanic or Latino race householders
Median age by race in Lansing
- 42.2Median age for White residents
- 41.5Males
- 43.3Females
- 30.0Median age for Black or African American residents
- 34.1Males
- 34.0Females
- 43.9Median age for American Indian / Alaska Native residents
- 46.0Males
- -654,797,229.8Females
- 69.3Median age for Asian residents
- -717,460,316.7Males
- 94.2Females
- -627,039,626.4Median age for Native Hawaiian / Pacific Islander residents
- -669,240,668.6Males
- -666,666,666.0Females
- 40.3Median age for Other race residents
- 48.4Males
- -705,402,649.7Females
- 38.2Median age for Two or more races residents
- 32.1Males
- 20.9Females
- 43.6Median age for White alone residents
- 42.1Males
- 45.6Females
- 33.9Median age for Hispanic or Latino residents
- 27.9Males
- 16.7Females
Owner/renter occupied households by race in Lansing
- House owners and renters - White residents
- 2,64985.5%Owner occupied
- 45014.5%Renter occupied
- House owners and renters - Black or African American residents
- 14086.4%Owner occupied
- 2213.6%Renter occupied
- House owners and renters - Asian residents
- 1748.8%Owner occupied
- 1851.2%Renter occupied
- House owners and renters - Other race residents
- 33100.0%Owner occupied
- House owners and renters - Two or more races residents
- 42691.6%Owner occupied
- 398.4%Renter occupied
- House owners and renters - White alone residents
- 2,59084.9%Owner occupied
- 46115.1%Renter occupied
- House owners and renters - Hispanic or Latino residents
- 15593.2%Owner occupied
- 116.8%Renter occupied
Language usage in Lansing
- English speakers - Total
- 95.2% of residents of Lansing speak English at home.
- 2.2% of residents speak Spanish at home
- 20283.8%Speak English very well
- 3916.2%Speak English less than very well
- 2.5% of residents speak other language at home
- 15557.4%Speak English very well
- 11542.6%Speak English less than very well
- English speakers - Born in the United States
- 96.4% of residents of Lansing speak English at home.
- 3.2% of residents speak Spanish at home
- 15997.5%Speak English very well
- 42.5%Speak English less than very well
- 0.4% of residents speak other language at home
- 21100.0%Speak English very well
All residents speak only English at home
- English speakers - Foreign-born
- 40.2% of residents of Lansing speak English at home.
- 10.1% of residents speak Spanish at home
- 717.1%Speak English very well
- 3482.9%Speak English less than very well
- 48.9% of residents speak other language at home
- 9648.5%Speak English very well
- 10251.5%Speak English less than very well
White (Caucasian) - Speak only English
| Native: | 97.8% (7,860) |
| Foreign-born: | 24.3% (55) |
White (Caucasian) - Speak another language
| Native: | 2.2% (176) |
| Foreign-born: | 78.2% (178) |
Black or African American - Speak only English
| Native: | 94.9% (1,281) |
| Foreign-born: | 72.6% (50) |
Black or African American - Speak another language
| Native: | 5.2% (70) |
| Foreign-born: | 32.3% (22) |
Other race - Speak only English
| Native: | 100.0% (197) |
| Foreign-born: | 100.0% (37) |
Other race - Speak another language
| Native: | 5.0% (10) |
| Foreign-born: | 21.8% (8) |
Two or more races - Speak another language
| Native: | 10.8% (82) |
| Foreign-born: | 100.0% (13) |
White alone - Speak only English
| Native: | 99.1% (7,572) |
| Foreign-born: | 23.3% (58) |
White alone - Speak another language
| Native: | 0.9% (66) |
| Foreign-born: | 83.1% (208) |
Hispanic or Latino - Speak only English
| Native: | 78.2% (508) |
| Foreign-born: | 58.0% (31) |
Hispanic or Latino - Speak another language
| Native: | 22.1% (143) |
| Foreign-born: | 53.0% (28) |
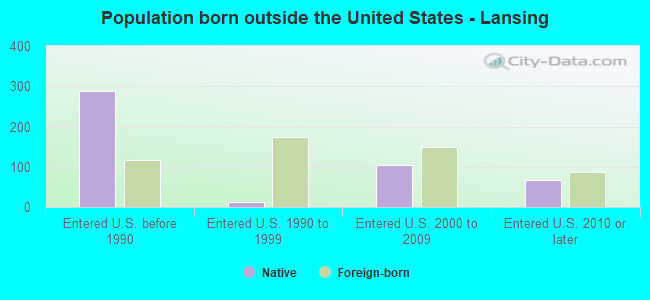
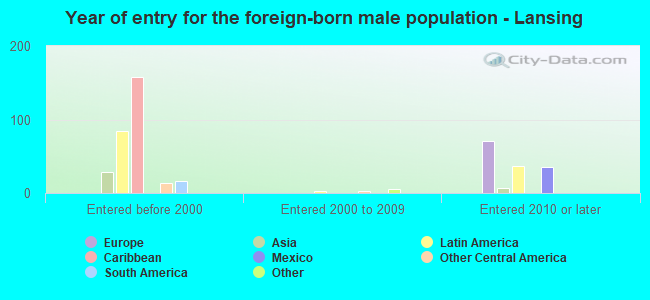
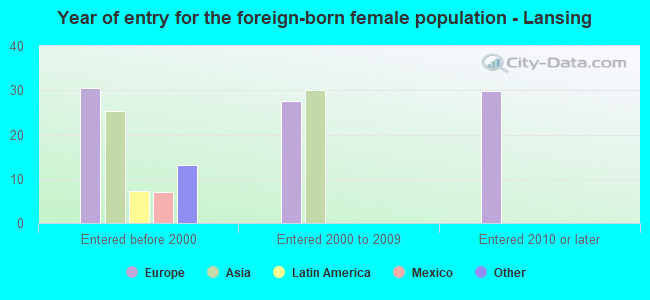
Foreign-born residents in Lansing
413 residents are foreign born (1.3% Europe, 1.2% Latin America, 0.9% Asia).
| This city: | 3.6% |
| Kansas: | 7.1% |
Marital status for residents in Lansing
Marital status - White (Caucasian) population 15 years and over
- Males
- 34.2%Never married
- 48.0%Now married
- 1.0%Separated
- 4.4%Widowed
- 12.4%Divorced
- Females
- 27.4%Never married
- 54.7%Now married
- 0.6%Separated
- 7.7%Widowed
- 9.5%Divorced
Women who gave birth in the past 12 months
| Now married: | 72.7% (46) |
| Unmarried: | 27.3% (17) |
Women who did not give birth in the past 12 months
| Now married: | 41.2% (645) |
| Unmarried: | 58.8% (921) |
Marital status - Black or African American population 15 years and over
- Males
- 53.9%Never married
- 29.0%Now married
- 4.1%Separated
- 1.3%Widowed
- 11.7%Divorced
- Females
- 33.0%Never married
- 54.7%Now married
- 0.0%Separated
- 12.3%Widowed
- 0.0%Divorced
Women who did not give birth in the past 12 months
| Now married: | 47.6% (92) |
| Unmarried: | 52.4% (101) |
Marital status - Asian population 15 years and over
- Males
- 0.0%Never married
- 100.0%Now married
- 0.0%Separated
- 0.0%Widowed
- 0.0%Divorced
- Females
- 24.4%Never married
- 31.1%Now married
- 0.0%Separated
- 0.0%Widowed
- 44.4%Divorced
Women who did not give birth in the past 12 months
| Now married: | 0.0% (0) |
| Unmarried: | 100.0% (20) |
Marital status - Other race population 15 years and over
- Males
- 62.1%Never married
- 0.7%Now married
- 0.0%Separated
- 13.1%Widowed
- 24.1%Divorced
- Females
- 0.0%Never married
- 100.0%Now married
- 0.0%Separated
- 0.0%Widowed
- 0.0%Divorced
Marital status - Two or more races population 15 years and over
- Males
- 77.0%Never married
- 23.0%Now married
- 0.0%Separated
- 0.0%Widowed
- 0.0%Divorced
- Females
- 0.0%Never married
- 48.1%Now married
- 0.0%Separated
- 27.3%Widowed
- 24.7%Divorced
Women who did not give birth in the past 12 months
| Now married: | 90.2% (49) |
| Unmarried: | 9.8% (5) |
Marital status - White alone, not Hispanic / Latino population 15 years and over
- Males
- 31.7%Never married
- 51.1%Now married
- 0.6%Separated
- 4.5%Widowed
- 12.1%Divorced
- Females
- 28.4%Never married
- 55.0%Now married
- 0.6%Separated
- 8.0%Widowed
- 8.0%Divorced
Women who gave birth in the past 12 months
| Now married: | 72.7% (47) |
| Unmarried: | 27.3% (17) |
Women who did not give birth in the past 12 months
| Now married: | 41.5% (625) |
| Unmarried: | 58.5% (880) |
Marital status - Hispanic or Latino population 15 years and over
- Males
- 66.1%Never married
- 0.3%Now married
- 5.1%Separated
- 6.8%Widowed
- 21.7%Divorced
- Females
- 0.0%Never married
- 46.2%Now married
- 0.0%Separated
- 13.8%Widowed
- 40.0%Divorced
Women who did not give birth in the past 12 months
| Now married: | 34.8% (33) |
| Unmarried: | 65.2% (61) |
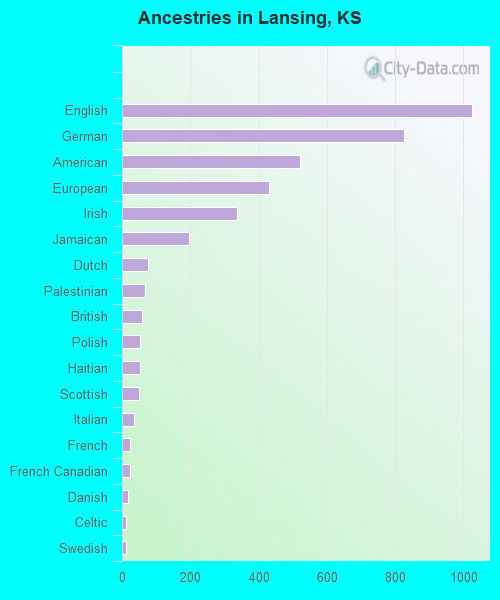
Ancestries in Lansing

- 1,02419.7%English
- 82515.9%German
- 52210.0%American
- 4328.3%European
- 3386.5%Irish
- 1953.7%Jamaican
- 761.5%Dutch
- 681.3%Palestinian
- 601.2%British
- 541.0%Polish
- 541.0%Haitian
- 501.0%Scottish
- 360.7%Italian
- 240.5%French
- 220.4%French Canadian
- 180.3%Danish
- 120.2%Celtic
- 120.2%Swedish
- 70.1%Scotch-Irish
- 70.1%African
- 70.1%Welsh
- 60.1%Norwegian
- 30.06%Ethiopian
- 10.02%Brazilian
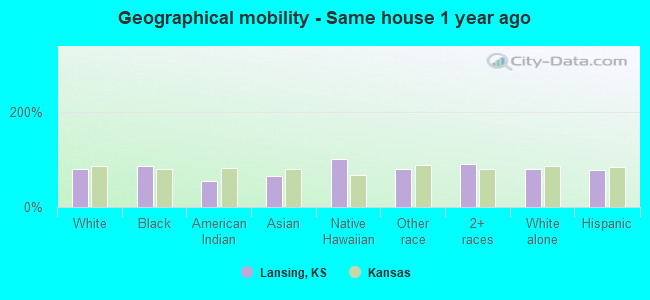
Geographical mobility in Lansing

- Same house 1 year ago
- 6,88479.5%White (Caucasian)
- 1,29785.0%Black or African American
- 1855.4%American Indian / Alaska Native
- 3965.7%Asian
- 3100.0%Native Hawaiian / Pacific Islander
- 18180.2%Other race
- 89090.7%Two or more races
- 6,56379.9%White alone, not Hispanic / Latino
- 55176.5%Hispanic or Latino
-
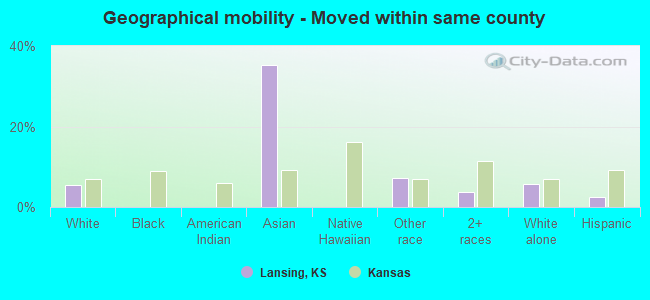
- Moved within same county
- 4645.4%White / Caucasian
- 2135.2%Asian
- 167.2%Other race
- 363.6%Two or more races
- 4775.8%White alone, not Hispanic / Latino
- 172.4%Hispanic or Latino
-
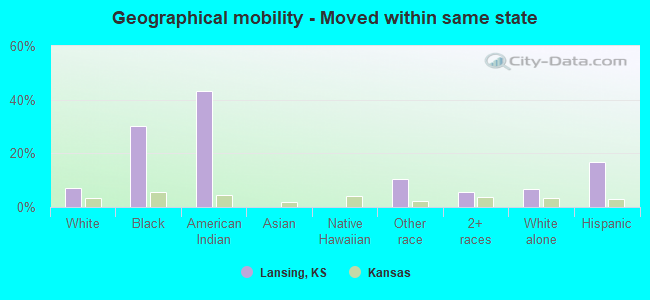
- Moved within same state
- 6197.2%White / Caucasian
- 46230.3%Black or African American
- 1443.3%American Indian / Alaska Native
- 2410.6%Other race
- 545.5%Two or more races
- 5496.7%White alone, not Hispanic / Latino
- 12116.8%Hispanic or Latino
-
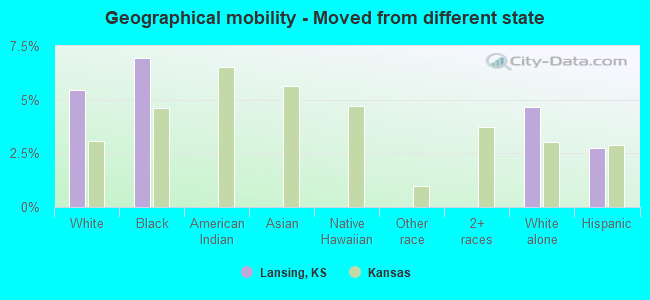
- Moved from different state
- 4725.4%White / Caucasian
- 1067.0%Black or African American
- 3844.7%White alone, not Hispanic / Latino
- 202.8%Hispanic or Latino
-
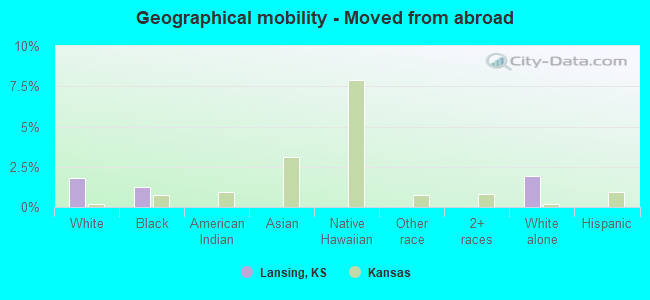
- Moved from abroad
- 1551.8%White
- 191.3%Black or African American
- 1571.9%White alone, not Hispanic / Latino
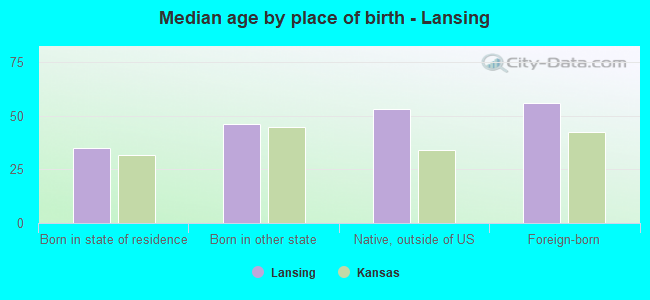
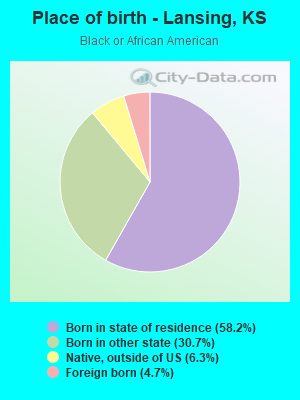
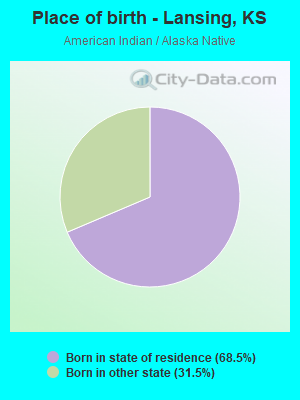
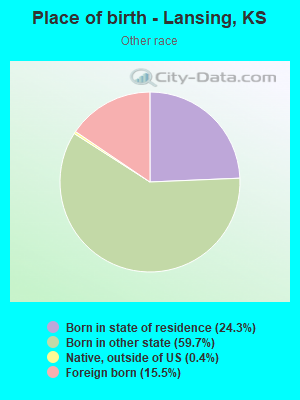
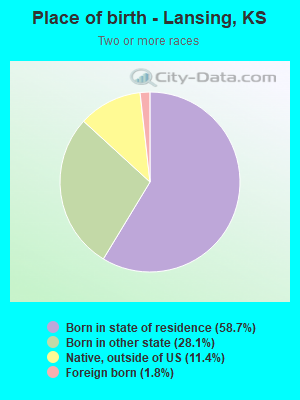
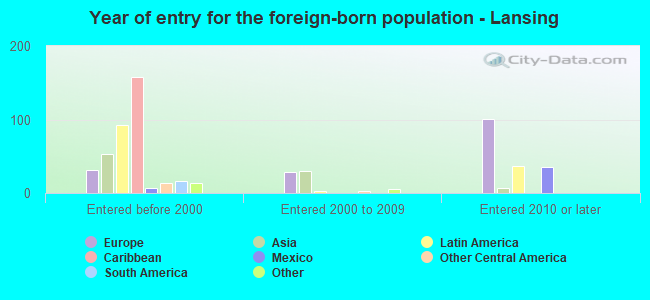
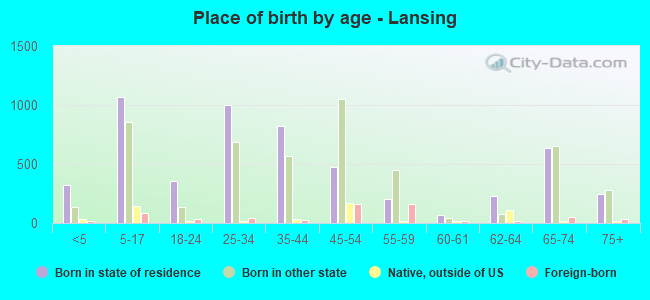
Children Nativity (place of birth) in Lansing
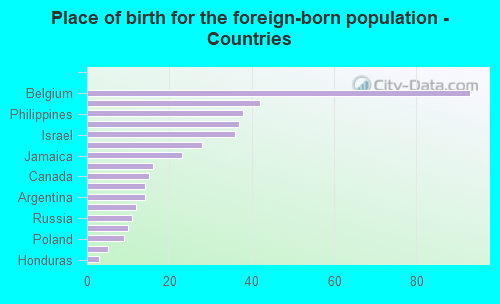
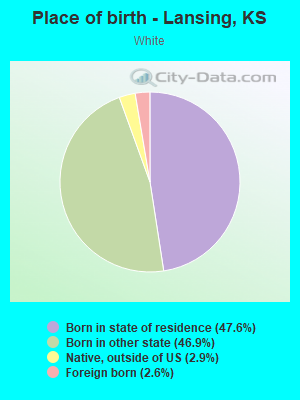
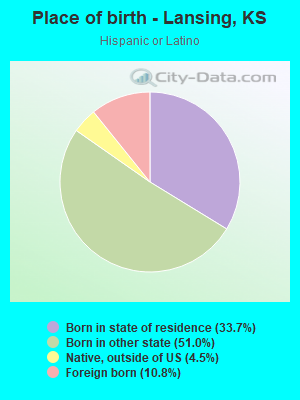
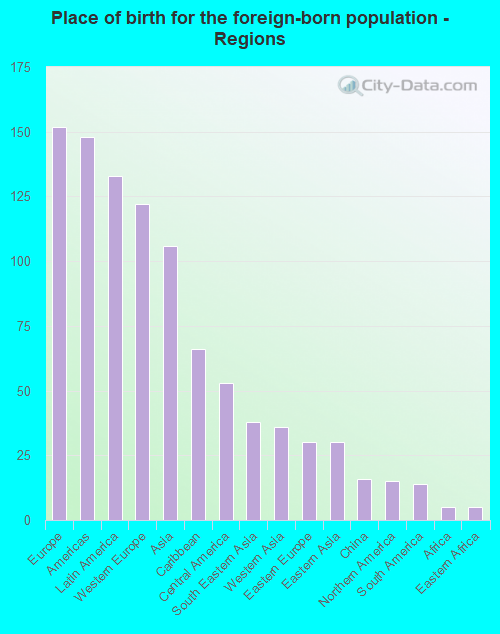
Place of birth for residents in Lansing
![Place of birth for the foreign-born population - Regions]()
- 152Europe
- 148Americas
- 133Latin America
- 122Western Europe
- 106Asia
- 66Caribbean
- 53Central America
- 38South Eastern Asia
- 36Western Asia
- 30Eastern Europe
- 30Eastern Asia
- 16China
- 15Northern America
- 14South America
- 5Africa
- 5Eastern Africa
![Place of birth for the foreign-born population - Countries]()
- 93Belgium
- 42Haiti
- 38Philippines
- 37Mexico
- 36Israel
- 28Germany
- 23Jamaica
- 16Taiwan
- 15Canada
- 14Korea
- 14Argentina
- 12El Salvador
- 11Russia
- 10Czechoslovakia
- 9Poland
- 5Ethiopia
- 3Honduras