Races in Las Posas, California (CA) Detailed Stats
Ancestries, Foreign-born residents, place of birth
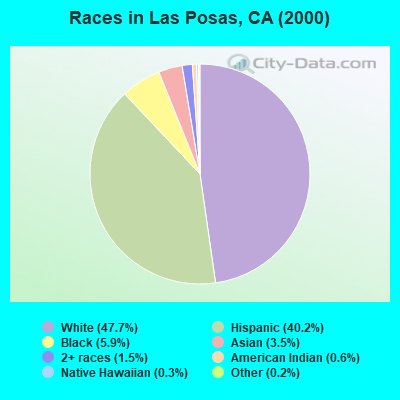
Race distribution in Las Posas

- 1,84947.7%White alone
- 1,55940.2%Hispanic
- 2295.9%Black alone
- 1353.5%Asian alone
- 601.5%Two or more races
- 230.6%American Indian alone
- 110.3%Native Hawaiian and Other
Pacific Islander alone - 90.2%Other race alone
2000
2022
-
- 15,816,79046.7%White alone
- 10,966,55632.4%Hispanic
- 3,648,86010.8%Asian alone
- 2,181,9266.4%Black alone
- 903,1152.7%Two or more races
- 178,9840.5%American Indian alone
- 103,7360.3%Native Hawaiian and Other
Pacific Islander alone - 71,6810.2%Other race alone

-
- 15,732,18440.3%Hispanic
- 13,160,42633.7%White alone
- 5,957,86715.3%Asian alone
- 2,025,2185.2%Black alone
- 1,663,2224.3%Two or more races
- 251,6180.6%Other race alone
- 135,7770.3%Native Hawaiian and Other
Pacific Islander alone - 103,0300.3%American Indian alone

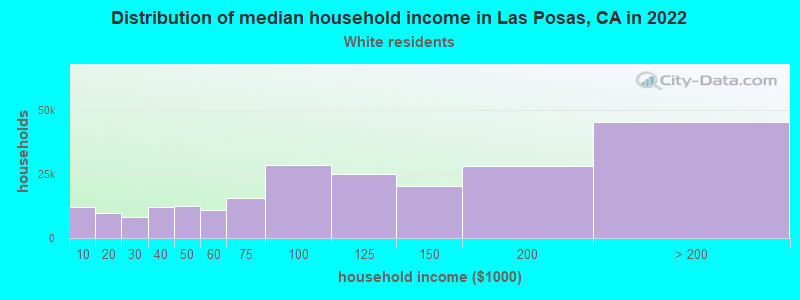
Income and house value in Las Posas
- Median household income in 2022
- $176,141White non-Hispanic householders
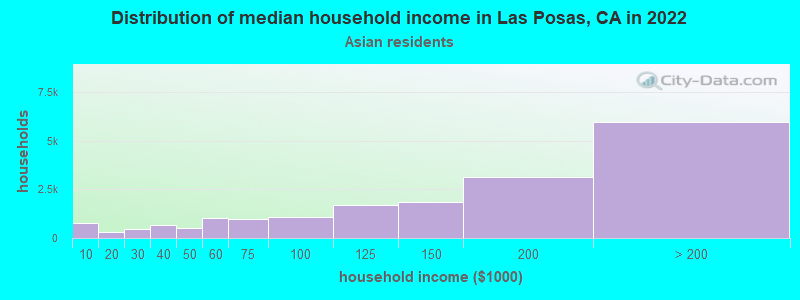
- $141,515Asian householders
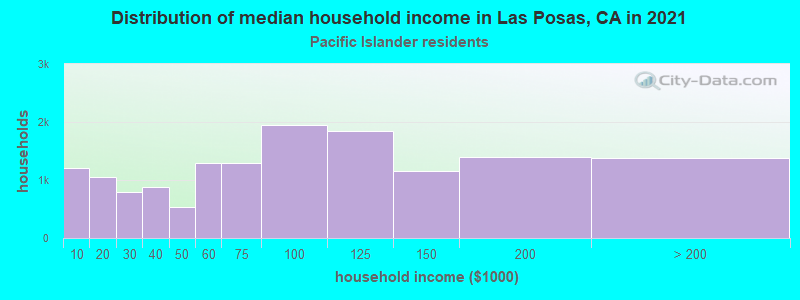
- $24,444Native Hawaiian and other Pacific Islander householders
- $84,341Some other race householders
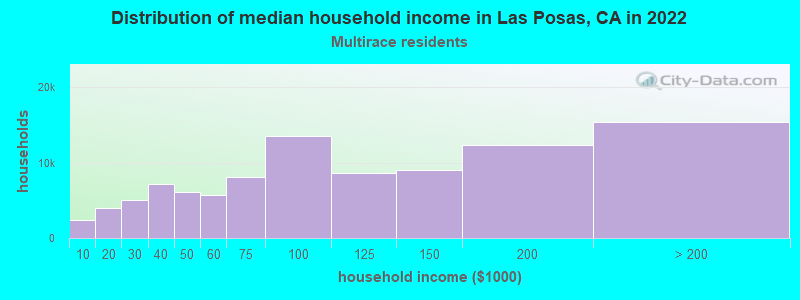
- over $200,000Two or more races householders
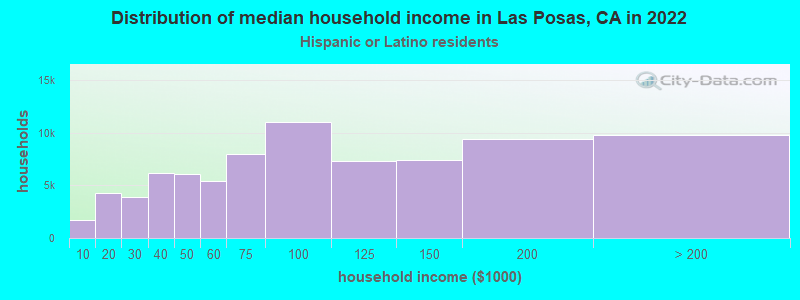
- $87,236Hispanic or Latino race householders
- Median 2022 house value
- over $1,000,000White Non-Hispanic householders
- $610,440Asian householders
- $674,868Some other race householders
- $712,300Hispanic or Latino householders
Household income for White non-Hispanic householders
Household income for Asian householders
Household income for Native Hawaiian and other Pacific Islander householders
Household income for Two or more races householders
Household income for Hispanic or Latino race householders
Zip code: 93066