Races in Lavon, Texas (TX) Detailed Stats
Data:
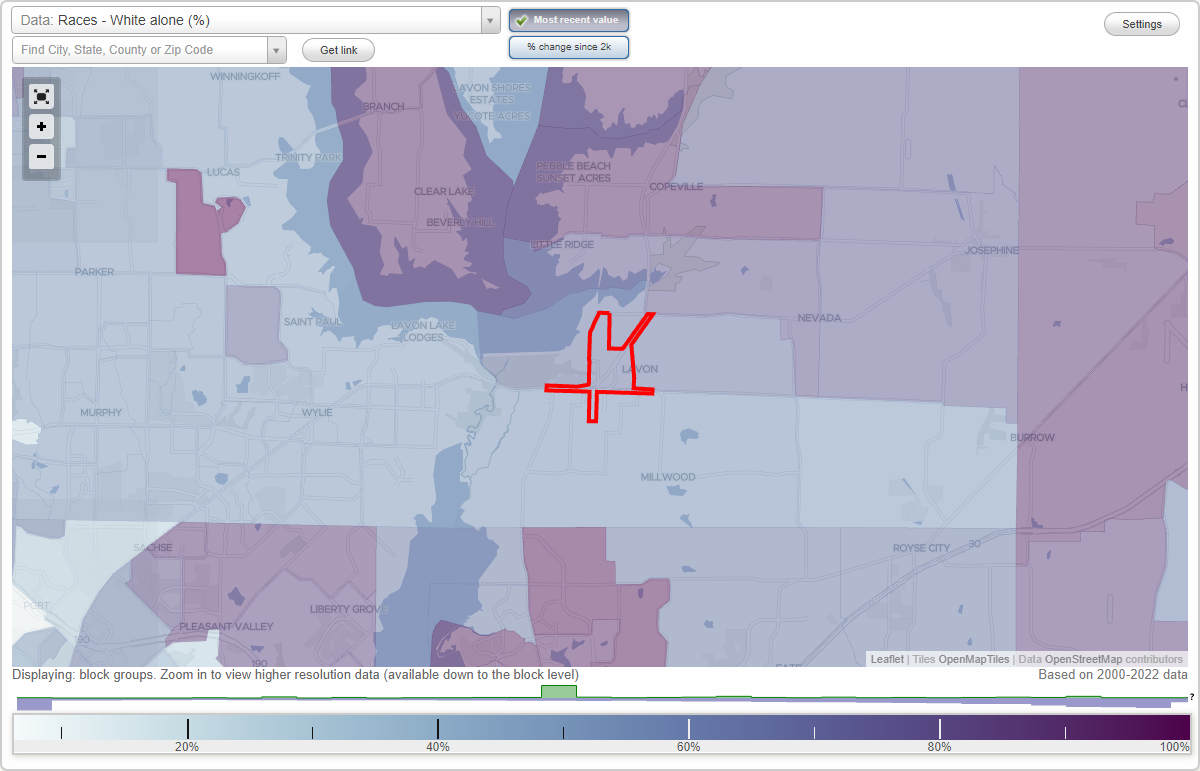
Races - White alone (%)
Races - White alone (% change since 2000)
Races - Black alone (%)
Races - Black alone (% change since 2000)
Races - American Indian alone (%)
Races - American Indian alone (% change since 2000)
Races - Asian alone (%)
Races - Asian alone (% change since 2000)
Races - Hispanic (%)
Races - Hispanic (% change since 2000)
Races - Native Hawaiian and Other Pacific Islander alone (%)
Races - Native Hawaiian and Other Pacific Islander alone (% change since 2000)
Races - Two or more races(%)
Races - Two or more races(% change since 2000)
Races - Other race alone (%)
Races - Other race alone (% change since 2000)
Racial diversity
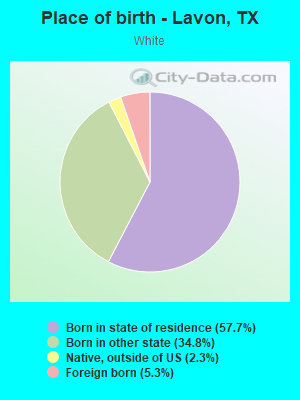
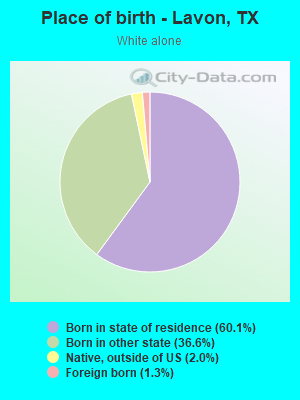
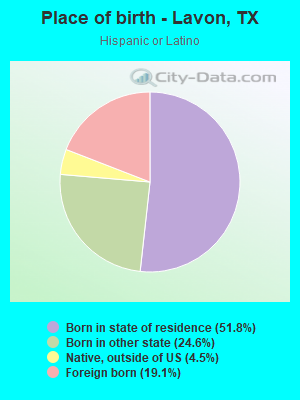
Place of birth - Born in state of residence (%)
Place of birth - Born in state of residence (%) - White
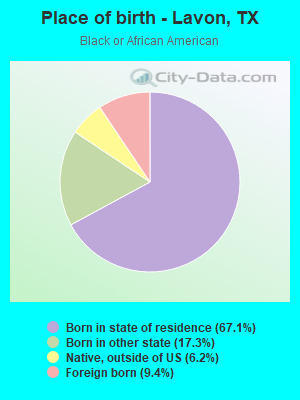
Place of birth - Born in state of residence (%) - Black or African American
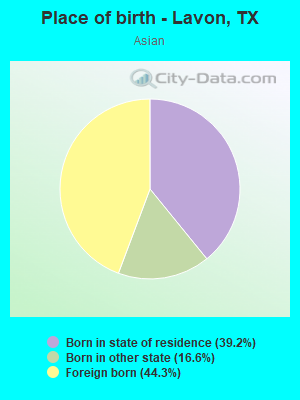
Place of birth - Born in state of residence (%) - Asian
Place of birth - Born in state of residence (%) - Hispanic or Latino
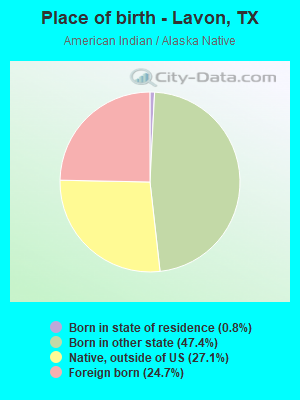
Place of birth - Born in state of residence (%) - American Indian and Alaska Native
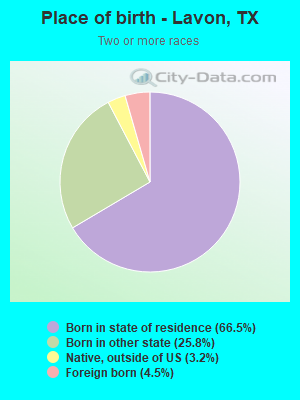
Place of birth - Born in state of residence (%) - Multirace
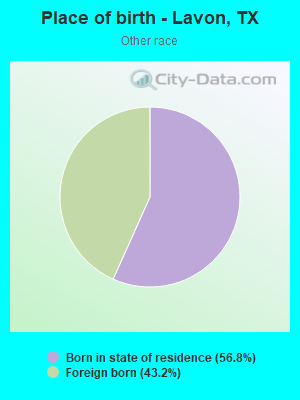
Place of birth - Born in state of residence (%) - Other Race
Place of birth - Born in other state (%)
Place of birth - Born in other state (%) - White
Place of birth - Born in other state (%) - Black or African American
Place of birth - Born in other state (%) - Asian
Place of birth - Born in other state (%) - Hispanic or Latino
Place of birth - Born in other state (%) - American Indian and Alaska Native
Place of birth - Born in other state (%) - Multirace
Place of birth - Born in other state (%) - Other Race
Place of birth - Native, outside of US (%)
Place of birth - Native, outside of US (%) - White
Place of birth - Native, outside of US (%) - Black or African American
Place of birth - Native, outside of US (%) - Asian
Place of birth - Native, outside of US (%) - Hispanic or Latino
Place of birth - Native, outside of US (%) - American Indian and Alaska Native
Place of birth - Native, outside of US (%) - Multirace
Place of birth - Native, outside of US (%) - Other Race
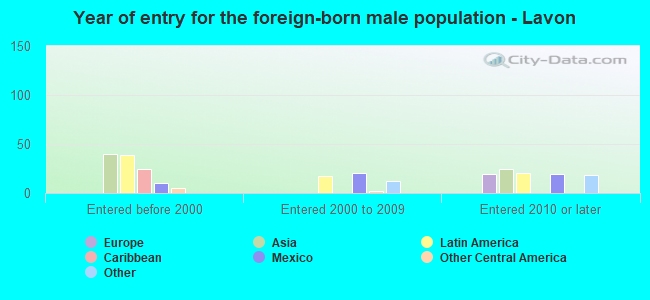
Place of birth - Foreign born (%)
Place of birth - Foreign born (%) - White
Place of birth - Foreign born (%) - Black or African American
Place of birth - Foreign born (%) - Asian
Place of birth - Foreign born (%) - Hispanic or Latino
Place of birth - Foreign born (%) - American Indian and Alaska Native
Place of birth - Foreign born (%) - Multirace
Place of birth - Foreign born (%) - Other Race
Residents speaking English at home (%)
Residents speaking English at home - Born in the United States (%)
Residents speaking English at home - Native, born elsewhere (%)
Residents speaking English at home - Foreign born (%)
Residents speaking Spanish at home (%)
Residents speaking Spanish at home - Born in the United States (%)
Residents speaking Spanish at home - Native, born elsewhere (%)
Residents speaking Spanish at home - Foreign born (%)
Residents speaking other language at home (%)
Residents speaking other language at home - Born in the United States (%)
Residents speaking other language at home - Native, born elsewhere (%)
Residents speaking other language at home - Foreign born (%)
Marital status - Never married (%)
Marital status - Now married (%)
Marital status - Separated (%)
Marital status - Widowed (%)
Marital status - Divorced (%)
Ancestries Reported - Arab (%)
Ancestries Reported - Czech (%)
Ancestries Reported - Danish (%)
Ancestries Reported - Dutch (%)
Ancestries Reported - English (%)
Ancestries Reported - French (%)
Ancestries Reported - French Canadian (%)
Ancestries Reported - German (%)
Ancestries Reported - Greek (%)
Ancestries Reported - Hungarian (%)
Ancestries Reported - Irish (%)
Ancestries Reported - Italian (%)
Ancestries Reported - Lithuanian (%)
Ancestries Reported - Norwegian (%)
Ancestries Reported - Polish (%)
Ancestries Reported - Portuguese (%)
Ancestries Reported - Russian (%)
Ancestries Reported - Scotch-Irish (%)
Ancestries Reported - Scottish (%)
Ancestries Reported - Slovak (%)
Ancestries Reported - Subsaharan African (%)
Ancestries Reported - Swedish (%)
Ancestries Reported - Swiss (%)
Ancestries Reported - Ukrainian (%)
Ancestries Reported - United States (%)
Ancestries Reported - Welsh (%)
Ancestries Reported - West Indian (%)
Ancestries Reported - Other (%)
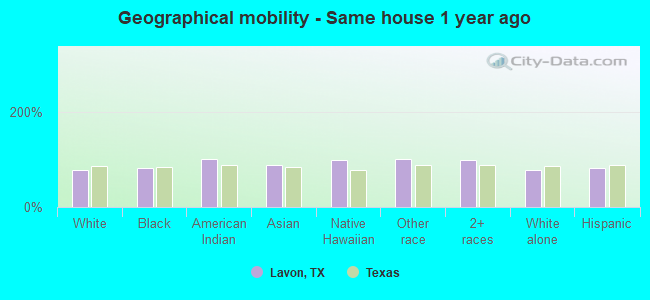
Geographical mobility - Same house 1 year ago (%)
Geographical mobility - Same house 1 year ago (%) - White
Geographical mobility - Same house 1 year ago (%) - Black or African American
Geographical mobility - Same house 1 year ago (%) - Asian
Geographical mobility - Same house 1 year ago (%) - Hispanic or Latino
Geographical mobility - Same house 1 year ago (%) - American Indian and Alaska Native
Geographical mobility - Same house 1 year ago (%) - Multirace
Geographical mobility - Same house 1 year ago (%) - Other Race
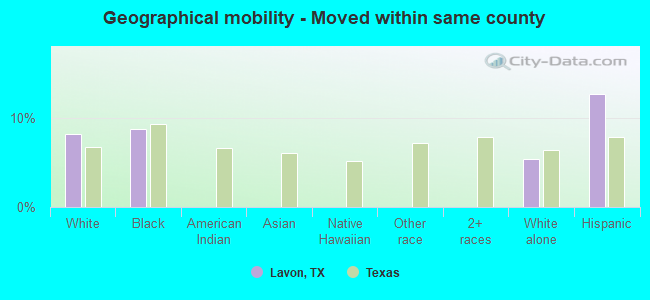
Geographical mobility - Moved within same county (%)
Geographical mobility - Moved within same county (%) - White
Geographical mobility - Moved within same county (%) - Black or African American
Geographical mobility - Moved within same county (%) - Asian
Geographical mobility - Moved within same county (%) - Hispanic or Latino
Geographical mobility - Moved within same county (%) - American Indian and Alaska Native
Geographical mobility - Moved within same county (%) - Multirace
Geographical mobility - Moved within same county (%) - Other Race
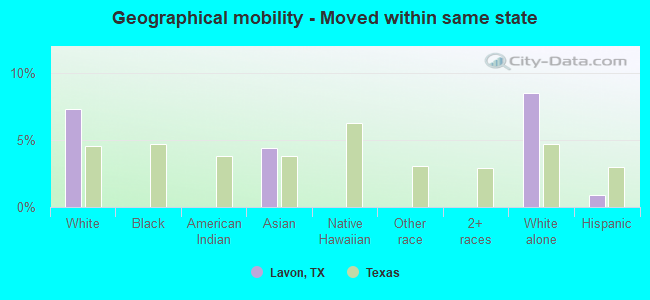
Geographical mobility - Moved from different county within same state (%)
Geographical mobility - Moved from different county within same state (%) - White
Geographical mobility - Moved from different county within same state (%) - Black or African American
Geographical mobility - Moved from different county within same state (%) - Asian
Geographical mobility - Moved from different county within same state (%) - Hispanic or Latino
Geographical mobility - Moved from different county within same state (%) - American Indian and Alaska Native
Geographical mobility - Moved from different county within same state (%) - Multirace
Geographical mobility - Moved from different county within same state (%) - Other Race
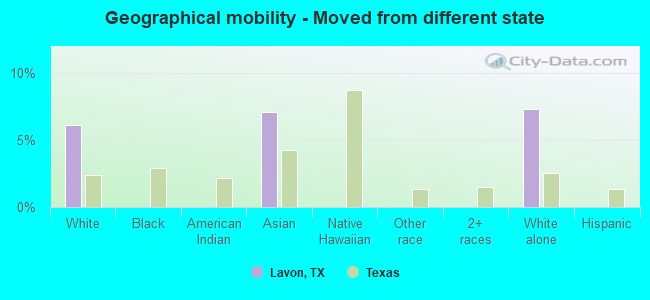
Geographical mobility - Moved from different state (%)
Geographical mobility - Moved from different state (%) - White
Geographical mobility - Moved from different state (%) - Black or African American
Geographical mobility - Moved from different state (%) - Asian
Geographical mobility - Moved from different state (%) - Hispanic or Latino
Geographical mobility - Moved from different state (%) - American Indian and Alaska Native
Geographical mobility - Moved from different state (%) - Multirace
Geographical mobility - Moved from different state (%) - Other Race
Geographical mobility - Moved from abroad (%)
Geographical mobility - Moved from abroad (%) - White
Geographical mobility - Moved from abroad (%) - Black or African American
Geographical mobility - Moved from abroad (%) - Asian
Geographical mobility - Moved from abroad (%) - Hispanic or Latino
Geographical mobility - Moved from abroad (%) - American Indian and Alaska Native
Geographical mobility - Moved from abroad (%) - Multirace
Geographical mobility - Moved from abroad (%) - Other Race
Place of birth for the foreign-born population - Ireland (%)
Place of birth for the foreign-born population - Denmark (%)
Place of birth for the foreign-born population - Norway (%)
Place of birth for the foreign-born population - Sweden (%)
Place of birth for the foreign-born population - United Kingdom (%)
Place of birth for the foreign-born population - England (%)
Place of birth for the foreign-born population - Scotland (%)
Place of birth for the foreign-born population - Other Northern Europe (%)
Place of birth for the foreign-born population - Austria (%)
Place of birth for the foreign-born population - Belgium (%)
Place of birth for the foreign-born population - France (%)
Place of birth for the foreign-born population - Germany (%)
Place of birth for the foreign-born population - Netherlands (%)
Place of birth for the foreign-born population - Switzerland (%)
Place of birth for the foreign-born population - Other Western Europe (%)
Place of birth for the foreign-born population - Greece (%)
Place of birth for the foreign-born population - Italy (%)
Place of birth for the foreign-born population - Portugal (%)
Place of birth for the foreign-born population - Spain (%)
Place of birth for the foreign-born population - Other Southern Europe (%)
Place of birth for the foreign-born population - Albania (%)
Place of birth for the foreign-born population - Belarus (%)
Place of birth for the foreign-born population - Bosnia and Herzegovina (%)
Place of birth for the foreign-born population - Bulgaria (%)
Place of birth for the foreign-born population - Croatia (%)
Place of birth for the foreign-born population - Czechoslovakia (%)
Place of birth for the foreign-born population - Hungary (%)
Place of birth for the foreign-born population - Latvia (%)
Place of birth for the foreign-born population - Lithuania (%)
Place of birth for the foreign-born population - North Macedonia (Macedonia) (%)
Place of birth for the foreign-born population - Moldova (%)
Place of birth for the foreign-born population - Poland (%)
Place of birth for the foreign-born population - Romania (%)
Place of birth for the foreign-born population - Russia (%)
Place of birth for the foreign-born population - Serbia (%)
Place of birth for the foreign-born population - Ukraine (%)
Place of birth for the foreign-born population - Other Eastern Europe (%)
Place of birth for the foreign-born population - China (%)
Place of birth for the foreign-born population - Hong Kong (%)
Place of birth for the foreign-born population - Taiwan (%)
Place of birth for the foreign-born population - Japan (%)
Place of birth for the foreign-born population - Korea (%)
Place of birth for the foreign-born population - Other Eastern Asia (%)
Place of birth for the foreign-born population - Afghanistan (%)
Place of birth for the foreign-born population - Bangladesh (%)
Place of birth for the foreign-born population - India (%)
Place of birth for the foreign-born population - Iran (%)
Place of birth for the foreign-born population - Kazakhstan (%)
Place of birth for the foreign-born population - Nepal (%)
Place of birth for the foreign-born population - Pakistan (%)
Place of birth for the foreign-born population - Sri Lanka (%)
Place of birth for the foreign-born population - Uzbekistan (%)
Place of birth for the foreign-born population - Other South Central Asia (%)
Place of birth for the foreign-born population - Burma (%)
Place of birth for the foreign-born population - Cambodia (%)
Place of birth for the foreign-born population - Indonesia (%)
Place of birth for the foreign-born population - Laos (%)
Place of birth for the foreign-born population - Malaysia (%)
Place of birth for the foreign-born population - Philippines (%)
Place of birth for the foreign-born population - Singapore (%)
Place of birth for the foreign-born population - Thailand (%)
Place of birth for the foreign-born population - Vietnam (%)
Place of birth for the foreign-born population - Other South Eastern Asia (%)
Place of birth for the foreign-born population - Armenia (%)
Place of birth for the foreign-born population - Iraq (%)
Place of birth for the foreign-born population - Israel (%)
Place of birth for the foreign-born population - Jordan (%)
Place of birth for the foreign-born population - Kuwait (%)
Place of birth for the foreign-born population - Lebanon (%)
Place of birth for the foreign-born population - Saudi Arabia (%)
Place of birth for the foreign-born population - Syria (%)
Place of birth for the foreign-born population - Turkey (%)
Place of birth for the foreign-born population - Yemen (%)
Place of birth for the foreign-born population - Other Western Asia (%)
Place of birth for the foreign-born population - Eritrea (%)
Place of birth for the foreign-born population - Ethiopia (%)
Place of birth for the foreign-born population - Kenya (%)
Place of birth for the foreign-born population - Somalia (%)
Place of birth for the foreign-born population - Uganda (%)
Place of birth for the foreign-born population - Zimbabwe (%)
Place of birth for the foreign-born population - Other Eastern Africa (%)
Place of birth for the foreign-born population - Cameroon (%)
Place of birth for the foreign-born population - Congo (%)
Place of birth for the foreign-born population - Democratic Republic of Congo (Zaire) (%)
Place of birth for the foreign-born population - Other Middle Africa (%)
Place of birth for the foreign-born population - Egypt (%)
Place of birth for the foreign-born population - Morocco (%)
Place of birth for the foreign-born population - Sudan (%)
Place of birth for the foreign-born population - Other Northern Africa (%)
Place of birth for the foreign-born population - South Africa (%)
Place of birth for the foreign-born population - Other Southern Africa (%)
Place of birth for the foreign-born population - Cabo Verde (%)
Place of birth for the foreign-born population - Ghana (%)
Place of birth for the foreign-born population - Liberia (%)
Place of birth for the foreign-born population - Nigeria (%)
Place of birth for the foreign-born population - Senegal (%)
Place of birth for the foreign-born population - Sierra Leone (%)
Place of birth for the foreign-born population - Other Western Africa (%)
Place of birth for the foreign-born population - Australia (%)
Place of birth for the foreign-born population - New Zealand (%)
Place of birth for the foreign-born population - Fiji (%)
Place of birth for the foreign-born population - Micronesia (%)
Place of birth for the foreign-born population - Bahamas (%)
Place of birth for the foreign-born population - Barbados (%)
Place of birth for the foreign-born population - Cuba (%)
Place of birth for the foreign-born population - Dominica (%)
Place of birth for the foreign-born population - Dominican Republic (%)
Place of birth for the foreign-born population - Grenada (%)
Place of birth for the foreign-born population - Haiti (%)
Place of birth for the foreign-born population - Jamaica (%)
Place of birth for the foreign-born population - St. Vincent and the Grenadines (%)
Place of birth for the foreign-born population - Trinidad and Tobago (%)
Place of birth for the foreign-born population - West Indies (%)
Place of birth for the foreign-born population - Other Caribbean (%)
Place of birth for the foreign-born population - Belize (%)
Place of birth for the foreign-born population - Costa Rica (%)
Place of birth for the foreign-born population - El Salvador (%)
Place of birth for the foreign-born population - Guatemala (%)
Place of birth for the foreign-born population - Honduras (%)
Place of birth for the foreign-born population - Mexico (%)
Place of birth for the foreign-born population - Nicaragua (%)
Place of birth for the foreign-born population - Panama (%)
Place of birth for the foreign-born population - Other Central America (%)
Place of birth for the foreign-born population - Argentina (%)
Place of birth for the foreign-born population - Bolivia (%)
Place of birth for the foreign-born population - Brazil (%)
Place of birth for the foreign-born population - Chile (%)
Place of birth for the foreign-born population - Colombia (%)
Place of birth for the foreign-born population - Ecuador (%)
Place of birth for the foreign-born population - Guyana (%)
Place of birth for the foreign-born population - Peru (%)
Place of birth for the foreign-born population - Uruguay (%)
Place of birth for the foreign-born population - Venezuela (%)
Place of birth for the foreign-born population - Other South America (%)
Place of birth for the foreign-born population - Canada (%)
Place of birth for the foreign-born population - Other Northern America (%)
Place of birth for the foreign-born population - Other (%)
According to 2022 data, the most numerous races in Lavon, TX are Hispanic (988 residents), White alone (2,664 residents), and Black alone (918 residents). 86.5% of Lavon residents speak English at home.
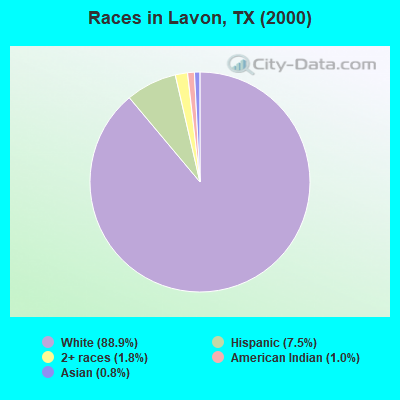
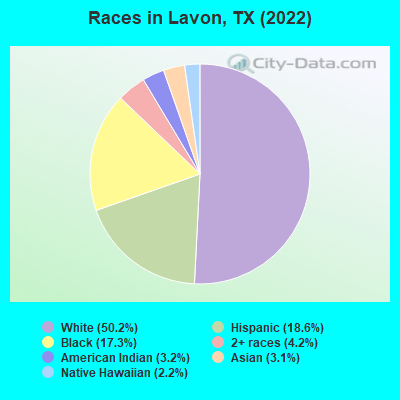
Race distribution in Lavon
2000 2022
10,933,313 52.4% White alone 6,669,666 32.0% Hispanic 2,364,255 11.3% Black alone 554,445 2.7% Asian alone 230,567 1.1% Two or more races 68,859 0.3% American Indian alone 19,958 0.10% Other race alone 10,757 0.05% Native Hawaiian and Other
12,070,642 40.2% Hispanic 11,683,430 38.9% White alone 3,508,706 11.7% Black alone 1,608,173 5.4% Asian alone 956,560 3.2% Two or more races 125,763 0.4% Other race alone 47,023 0.2% American Indian alone 29,275 0.10% Native Hawaiian and Other
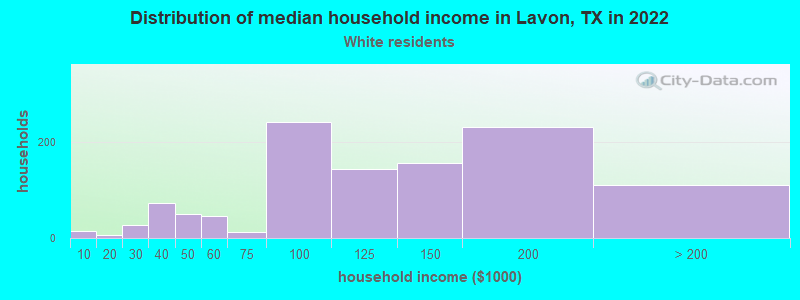
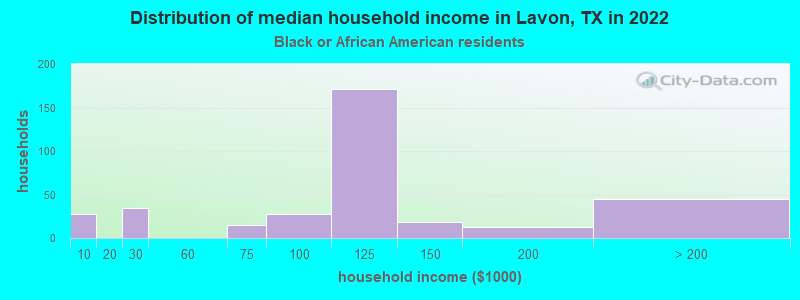
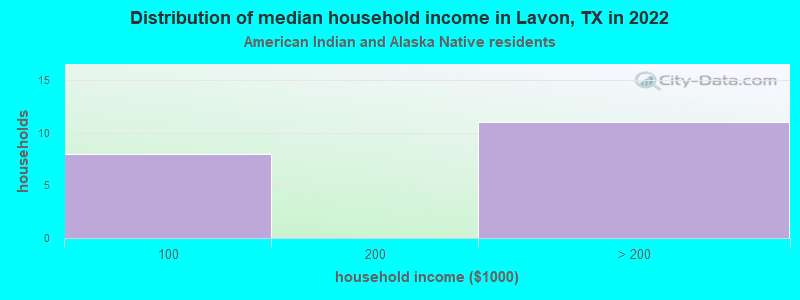
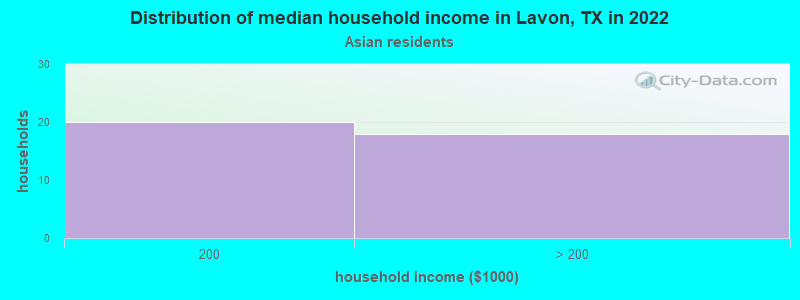
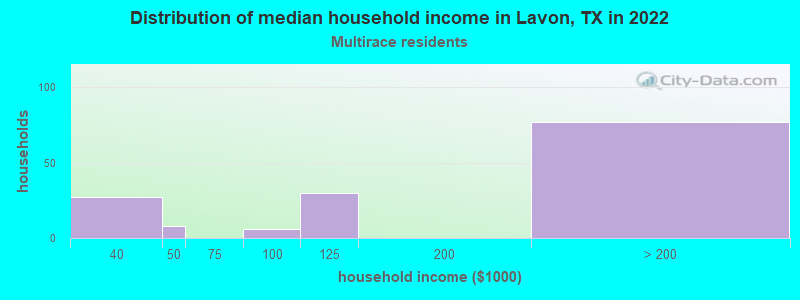
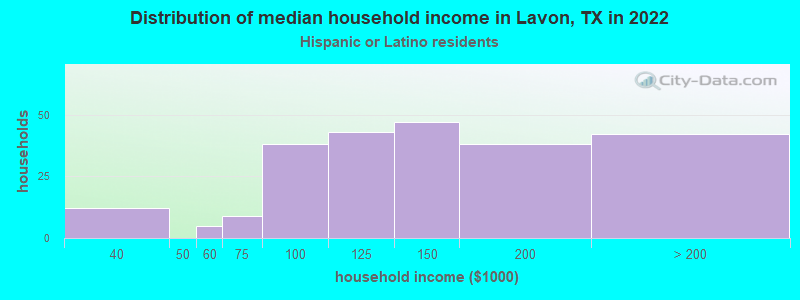
Income and house value in Lavon Median household income in 2022 $113,863 White non-Hispanic householders$116,967 Black householders$197,664 Asian householders$142,473 Hispanic or Latino race householdersMedian 2022 house value $368,164 White Non-Hispanic householders$478,023 Some other race householders$478,023 Hispanic or Latino householders
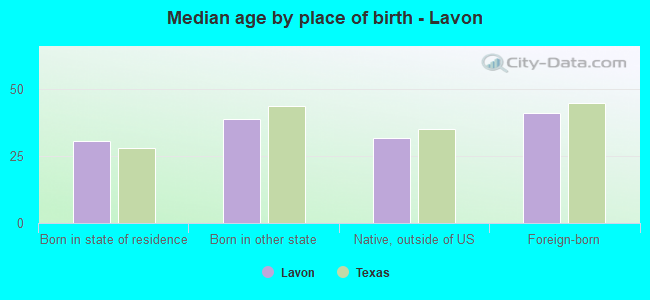
Median age by race in Lavon
36.8 Median age for White residents36.7 35.8 33.8 Median age for Black or African American residents33.2 35.3 19.7 Median age for American Indian / Alaska Native residents-724,137,930.3 17.6 31.1 Median age for Asian residents3.9 32.1 -819,226,749.4 Median age for Native Hawaiian / Pacific Islander residents-770,894,787.8 -577,777,777.2 -683,281,411.6 Median age for Other race residents-691,903,259.0 -670,769,230.1 22.2 Median age for Two or more races residents20.4 23.4 36.7 Median age for White alone residents36.5 37.1 22.5 Median age for Hispanic or Latino residents17.1 26.9
Owner/renter occupied households by race in Lavon
House owners and renters - White residents 940 83.8% Owner occupied182 16.2% Renter occupiedHouse owners and renters - Black or African American residents 340 100.0% Owner occupiedHouse owners and renters - American Indian / Alaska Native residents 4 100.0% Owner occupiedHouse owners and renters - Asian residents 36 100.0% Owner occupiedHouse owners and renters - Native Hawaiian / Pacific Islander residents 113 100.0% Owner occupiedHouse owners and renters - Two or more races residents 137 100.0% Owner occupiedHouse owners and renters - White alone residents 806 81.4% Owner occupied184 18.6% Renter occupiedHouse owners and renters - Hispanic or Latino residents 220 100.0% Owner occupied
Language usage in Lavon
English speakers - Total 86.5% of residents of Lavon speak English at home.
8.1% of residents speak Spanish at home 384 96.0% Speak English very well16 4.0% Speak English less than very well4.8% of residents speak other language at home 179 75.8% Speak English very well57 24.2% Speak English less than very well
English speakers - Born in the United States 94.9% of residents of Lavon speak English at home.
4.2% of residents speak Spanish at home 67 100.0% Speak English very well
English speakers - Native, born elsewhere 90.0% of residents of Lavon speak English at home.
6.6% of residents speak other language at home 17 100.0% Speak English very well
English speakers - Foreign-born 21.0% of residents of Lavon speak English at home.
46.7% of residents speak Spanish at home 195 92.4% Speak English very well16 7.6% Speak English less than very well35.6% of residents speak other language at home 104 64.6% Speak English very well57 35.4% Speak English less than very well
White (Caucasian) - Speak only English Native:
92.2% (2,560)Foreign-born:
10.1% (17)
White (Caucasian) - Speak another language Native:
7.6% (210)Foreign-born:
88.2% (146)
Black or African American - Speak only English Native:
99.0% (837)Foreign-born:
17.3% (14)
Black or African American - Speak another language Native:
1.4% (12)Foreign-born:
83.7% (70)
American Indian / Alaska Native - Speak only English Native:
100.0% (134)Foreign-born:
100.0% (48)
Asian - Speak only English Native:
97.1% (32)Foreign-born:
11.8% (9)
Two or more races - Speak only English Native:
94.6% (504)Foreign-born:
26.8% (8)
Two or more races - Speak another language Native:
4.3% (23)Foreign-born:
72.5% (21)
White alone - Speak only English Native:
97.3% (2,406)Foreign-born:
45.2% (16)
White alone - Speak another language Native:
2.7% (67)Foreign-born:
52.9% (19)
Hispanic or Latino - Speak another language Native:
27.5% (199)Foreign-born:
98.9% (191)
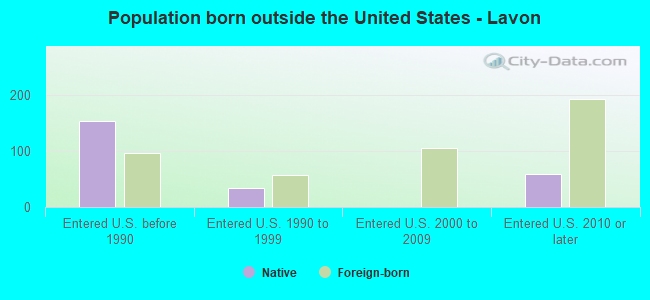
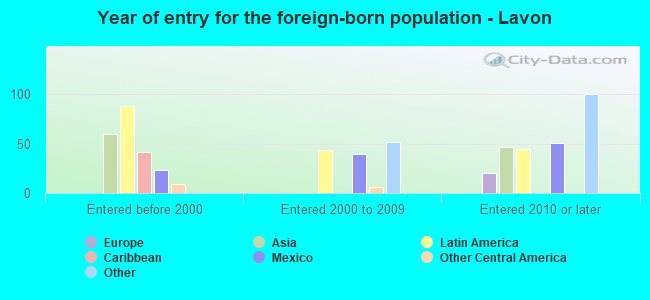
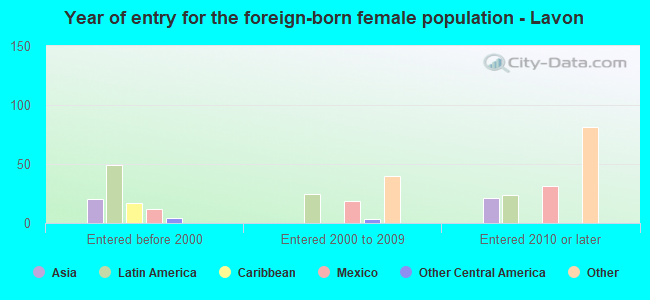
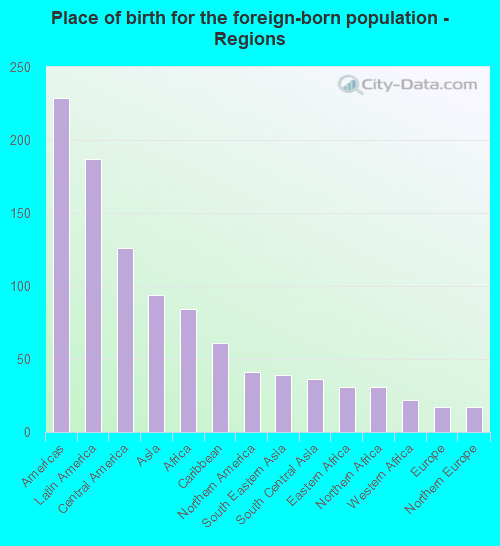
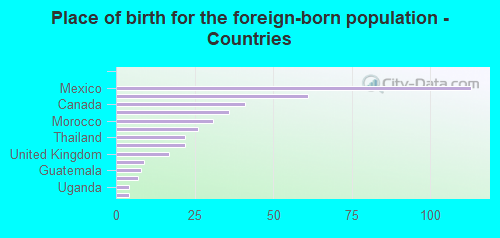
Foreign-born residents in Lavon
Marital status for residents in Lavon Marital status - White (Caucasian) population 15 years and over
Males 23.9% Never married63.4% Now married0.0% Separated1.6% Widowed11.1% DivorcedFemales 23.3% Never married55.0% Now married0.0% Separated7.6% Widowed14.1% DivorcedWomen who gave birth in the past 12 months Now married:
75.4% (48)Unmarried:
24.6% (16)
Women who did not give birth in the past 12 months Now married:
48.5% (362)Unmarried:
51.5% (384)
Marital status - Black or African American population 15 years and over
Males 15.8% Never married75.5% Now married0.0% Separated0.0% Widowed8.6% DivorcedFemales 13.4% Never married71.7% Now married0.0% Separated0.0% Widowed15.0% DivorcedWomen who did not give birth in the past 12 months Now married:
79.8% (196)Unmarried:
20.2% (50)
Marital status - Asian population 15 years and over
Males 25.0% Never married75.0% Now married0.0% Separated0.0% Widowed0.0% DivorcedFemales 0.0% Never married87.0% Now married0.0% Separated13.0% Widowed0.0% DivorcedWomen who did not give birth in the past 12 months Now married:
100.0% (37)Unmarried:
0.0% (0)
Marital status - Other race population 15 years and over
Males 0.0% Never married100.0% Now married0.0% Separated0.0% Widowed0.0% DivorcedFemales 0.0% Never married100.0% Now married0.0% Separated0.0% Widowed0.0% DivorcedWomen who did not give birth in the past 12 months Now married:
100.0% (15)Unmarried:
0.0% (0)
Marital status - Two or more races population 15 years and over
Males 36.9% Never married63.1% Now married0.0% Separated0.0% Widowed0.0% DivorcedFemales 42.2% Never married55.1% Now married0.0% Separated0.0% Widowed2.7% DivorcedWomen who gave birth in the past 12 months Now married:
100.0% (35)Unmarried:
0.0% (0)
Women who did not give birth in the past 12 months Now married:
38.1% (67)Unmarried:
61.9% (108)
Marital status - White alone, not Hispanic / Latino population 15 years and over
Males 22.5% Never married64.8% Now married0.0% Separated1.9% Widowed10.8% DivorcedFemales 21.4% Never married56.2% Now married0.0% Separated8.9% Widowed13.4% DivorcedWomen who gave birth in the past 12 months Now married:
100.0% (50)Unmarried:
0.0% (0)
Women who did not give birth in the past 12 months Now married:
51.5% (341)Unmarried:
48.5% (320)
Marital status - Hispanic or Latino population 15 years and over
Males 36.5% Never married54.1% Now married0.0% Separated0.0% Widowed9.4% DivorcedFemales 34.6% Never married55.7% Now married0.0% Separated0.0% Widowed9.7% DivorcedWomen who gave birth in the past 12 months Now married:
62.8% (30)Unmarried:
37.2% (17)
Women who did not give birth in the past 12 months Now married:
38.3% (90)Unmarried:
61.7% (144)
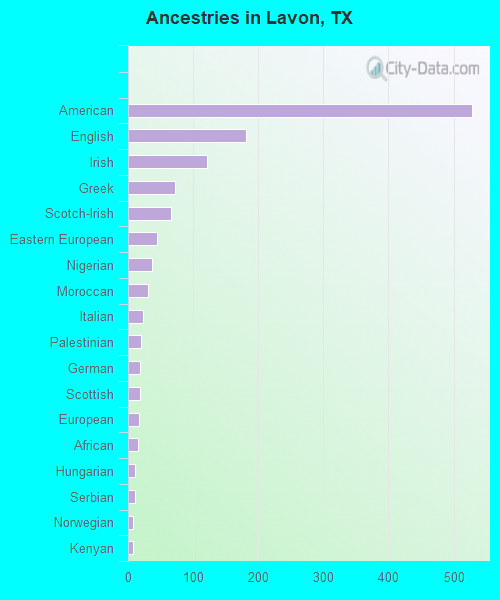
Ancestries in Lavon
528 20.8% American181 7.1% English121 4.8% Irish72 2.8% Greek66 2.6% Scotch-Irish45 1.8% Eastern European37 1.5% Nigerian30 1.2% Moroccan23 0.9% Italian20 0.8% Palestinian18 0.7% German18 0.7% Scottish17 0.7% European16 0.6% African10 0.4% Hungarian10 0.4% Serbian7 0.3% Norwegian7 0.3% Kenyan3 0.1% Polish
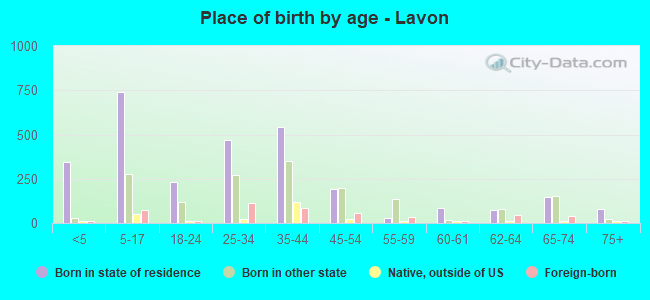
Children Nativity (place of birth) in Lavon
Children under 6 years - Living with two parents Both parents native 323 100.0% NativeBoth parents foreign-born 67 100.0% NativeOne native, one foreign-born parent 38 100.0% NativeChildren under 6 years - Living with one parent Native parent 45 100.0% NativeForeign-born parent 13 100.0% NativeChildren 6 to 17 years - Living with two parents Both parents native 400 100.0% Native0 0.0% Foreign-bornBoth parents foreign-born 14 100.0% Foreign-bornOne native, one foreign-born parent 165 100.0% NativeChildren 6 to 17 years - Living with one parent Native parent 135 100.0% NativeForeign-born parent 27 47.2% Native30 52.8% Foreign-born
Grandparents responsible for own grandchildren in Lavon
Grandparents (30 to 59 years) White / Caucasian 35 100.0% Not responsible for grandchildrenBlack or African American 12 100.0% Not responsible for grandchildrenTwo or more races 2 100.0% Not responsible for grandchildrenWhite alone, not Hispanic / Latino 34 100.0% Not responsible for grandchildren
Grandparents (60 years and over) White / Caucasian 27 100.0% Not responsible for grandchildrenWhite alone, not Hispanic / Latino 22 100.0% Not responsible for grandchildren