Races in Lexington, North Carolina (NC) Detailed Stats
Data:
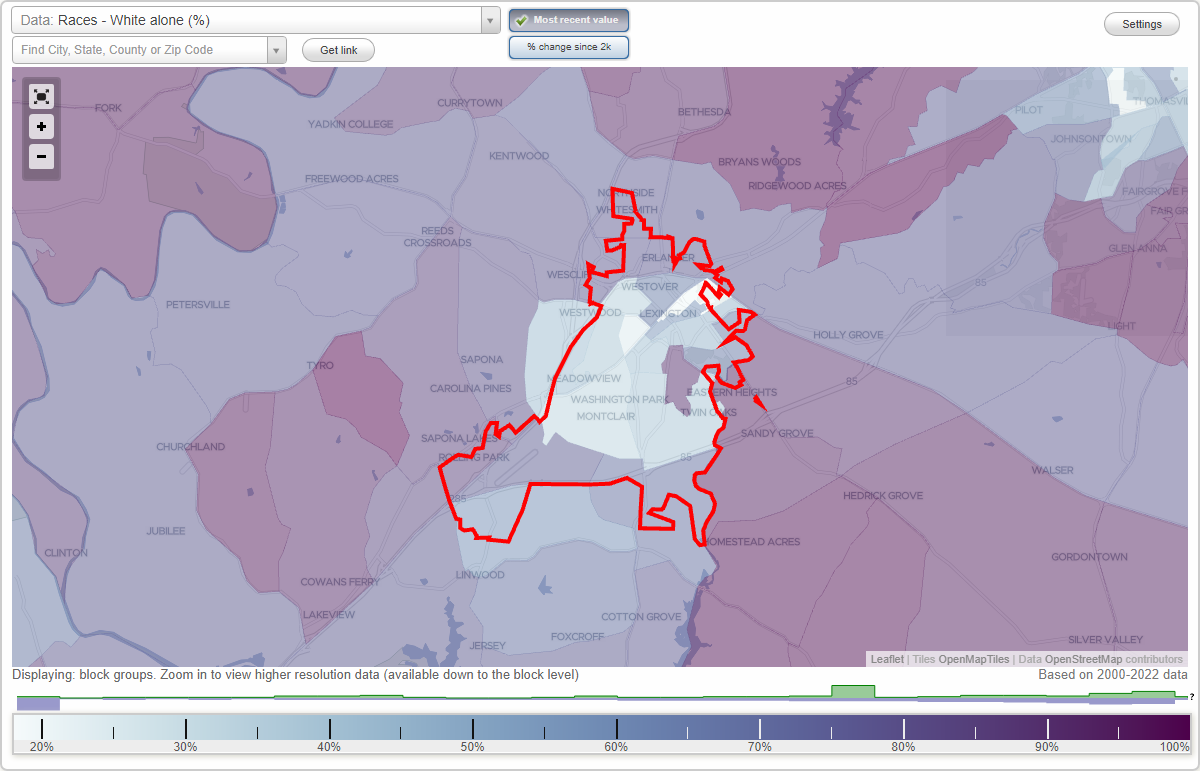
Races - White alone (%)
Races - White alone (% change since 2000)
Races - Black alone (%)
Races - Black alone (% change since 2000)
Races - American Indian alone (%)
Races - American Indian alone (% change since 2000)
Races - Asian alone (%)
Races - Asian alone (% change since 2000)
Races - Hispanic (%)
Races - Hispanic (% change since 2000)
Races - Native Hawaiian and Other Pacific Islander alone (%)
Races - Native Hawaiian and Other Pacific Islander alone (% change since 2000)
Races - Two or more races(%)
Races - Two or more races(% change since 2000)
Races - Other race alone (%)
Races - Other race alone (% change since 2000)
Racial diversity
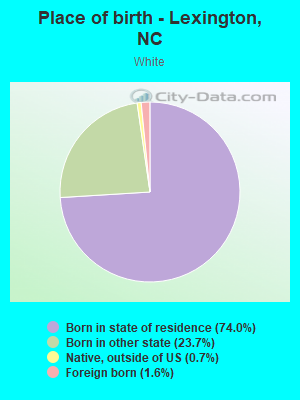
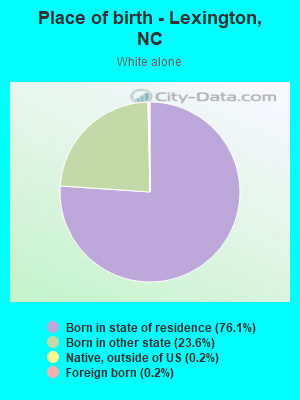
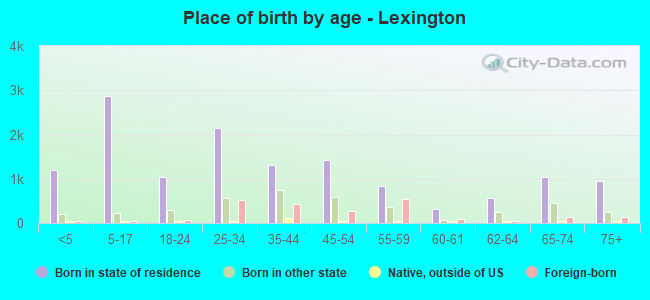
Place of birth - Born in state of residence (%)
Place of birth - Born in state of residence (%) - White
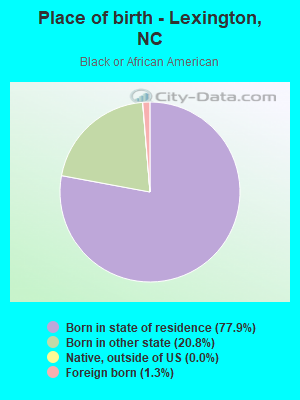
Place of birth - Born in state of residence (%) - Black or African American
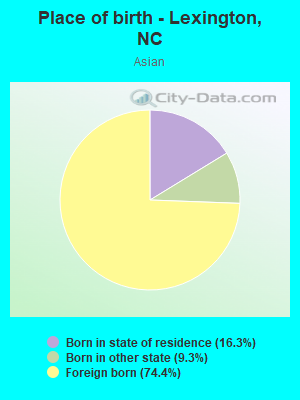
Place of birth - Born in state of residence (%) - Asian
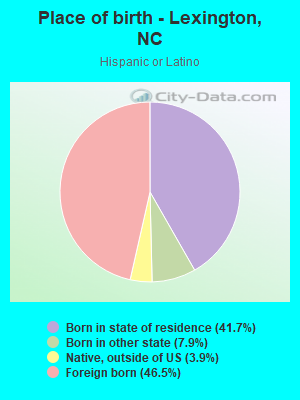
Place of birth - Born in state of residence (%) - Hispanic or Latino
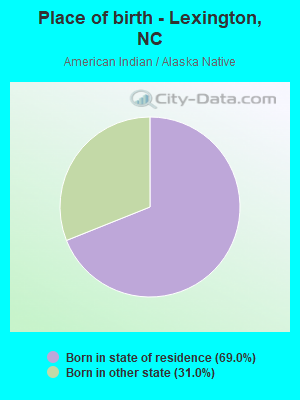
Place of birth - Born in state of residence (%) - American Indian and Alaska Native
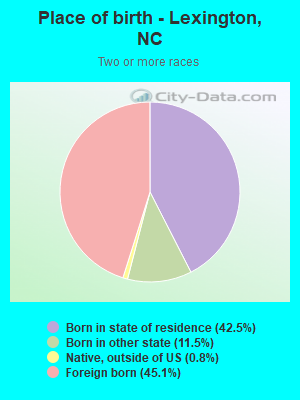
Place of birth - Born in state of residence (%) - Multirace
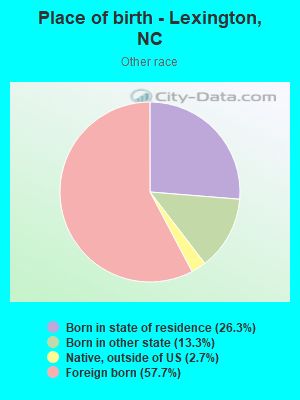
Place of birth - Born in state of residence (%) - Other Race
Place of birth - Born in other state (%)
Place of birth - Born in other state (%) - White
Place of birth - Born in other state (%) - Black or African American
Place of birth - Born in other state (%) - Asian
Place of birth - Born in other state (%) - Hispanic or Latino
Place of birth - Born in other state (%) - American Indian and Alaska Native
Place of birth - Born in other state (%) - Multirace
Place of birth - Born in other state (%) - Other Race
Place of birth - Native, outside of US (%)
Place of birth - Native, outside of US (%) - White
Place of birth - Native, outside of US (%) - Black or African American
Place of birth - Native, outside of US (%) - Asian
Place of birth - Native, outside of US (%) - Hispanic or Latino
Place of birth - Native, outside of US (%) - American Indian and Alaska Native
Place of birth - Native, outside of US (%) - Multirace
Place of birth - Native, outside of US (%) - Other Race
Place of birth - Foreign born (%)
Place of birth - Foreign born (%) - White
Place of birth - Foreign born (%) - Black or African American
Place of birth - Foreign born (%) - Asian
Place of birth - Foreign born (%) - Hispanic or Latino
Place of birth - Foreign born (%) - American Indian and Alaska Native
Place of birth - Foreign born (%) - Multirace
Place of birth - Foreign born (%) - Other Race
Residents speaking English at home (%)
Residents speaking English at home - Born in the United States (%)
Residents speaking English at home - Native, born elsewhere (%)
Residents speaking English at home - Foreign born (%)
Residents speaking Spanish at home (%)
Residents speaking Spanish at home - Born in the United States (%)
Residents speaking Spanish at home - Native, born elsewhere (%)
Residents speaking Spanish at home - Foreign born (%)
Residents speaking other language at home (%)
Residents speaking other language at home - Born in the United States (%)
Residents speaking other language at home - Native, born elsewhere (%)
Residents speaking other language at home - Foreign born (%)
Marital status - Never married (%)
Marital status - Now married (%)
Marital status - Separated (%)
Marital status - Widowed (%)
Marital status - Divorced (%)
Ancestries Reported - Arab (%)
Ancestries Reported - Czech (%)
Ancestries Reported - Danish (%)
Ancestries Reported - Dutch (%)
Ancestries Reported - English (%)
Ancestries Reported - French (%)
Ancestries Reported - French Canadian (%)
Ancestries Reported - German (%)
Ancestries Reported - Greek (%)
Ancestries Reported - Hungarian (%)
Ancestries Reported - Irish (%)
Ancestries Reported - Italian (%)
Ancestries Reported - Lithuanian (%)
Ancestries Reported - Norwegian (%)
Ancestries Reported - Polish (%)
Ancestries Reported - Portuguese (%)
Ancestries Reported - Russian (%)
Ancestries Reported - Scotch-Irish (%)
Ancestries Reported - Scottish (%)
Ancestries Reported - Slovak (%)
Ancestries Reported - Subsaharan African (%)
Ancestries Reported - Swedish (%)
Ancestries Reported - Swiss (%)
Ancestries Reported - Ukrainian (%)
Ancestries Reported - United States (%)
Ancestries Reported - Welsh (%)
Ancestries Reported - West Indian (%)
Ancestries Reported - Other (%)
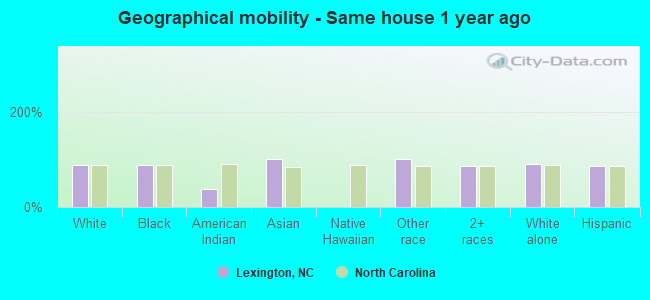
Geographical mobility - Same house 1 year ago (%)
Geographical mobility - Same house 1 year ago (%) - White
Geographical mobility - Same house 1 year ago (%) - Black or African American
Geographical mobility - Same house 1 year ago (%) - Asian
Geographical mobility - Same house 1 year ago (%) - Hispanic or Latino
Geographical mobility - Same house 1 year ago (%) - American Indian and Alaska Native
Geographical mobility - Same house 1 year ago (%) - Multirace
Geographical mobility - Same house 1 year ago (%) - Other Race
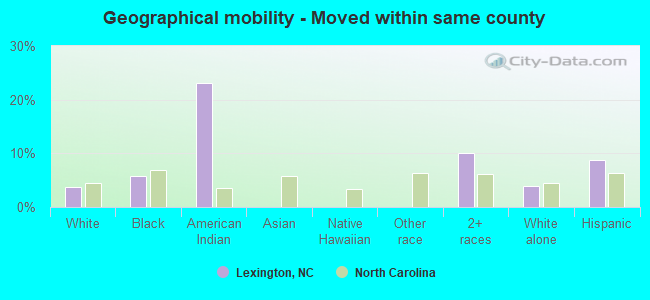
Geographical mobility - Moved within same county (%)
Geographical mobility - Moved within same county (%) - White
Geographical mobility - Moved within same county (%) - Black or African American
Geographical mobility - Moved within same county (%) - Asian
Geographical mobility - Moved within same county (%) - Hispanic or Latino
Geographical mobility - Moved within same county (%) - American Indian and Alaska Native
Geographical mobility - Moved within same county (%) - Multirace
Geographical mobility - Moved within same county (%) - Other Race
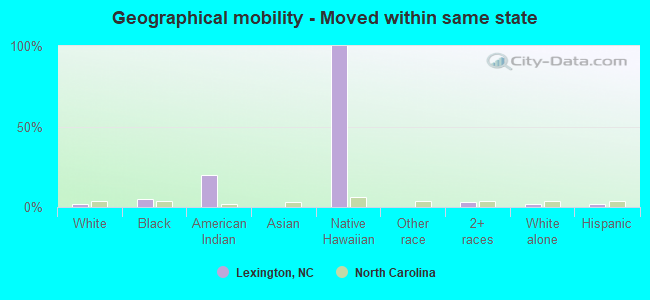
Geographical mobility - Moved from different county within same state (%)
Geographical mobility - Moved from different county within same state (%) - White
Geographical mobility - Moved from different county within same state (%) - Black or African American
Geographical mobility - Moved from different county within same state (%) - Asian
Geographical mobility - Moved from different county within same state (%) - Hispanic or Latino
Geographical mobility - Moved from different county within same state (%) - American Indian and Alaska Native
Geographical mobility - Moved from different county within same state (%) - Multirace
Geographical mobility - Moved from different county within same state (%) - Other Race
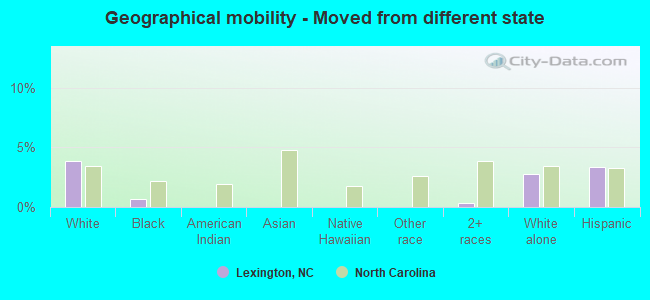
Geographical mobility - Moved from different state (%)
Geographical mobility - Moved from different state (%) - White
Geographical mobility - Moved from different state (%) - Black or African American
Geographical mobility - Moved from different state (%) - Asian
Geographical mobility - Moved from different state (%) - Hispanic or Latino
Geographical mobility - Moved from different state (%) - American Indian and Alaska Native
Geographical mobility - Moved from different state (%) - Multirace
Geographical mobility - Moved from different state (%) - Other Race
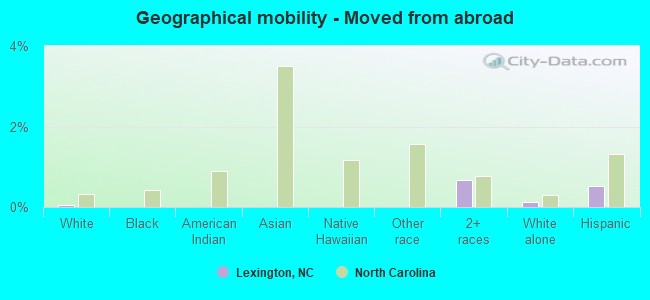
Geographical mobility - Moved from abroad (%)
Geographical mobility - Moved from abroad (%) - White
Geographical mobility - Moved from abroad (%) - Black or African American
Geographical mobility - Moved from abroad (%) - Asian
Geographical mobility - Moved from abroad (%) - Hispanic or Latino
Geographical mobility - Moved from abroad (%) - American Indian and Alaska Native
Geographical mobility - Moved from abroad (%) - Multirace
Geographical mobility - Moved from abroad (%) - Other Race
Place of birth for the foreign-born population - Ireland (%)
Place of birth for the foreign-born population - Denmark (%)
Place of birth for the foreign-born population - Norway (%)
Place of birth for the foreign-born population - Sweden (%)
Place of birth for the foreign-born population - United Kingdom (%)
Place of birth for the foreign-born population - England (%)
Place of birth for the foreign-born population - Scotland (%)
Place of birth for the foreign-born population - Other Northern Europe (%)
Place of birth for the foreign-born population - Austria (%)
Place of birth for the foreign-born population - Belgium (%)
Place of birth for the foreign-born population - France (%)
Place of birth for the foreign-born population - Germany (%)
Place of birth for the foreign-born population - Netherlands (%)
Place of birth for the foreign-born population - Switzerland (%)
Place of birth for the foreign-born population - Other Western Europe (%)
Place of birth for the foreign-born population - Greece (%)
Place of birth for the foreign-born population - Italy (%)
Place of birth for the foreign-born population - Portugal (%)
Place of birth for the foreign-born population - Spain (%)
Place of birth for the foreign-born population - Other Southern Europe (%)
Place of birth for the foreign-born population - Albania (%)
Place of birth for the foreign-born population - Belarus (%)
Place of birth for the foreign-born population - Bosnia and Herzegovina (%)
Place of birth for the foreign-born population - Bulgaria (%)
Place of birth for the foreign-born population - Croatia (%)
Place of birth for the foreign-born population - Czechoslovakia (%)
Place of birth for the foreign-born population - Hungary (%)
Place of birth for the foreign-born population - Latvia (%)
Place of birth for the foreign-born population - Lithuania (%)
Place of birth for the foreign-born population - North Macedonia (Macedonia) (%)
Place of birth for the foreign-born population - Moldova (%)
Place of birth for the foreign-born population - Poland (%)
Place of birth for the foreign-born population - Romania (%)
Place of birth for the foreign-born population - Russia (%)
Place of birth for the foreign-born population - Serbia (%)
Place of birth for the foreign-born population - Ukraine (%)
Place of birth for the foreign-born population - Other Eastern Europe (%)
Place of birth for the foreign-born population - China (%)
Place of birth for the foreign-born population - Hong Kong (%)
Place of birth for the foreign-born population - Taiwan (%)
Place of birth for the foreign-born population - Japan (%)
Place of birth for the foreign-born population - Korea (%)
Place of birth for the foreign-born population - Other Eastern Asia (%)
Place of birth for the foreign-born population - Afghanistan (%)
Place of birth for the foreign-born population - Bangladesh (%)
Place of birth for the foreign-born population - India (%)
Place of birth for the foreign-born population - Iran (%)
Place of birth for the foreign-born population - Kazakhstan (%)
Place of birth for the foreign-born population - Nepal (%)
Place of birth for the foreign-born population - Pakistan (%)
Place of birth for the foreign-born population - Sri Lanka (%)
Place of birth for the foreign-born population - Uzbekistan (%)
Place of birth for the foreign-born population - Other South Central Asia (%)
Place of birth for the foreign-born population - Burma (%)
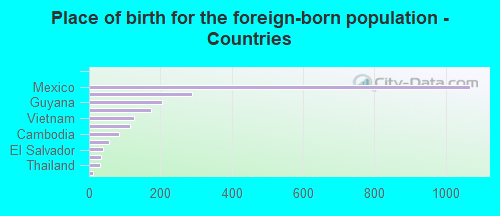
Place of birth for the foreign-born population - Cambodia (%)
Place of birth for the foreign-born population - Indonesia (%)
Place of birth for the foreign-born population - Laos (%)
Place of birth for the foreign-born population - Malaysia (%)
Place of birth for the foreign-born population - Philippines (%)
Place of birth for the foreign-born population - Singapore (%)
Place of birth for the foreign-born population - Thailand (%)
Place of birth for the foreign-born population - Vietnam (%)
Place of birth for the foreign-born population - Other South Eastern Asia (%)
Place of birth for the foreign-born population - Armenia (%)
Place of birth for the foreign-born population - Iraq (%)
Place of birth for the foreign-born population - Israel (%)
Place of birth for the foreign-born population - Jordan (%)
Place of birth for the foreign-born population - Kuwait (%)
Place of birth for the foreign-born population - Lebanon (%)
Place of birth for the foreign-born population - Saudi Arabia (%)
Place of birth for the foreign-born population - Syria (%)
Place of birth for the foreign-born population - Turkey (%)
Place of birth for the foreign-born population - Yemen (%)
Place of birth for the foreign-born population - Other Western Asia (%)
Place of birth for the foreign-born population - Eritrea (%)
Place of birth for the foreign-born population - Ethiopia (%)
Place of birth for the foreign-born population - Kenya (%)
Place of birth for the foreign-born population - Somalia (%)
Place of birth for the foreign-born population - Uganda (%)
Place of birth for the foreign-born population - Zimbabwe (%)
Place of birth for the foreign-born population - Other Eastern Africa (%)
Place of birth for the foreign-born population - Cameroon (%)
Place of birth for the foreign-born population - Congo (%)
Place of birth for the foreign-born population - Democratic Republic of Congo (Zaire) (%)
Place of birth for the foreign-born population - Other Middle Africa (%)
Place of birth for the foreign-born population - Egypt (%)
Place of birth for the foreign-born population - Morocco (%)
Place of birth for the foreign-born population - Sudan (%)
Place of birth for the foreign-born population - Other Northern Africa (%)
Place of birth for the foreign-born population - South Africa (%)
Place of birth for the foreign-born population - Other Southern Africa (%)
Place of birth for the foreign-born population - Cabo Verde (%)
Place of birth for the foreign-born population - Ghana (%)
Place of birth for the foreign-born population - Liberia (%)
Place of birth for the foreign-born population - Nigeria (%)
Place of birth for the foreign-born population - Senegal (%)
Place of birth for the foreign-born population - Sierra Leone (%)
Place of birth for the foreign-born population - Other Western Africa (%)
Place of birth for the foreign-born population - Australia (%)
Place of birth for the foreign-born population - New Zealand (%)
Place of birth for the foreign-born population - Fiji (%)
Place of birth for the foreign-born population - Micronesia (%)
Place of birth for the foreign-born population - Bahamas (%)
Place of birth for the foreign-born population - Barbados (%)
Place of birth for the foreign-born population - Cuba (%)
Place of birth for the foreign-born population - Dominica (%)
Place of birth for the foreign-born population - Dominican Republic (%)
Place of birth for the foreign-born population - Grenada (%)
Place of birth for the foreign-born population - Haiti (%)
Place of birth for the foreign-born population - Jamaica (%)
Place of birth for the foreign-born population - St. Vincent and the Grenadines (%)
Place of birth for the foreign-born population - Trinidad and Tobago (%)
Place of birth for the foreign-born population - West Indies (%)
Place of birth for the foreign-born population - Other Caribbean (%)
Place of birth for the foreign-born population - Belize (%)
Place of birth for the foreign-born population - Costa Rica (%)
Place of birth for the foreign-born population - El Salvador (%)
Place of birth for the foreign-born population - Guatemala (%)
Place of birth for the foreign-born population - Honduras (%)
Place of birth for the foreign-born population - Mexico (%)
Place of birth for the foreign-born population - Nicaragua (%)
Place of birth for the foreign-born population - Panama (%)
Place of birth for the foreign-born population - Other Central America (%)
Place of birth for the foreign-born population - Argentina (%)
Place of birth for the foreign-born population - Bolivia (%)
Place of birth for the foreign-born population - Brazil (%)
Place of birth for the foreign-born population - Chile (%)
Place of birth for the foreign-born population - Colombia (%)
Place of birth for the foreign-born population - Ecuador (%)
Place of birth for the foreign-born population - Guyana (%)
Place of birth for the foreign-born population - Peru (%)
Place of birth for the foreign-born population - Uruguay (%)
Place of birth for the foreign-born population - Venezuela (%)
Place of birth for the foreign-born population - Other South America (%)
Place of birth for the foreign-born population - Canada (%)
Place of birth for the foreign-born population - Other Northern America (%)
Place of birth for the foreign-born population - Other (%)
Latest news about races in Lexington, NC collected exclusively by city-data.com from local newspapers, TV, and radio stations
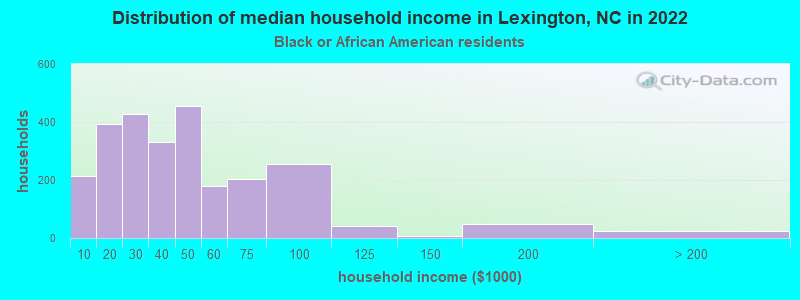
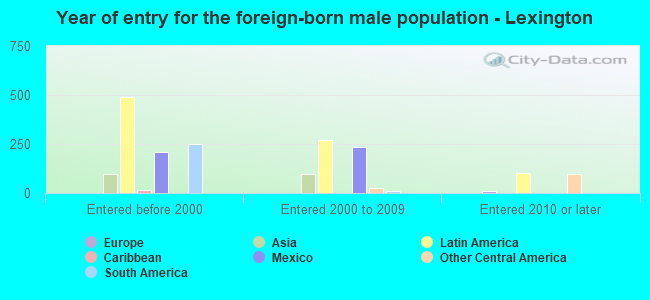
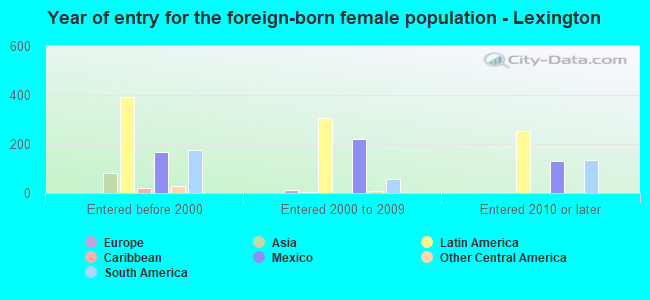
According to 2022 data, the most numerous races in Lexington, NC are White alone (8,725 residents), Black alone (6,495 residents), and Hispanic (3,500 residents). 81.9% of Lexington residents speak English at home. 11.3% of Lexington, NC residents are foreign-born (9.3% born in Latin America, 1.4% born in Asia), which is 28.9% greater than the foreign-born rate of 8.0% across the entire state of North Carolina.
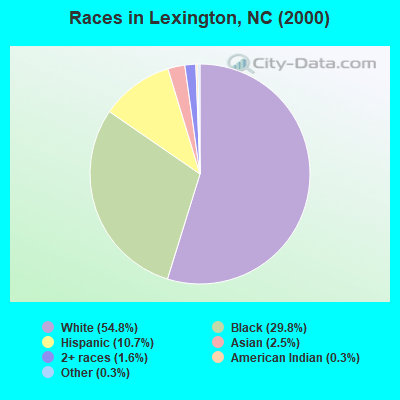
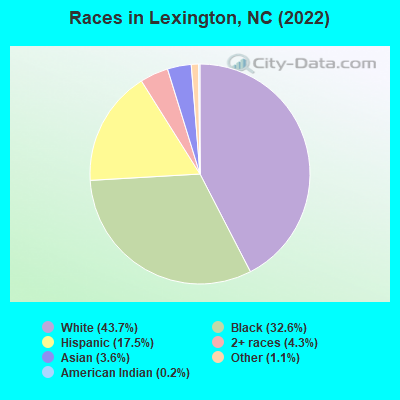
Race distribution in Lexington
2000 2022
5,647,155 70.2% White alone 1,723,301 21.4% Black alone 378,963 4.7% Hispanic 112,416 1.4% Asian alone 95,333 1.2% American Indian alone 79,965 1.0% Two or more races 9,015 0.1% Other race alone 3,165 0.04% Native Hawaiian and Other
6,497,519 60.7% White alone 2,155,650 20.1% Black alone 1,114,799 10.4% Hispanic 438,061 4.1% Two or more races 341,052 3.2% Asian alone 91,758 0.9% American Indian alone 50,180 0.5% Other race alone 9,954 0.09% Native Hawaiian and Other
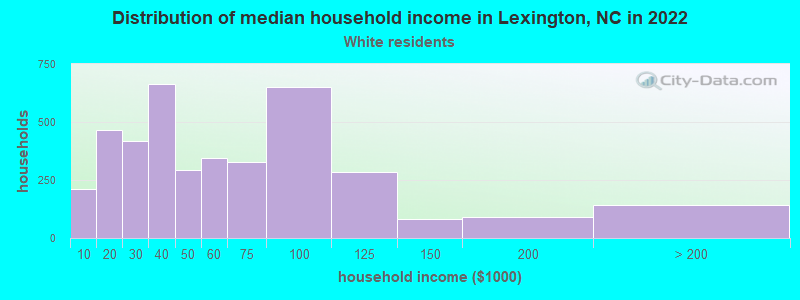
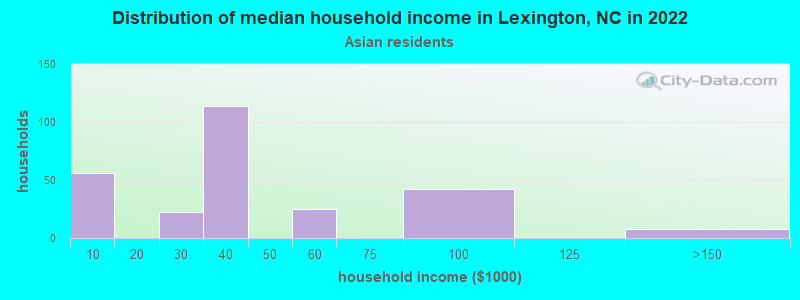
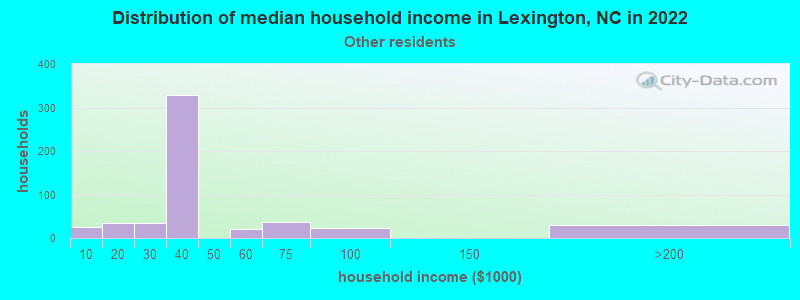
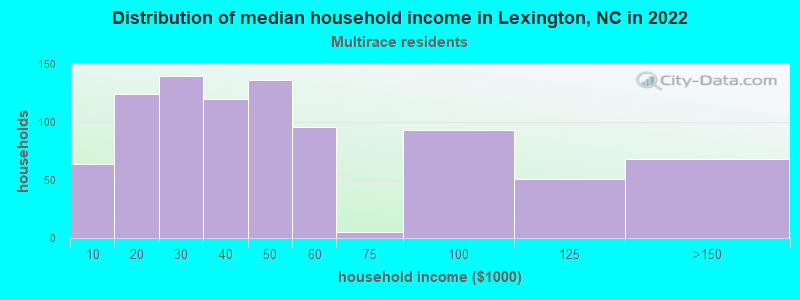
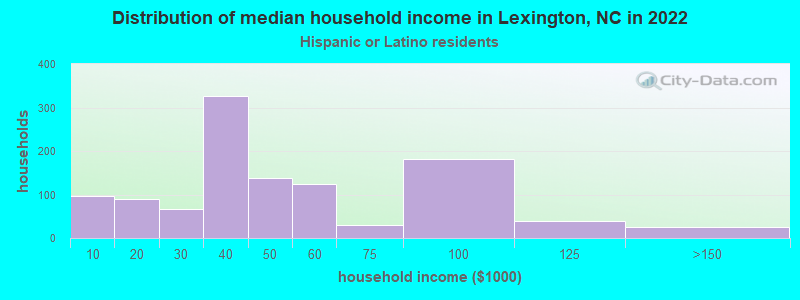
Income and house value in Lexington Median household income in 2022 $47,751 White non-Hispanic householders$45,286 Black householders$31,860 Asian householders$49,843 Some other race householders$40,181 Two or more races householders$58,400 Hispanic or Latino race householdersMedian 2022 house value $181,752 White Non-Hispanic householders$141,840 Black or African American householders$295,053 American Indian or Alaska Native householders $203,425 Asian householders$226,601 Some other race householders$186,902 Two or more races householders$124,244 Hispanic or Latino householders
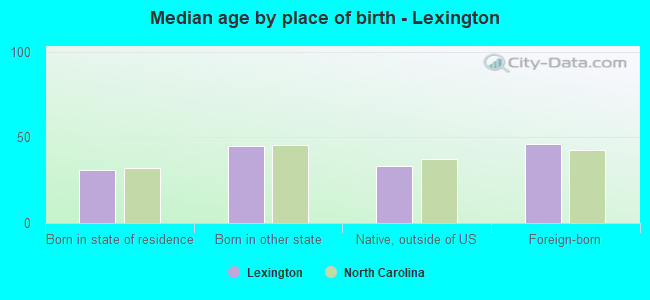
Median age by race in Lexington
43.9 Median age for White residents40.8 47.6 40.5 Median age for Black or African American residents47.5 33.4 58.3 Median age for American Indian / Alaska Native residents58.5 -682,971,013.8 28.5 Median age for Asian residents36.3 29.2 -666,666,666.0 Median age for Native Hawaiian / Pacific Islander residents-666,666,666.0 -666,666,666.0 30.6 Median age for Other race residents47.6 26.7 23.9 Median age for Two or more races residents24.9 24.4 45.2 Median age for White alone residents42.4 48.8 31.0 Median age for Hispanic or Latino residents37.2 26.3
Owner/renter occupied households by race in Lexington
House owners and renters - White residents 2,048 52.2% Owner occupied1,877 47.8% Renter occupiedHouse owners and renters - Black or African American residents 550 21.6% Owner occupied2,002 78.4% Renter occupiedHouse owners and renters - Asian residents 322 92.7% Owner occupied25 7.3% Renter occupiedHouse owners and renters - Other race residents 83 14.2% Owner occupied501 85.8% Renter occupiedHouse owners and renters - Two or more races residents 237 26.9% Owner occupied643 73.1% Renter occupiedHouse owners and renters - White alone residents 1,938 51.9% Owner occupied1,794 48.1% Renter occupiedHouse owners and renters - Hispanic or Latino residents 387 37.3% Owner occupied650 62.7% Renter occupied
Language usage in Lexington
English speakers - Total 81.9% of residents of Lexington speak English at home.
18.6% of residents speak Spanish at home 1,795 51.9% Speak English very well1,661 48.1% Speak English less than very well1.7% of residents speak other language at home 168 52.5% Speak English very well152 47.5% Speak English less than very well
English speakers - Born in the United States 90.7% of residents of Lexington speak English at home.
7.7% of residents speak Spanish at home 262 90.0% Speak English very well29 10.0% Speak English less than very well0.9% of residents speak other language at home 33 100.0% Speak English very well
English speakers - Native, born elsewhere 12.7% of residents of Lexington speak English at home.
110.6% of residents speak Spanish at home 57 36.3% Speak English very well100 63.7% Speak English less than very well
English speakers - Foreign-born 12.9% of residents of Lexington speak English at home.
78.2% of residents speak Spanish at home 341 20.5% Speak English very well1,322 79.5% Speak English less than very well12.5% of residents speak other language at home 110 41.4% Speak English very well156 58.6% Speak English less than very well
White (Caucasian) - Speak only English Native:
96.4% (8,279)Foreign-born:
19.2% (28)
White (Caucasian) - Speak another language Native:
2.7% (231)Foreign-born:
100.0% (145)
Black or African American - Speak only English Native:
98.1% (5,445)Foreign-born:
100.0% (69)
Asian - Speak only English Native:
87.7% (148)Foreign-born:
36.6% (164)
Asian - Speak another language Native:
11.6% (20)Foreign-born:
67.2% (301)
Other race - Speak only English Native:
27.2% (132)Foreign-born:
5.1% (37)
Other race - Speak another language Native:
72.7% (353)Foreign-born:
95.0% (684)
Two or more races - Speak only English Native:
45.1% (749)Foreign-born:
0.9% (15)
Two or more races - Speak another language Native:
65.0% (1,080)Foreign-born:
100.0% (1,737)
White alone - Speak only English Native:
99.1% (8,223)Foreign-born:
85.1% (13)
White alone - Speak another language Native:
0.9% (77)Foreign-born:
26.1% (4)
Hispanic or Latino - Speak only English Native:
11.2% (175)Foreign-born:
0.7% (11)
Hispanic or Latino - Speak another language Native:
100.0% (1,566)Foreign-born:
100.0% (1,593)
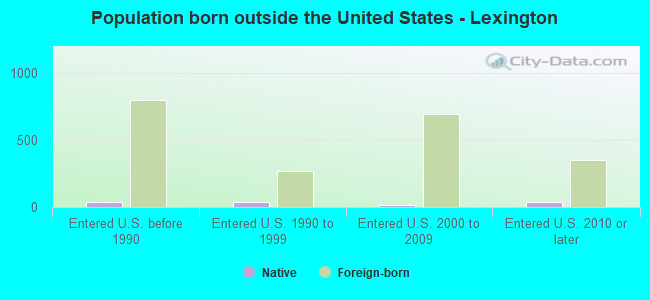
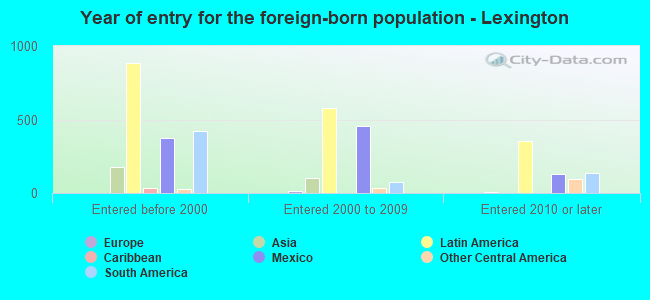
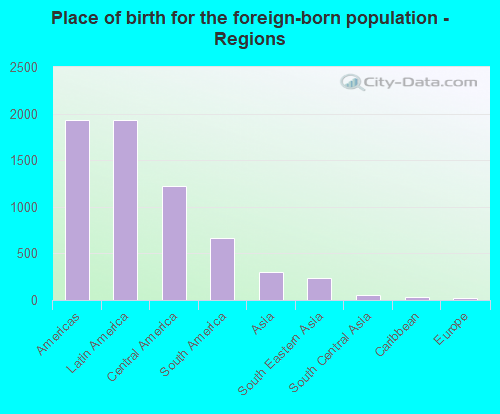
Foreign-born residents in Lexington 2,246 residents are foreign born (9.3% Latin America , 1.4% Asia ).
This city:
11.3%North Carolina:
8.3%
Marital status for residents in Lexington Marital status - White (Caucasian) population 15 years and over
Males 31.6% Never married41.9% Now married4.6% Separated4.7% Widowed17.3% DivorcedFemales 23.3% Never married46.2% Now married4.8% Separated13.4% Widowed12.3% DivorcedWomen who gave birth in the past 12 months Now married:
62.0% (127)Unmarried:
38.0% (78)
Women who did not give birth in the past 12 months Now married:
48.2% (767)Unmarried:
51.8% (824)
Marital status - Black or African American population 15 years and over
Males 43.9% Never married31.8% Now married10.0% Separated5.8% Widowed8.5% DivorcedFemales 51.5% Never married24.8% Now married4.9% Separated7.7% Widowed11.2% DivorcedWomen who gave birth in the past 12 months Now married:
0.0% (0)Unmarried:
100.0% (238)
Women who did not give birth in the past 12 months Now married:
31.3% (494)Unmarried:
68.7% (1,082)
Marital status - American Indian / Alaska Native population 15 years and over
Males 45.5% Never married18.2% Now married36.4% Separated0.0% Widowed0.0% DivorcedFemales 50.0% Never married50.0% Now married0.0% Separated0.0% Widowed0.0% DivorcedMarital status - Asian population 15 years and over
Males 64.8% Never married17.4% Now married0.0% Separated0.0% Widowed17.8% DivorcedFemales 22.0% Never married29.0% Now married34.4% Separated0.0% Widowed14.5% DivorcedWomen who did not give birth in the past 12 months Now married:
53.9% (108)Unmarried:
46.1% (92)
Marital status - Other race population 15 years and over
Males 14.1% Never married83.9% Now married2.0% Separated0.0% Widowed0.0% DivorcedFemales 48.9% Never married47.1% Now married0.0% Separated0.0% Widowed4.0% DivorcedWomen who did not give birth in the past 12 months Now married:
22.2% (99)Unmarried:
77.8% (346)
Marital status - Two or more races population 15 years and over
Males 57.8% Never married31.7% Now married1.5% Separated0.0% Widowed8.9% DivorcedFemales 41.3% Never married29.3% Now married23.1% Separated0.0% Widowed6.3% DivorcedWomen who gave birth in the past 12 months Now married:
100.0% (60)Unmarried:
0.0% (0)
Women who did not give birth in the past 12 months Now married:
41.1% (271)Unmarried:
58.9% (389)
Marital status - White alone, not Hispanic / Latino population 15 years and over
Males 32.6% Never married40.0% Now married4.9% Separated4.9% Widowed17.6% DivorcedFemales 22.0% Never married45.1% Now married5.2% Separated14.4% Widowed13.2% DivorcedWomen who gave birth in the past 12 months Now married:
60.3% (123)Unmarried:
39.7% (81)
Women who did not give birth in the past 12 months Now married:
47.2% (655)Unmarried:
52.8% (732)
Marital status - Hispanic or Latino population 15 years and over
Males 34.2% Never married61.1% Now married0.7% Separated0.0% Widowed4.0% DivorcedFemales 42.2% Never married48.8% Now married7.3% Separated0.8% Widowed0.9% DivorcedWomen who gave birth in the past 12 months Now married:
100.0% (55)Unmarried:
0.0% (0)
Women who did not give birth in the past 12 months Now married:
40.3% (375)Unmarried:
59.7% (555)
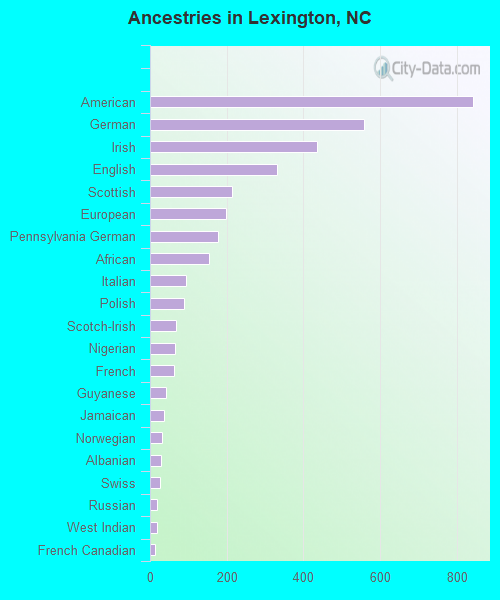
Ancestries in Lexington
842 8.7% American557 5.8% German436 4.5% Irish331 3.4% English213 2.2% Scottish199 2.1% European177 1.8% Pennsylvania German155 1.6% African94 1.0% Italian89 0.9% Polish68 0.7% Scotch-Irish64 0.7% Nigerian62 0.6% French41 0.4% Guyanese37 0.4% Jamaican30 0.3% Norwegian29 0.3% Albanian25 0.3% Swiss18 0.2% Russian18 0.2% West Indian14 0.1% French Canadian6 0.06% Portuguese4 0.04% British
Geographical mobility in Lexington Same house 1 year ago 8,193 89.0% White (Caucasian)5,818 88.7% Black or African American10 37.1% American Indian / Alaska Native755 100.0% Asian1,278 100.0% Other race2,505 84.9% Two or more races7,779 90.0% White alone, not Hispanic / Latino2,805 84.7% Hispanic or LatinoMoved within same county 344 3.7% White / Caucasian374 5.7% Black or African American6 23.1% American Indian / Alaska Native297 10.1% Two or more races341 3.9% White alone, not Hispanic / Latino289 8.7% Hispanic or LatinoMoved within same state 160 1.7% White / Caucasian299 4.6% Black or African American5 20.2% American Indian / Alaska Native9 100.0% Native Hawaiian / Pacific Islander3 0.2% Other race89 3.0% Two or more races150 1.7% White alone, not Hispanic / Latino62 1.9% Hispanic or LatinoMoved from different state 355 3.9% White / Caucasian46 0.7% Black or African American9 0.3% Two or more races237 2.7% White alone, not Hispanic / Latino112 3.4% Hispanic or LatinoMoved from abroad 6 0.1% White20 0.7% Two or more races11 0.1% White alone, not Hispanic / Latino17 0.5% Hispanic or Latino
Children Nativity (place of birth) in Lexington
Children under 6 years - Living with two parents Both parents native 459 100.0% NativeBoth parents foreign-born 42 100.0% NativeOne native, one foreign-born parent 102 100.0% NativeChildren under 6 years - Living with one parent Native parent 359 100.0% NativeForeign-born parent 574 98.8% Native7 1.2% Foreign-bornChildren 6 to 17 years - Living with two parents Both parents native 1,254 100.0% NativeBoth parents foreign-born 68 100.0% NativeOne native, one foreign-born parent 46 100.0% NativeChildren 6 to 17 years - Living with one parent Native parent 972 100.0% NativeForeign-born parent 207 50.6% Native202 49.4% Foreign-born
Grandparents responsible for own grandchildren in Lexington
Grandparents (30 to 59 years) White / Caucasian 8 12.9% Responsible for grandchildren57 87.1% Not responsible for grandchildrenBlack or African American 277 78.4% Responsible for grandchildren77 21.6% Not responsible for grandchildrenTwo or more races 47 100.0% Not responsible for grandchildrenWhite alone, not Hispanic / Latino 7 10.9% Responsible for grandchildren57 89.1% Not responsible for grandchildrenHispanic or Latino 30 43.1% Responsible for grandchildren39 56.9% Not responsible for grandchildrenGrandparents (60 years and over) White / Caucasian 25 13.4% Responsible for grandchildren161 86.6% Not responsible for grandchildrenBlack or African American 10 100.0% Not responsible for grandchildrenTwo or more races 120 100.0% Not responsible for grandchildrenWhite alone, not Hispanic / Latino 25 15.0% Responsible for grandchildren141 85.0% Not responsible for grandchildrenHispanic or Latino 81 100.0% Not responsible for grandchildren