Races in Lincoln Village, California (CA) Detailed Stats
Data:
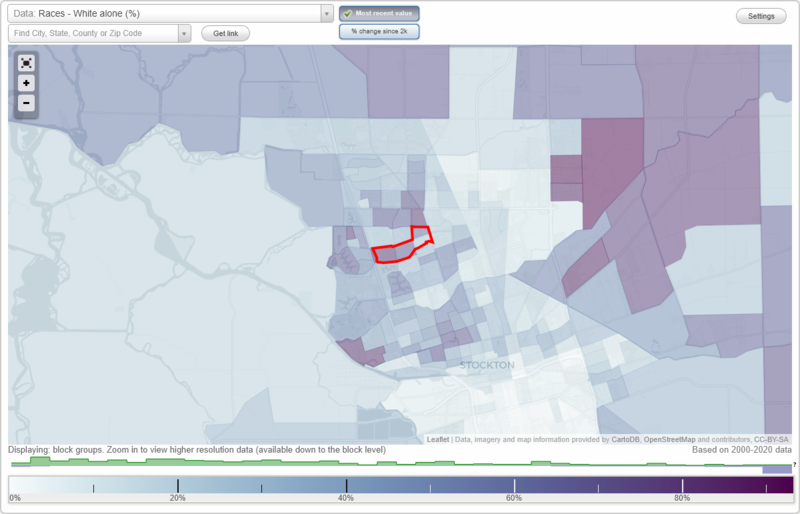
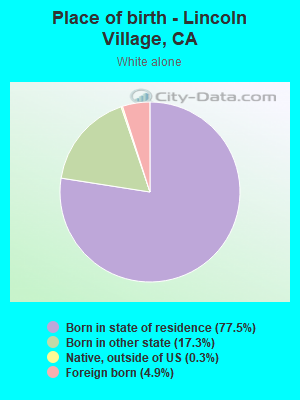
Races - White alone (%)
Races - White alone (% change since 2000)
Races - Black alone (%)
Races - Black alone (% change since 2000)
Races - American Indian alone (%)
Races - American Indian alone (% change since 2000)
Races - Asian alone (%)
Races - Asian alone (% change since 2000)
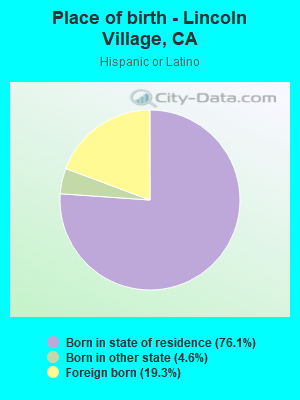
Races - Hispanic (%)
Races - Hispanic (% change since 2000)
Races - Native Hawaiian and Other Pacific Islander alone (%)
Races - Native Hawaiian and Other Pacific Islander alone (% change since 2000)
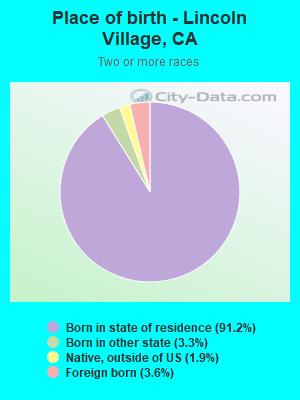
Races - Two or more races(%)
Races - Two or more races(% change since 2000)
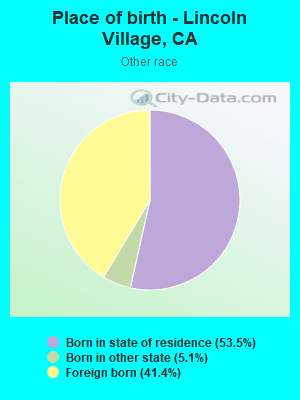
Races - Other race alone (%)
Races - Other race alone (% change since 2000)
Racial diversity
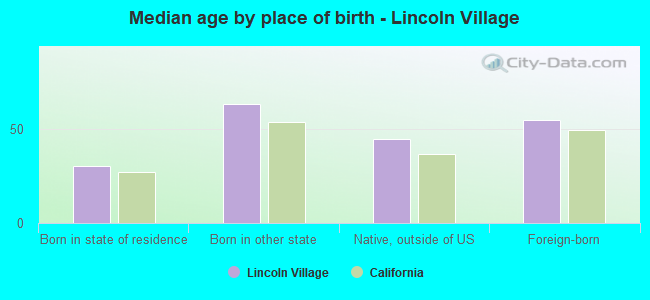
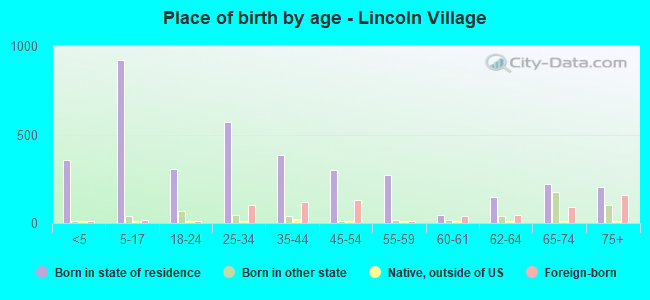
Place of birth - Born in state of residence (%)
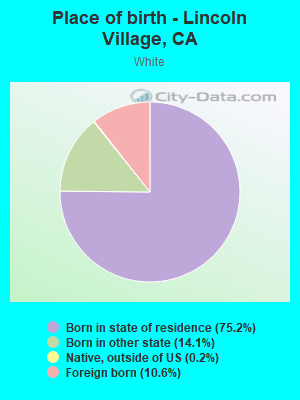
Place of birth - Born in state of residence (%) - White
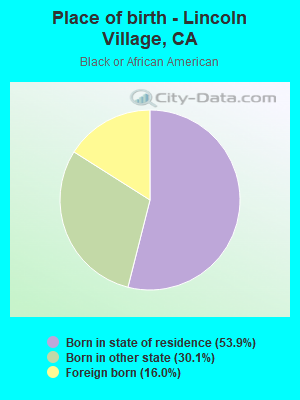
Place of birth - Born in state of residence (%) - Black or African American
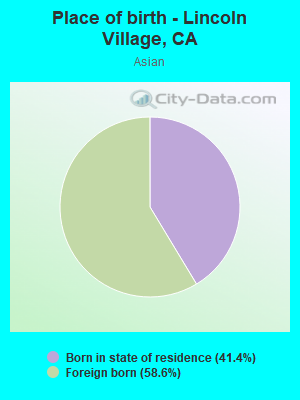
Place of birth - Born in state of residence (%) - Asian
Place of birth - Born in state of residence (%) - Hispanic or Latino
Place of birth - Born in state of residence (%) - American Indian and Alaska Native
Place of birth - Born in state of residence (%) - Multirace
Place of birth - Born in state of residence (%) - Other Race
Place of birth - Born in other state (%)
Place of birth - Born in other state (%) - White
Place of birth - Born in other state (%) - Black or African American
Place of birth - Born in other state (%) - Asian
Place of birth - Born in other state (%) - Hispanic or Latino
Place of birth - Born in other state (%) - American Indian and Alaska Native
Place of birth - Born in other state (%) - Multirace
Place of birth - Born in other state (%) - Other Race
Place of birth - Native, outside of US (%)
Place of birth - Native, outside of US (%) - White
Place of birth - Native, outside of US (%) - Black or African American
Place of birth - Native, outside of US (%) - Asian
Place of birth - Native, outside of US (%) - Hispanic or Latino
Place of birth - Native, outside of US (%) - American Indian and Alaska Native
Place of birth - Native, outside of US (%) - Multirace
Place of birth - Native, outside of US (%) - Other Race
Place of birth - Foreign born (%)
Place of birth - Foreign born (%) - White
Place of birth - Foreign born (%) - Black or African American
Place of birth - Foreign born (%) - Asian
Place of birth - Foreign born (%) - Hispanic or Latino
Place of birth - Foreign born (%) - American Indian and Alaska Native
Place of birth - Foreign born (%) - Multirace
Place of birth - Foreign born (%) - Other Race
Residents speaking English at home (%)
Residents speaking English at home - Born in the United States (%)
Residents speaking English at home - Native, born elsewhere (%)
Residents speaking English at home - Foreign born (%)
Residents speaking Spanish at home (%)
Residents speaking Spanish at home - Born in the United States (%)
Residents speaking Spanish at home - Native, born elsewhere (%)
Residents speaking Spanish at home - Foreign born (%)
Residents speaking other language at home (%)
Residents speaking other language at home - Born in the United States (%)
Residents speaking other language at home - Native, born elsewhere (%)
Residents speaking other language at home - Foreign born (%)
Marital status - Never married (%)
Marital status - Now married (%)
Marital status - Separated (%)
Marital status - Widowed (%)
Marital status - Divorced (%)
Ancestries Reported - Arab (%)
Ancestries Reported - Czech (%)
Ancestries Reported - Danish (%)
Ancestries Reported - Dutch (%)
Ancestries Reported - English (%)
Ancestries Reported - French (%)
Ancestries Reported - French Canadian (%)
Ancestries Reported - German (%)
Ancestries Reported - Greek (%)
Ancestries Reported - Hungarian (%)
Ancestries Reported - Irish (%)
Ancestries Reported - Italian (%)
Ancestries Reported - Lithuanian (%)
Ancestries Reported - Norwegian (%)
Ancestries Reported - Polish (%)
Ancestries Reported - Portuguese (%)
Ancestries Reported - Russian (%)
Ancestries Reported - Scotch-Irish (%)
Ancestries Reported - Scottish (%)
Ancestries Reported - Slovak (%)
Ancestries Reported - Subsaharan African (%)
Ancestries Reported - Swedish (%)
Ancestries Reported - Swiss (%)
Ancestries Reported - Ukrainian (%)
Ancestries Reported - United States (%)
Ancestries Reported - Welsh (%)
Ancestries Reported - West Indian (%)
Ancestries Reported - Other (%)
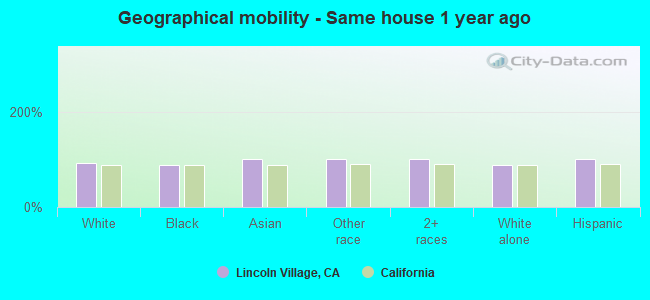
Geographical mobility - Same house 1 year ago (%)
Geographical mobility - Same house 1 year ago (%) - White
Geographical mobility - Same house 1 year ago (%) - Black or African American
Geographical mobility - Same house 1 year ago (%) - Asian
Geographical mobility - Same house 1 year ago (%) - Hispanic or Latino
Geographical mobility - Same house 1 year ago (%) - American Indian and Alaska Native
Geographical mobility - Same house 1 year ago (%) - Multirace
Geographical mobility - Same house 1 year ago (%) - Other Race
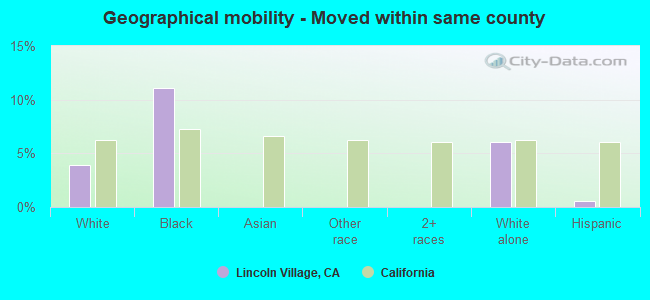
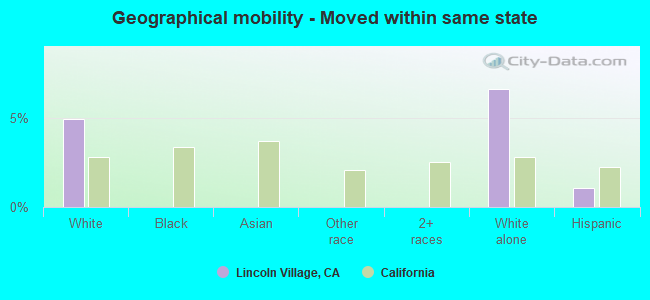
Geographical mobility - Moved within same county (%)
Geographical mobility - Moved within same county (%) - White
Geographical mobility - Moved within same county (%) - Black or African American
Geographical mobility - Moved within same county (%) - Asian
Geographical mobility - Moved within same county (%) - Hispanic or Latino
Geographical mobility - Moved within same county (%) - American Indian and Alaska Native
Geographical mobility - Moved within same county (%) - Multirace
Geographical mobility - Moved within same county (%) - Other Race
Geographical mobility - Moved from different county within same state (%)
Geographical mobility - Moved from different county within same state (%) - White
Geographical mobility - Moved from different county within same state (%) - Black or African American
Geographical mobility - Moved from different county within same state (%) - Asian
Geographical mobility - Moved from different county within same state (%) - Hispanic or Latino
Geographical mobility - Moved from different county within same state (%) - American Indian and Alaska Native
Geographical mobility - Moved from different county within same state (%) - Multirace
Geographical mobility - Moved from different county within same state (%) - Other Race
Geographical mobility - Moved from different state (%)
Geographical mobility - Moved from different state (%) - White
Geographical mobility - Moved from different state (%) - Black or African American
Geographical mobility - Moved from different state (%) - Asian
Geographical mobility - Moved from different state (%) - Hispanic or Latino
Geographical mobility - Moved from different state (%) - American Indian and Alaska Native
Geographical mobility - Moved from different state (%) - Multirace
Geographical mobility - Moved from different state (%) - Other Race
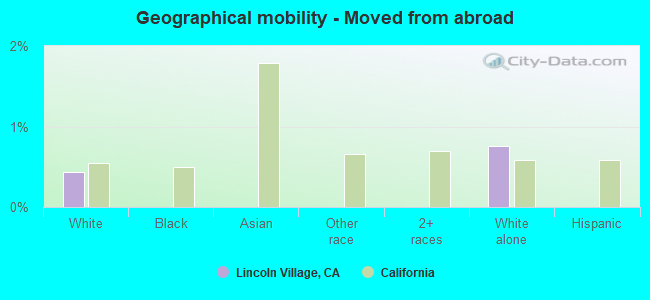
Geographical mobility - Moved from abroad (%)
Geographical mobility - Moved from abroad (%) - White
Geographical mobility - Moved from abroad (%) - Black or African American
Geographical mobility - Moved from abroad (%) - Asian
Geographical mobility - Moved from abroad (%) - Hispanic or Latino
Geographical mobility - Moved from abroad (%) - American Indian and Alaska Native
Geographical mobility - Moved from abroad (%) - Multirace
Geographical mobility - Moved from abroad (%) - Other Race
Place of birth for the foreign-born population - Ireland (%)
Place of birth for the foreign-born population - Denmark (%)
Place of birth for the foreign-born population - Norway (%)
Place of birth for the foreign-born population - Sweden (%)
Place of birth for the foreign-born population - United Kingdom (%)
Place of birth for the foreign-born population - England (%)
Place of birth for the foreign-born population - Scotland (%)
Place of birth for the foreign-born population - Other Northern Europe (%)
Place of birth for the foreign-born population - Austria (%)
Place of birth for the foreign-born population - Belgium (%)
Place of birth for the foreign-born population - France (%)
Place of birth for the foreign-born population - Germany (%)
Place of birth for the foreign-born population - Netherlands (%)
Place of birth for the foreign-born population - Switzerland (%)
Place of birth for the foreign-born population - Other Western Europe (%)
Place of birth for the foreign-born population - Greece (%)
Place of birth for the foreign-born population - Italy (%)
Place of birth for the foreign-born population - Portugal (%)
Place of birth for the foreign-born population - Spain (%)
Place of birth for the foreign-born population - Other Southern Europe (%)
Place of birth for the foreign-born population - Albania (%)
Place of birth for the foreign-born population - Belarus (%)
Place of birth for the foreign-born population - Bosnia and Herzegovina (%)
Place of birth for the foreign-born population - Bulgaria (%)
Place of birth for the foreign-born population - Croatia (%)
Place of birth for the foreign-born population - Czechoslovakia (%)
Place of birth for the foreign-born population - Hungary (%)
Place of birth for the foreign-born population - Latvia (%)
Place of birth for the foreign-born population - Lithuania (%)
Place of birth for the foreign-born population - North Macedonia (Macedonia) (%)
Place of birth for the foreign-born population - Moldova (%)
Place of birth for the foreign-born population - Poland (%)
Place of birth for the foreign-born population - Romania (%)
Place of birth for the foreign-born population - Russia (%)
Place of birth for the foreign-born population - Serbia (%)
Place of birth for the foreign-born population - Ukraine (%)
Place of birth for the foreign-born population - Other Eastern Europe (%)
Place of birth for the foreign-born population - China (%)
Place of birth for the foreign-born population - Hong Kong (%)
Place of birth for the foreign-born population - Taiwan (%)
Place of birth for the foreign-born population - Japan (%)
Place of birth for the foreign-born population - Korea (%)
Place of birth for the foreign-born population - Other Eastern Asia (%)
Place of birth for the foreign-born population - Afghanistan (%)
Place of birth for the foreign-born population - Bangladesh (%)
Place of birth for the foreign-born population - India (%)
Place of birth for the foreign-born population - Iran (%)
Place of birth for the foreign-born population - Kazakhstan (%)
Place of birth for the foreign-born population - Nepal (%)
Place of birth for the foreign-born population - Pakistan (%)
Place of birth for the foreign-born population - Sri Lanka (%)
Place of birth for the foreign-born population - Uzbekistan (%)
Place of birth for the foreign-born population - Other South Central Asia (%)
Place of birth for the foreign-born population - Burma (%)
Place of birth for the foreign-born population - Cambodia (%)
Place of birth for the foreign-born population - Indonesia (%)
Place of birth for the foreign-born population - Laos (%)
Place of birth for the foreign-born population - Malaysia (%)
Place of birth for the foreign-born population - Philippines (%)
Place of birth for the foreign-born population - Singapore (%)
Place of birth for the foreign-born population - Thailand (%)
Place of birth for the foreign-born population - Vietnam (%)
Place of birth for the foreign-born population - Other South Eastern Asia (%)
Place of birth for the foreign-born population - Armenia (%)
Place of birth for the foreign-born population - Iraq (%)
Place of birth for the foreign-born population - Israel (%)
Place of birth for the foreign-born population - Jordan (%)
Place of birth for the foreign-born population - Kuwait (%)
Place of birth for the foreign-born population - Lebanon (%)
Place of birth for the foreign-born population - Saudi Arabia (%)
Place of birth for the foreign-born population - Syria (%)
Place of birth for the foreign-born population - Turkey (%)
Place of birth for the foreign-born population - Yemen (%)
Place of birth for the foreign-born population - Other Western Asia (%)
Place of birth for the foreign-born population - Eritrea (%)
Place of birth for the foreign-born population - Ethiopia (%)
Place of birth for the foreign-born population - Kenya (%)
Place of birth for the foreign-born population - Somalia (%)
Place of birth for the foreign-born population - Uganda (%)
Place of birth for the foreign-born population - Zimbabwe (%)
Place of birth for the foreign-born population - Other Eastern Africa (%)
Place of birth for the foreign-born population - Cameroon (%)
Place of birth for the foreign-born population - Congo (%)
Place of birth for the foreign-born population - Democratic Republic of Congo (Zaire) (%)
Place of birth for the foreign-born population - Other Middle Africa (%)
Place of birth for the foreign-born population - Egypt (%)
Place of birth for the foreign-born population - Morocco (%)
Place of birth for the foreign-born population - Sudan (%)
Place of birth for the foreign-born population - Other Northern Africa (%)
Place of birth for the foreign-born population - South Africa (%)
Place of birth for the foreign-born population - Other Southern Africa (%)
Place of birth for the foreign-born population - Cabo Verde (%)
Place of birth for the foreign-born population - Ghana (%)
Place of birth for the foreign-born population - Liberia (%)
Place of birth for the foreign-born population - Nigeria (%)
Place of birth for the foreign-born population - Senegal (%)
Place of birth for the foreign-born population - Sierra Leone (%)
Place of birth for the foreign-born population - Other Western Africa (%)
Place of birth for the foreign-born population - Australia (%)
Place of birth for the foreign-born population - New Zealand (%)
Place of birth for the foreign-born population - Fiji (%)
Place of birth for the foreign-born population - Micronesia (%)
Place of birth for the foreign-born population - Bahamas (%)
Place of birth for the foreign-born population - Barbados (%)
Place of birth for the foreign-born population - Cuba (%)
Place of birth for the foreign-born population - Dominica (%)
Place of birth for the foreign-born population - Dominican Republic (%)
Place of birth for the foreign-born population - Grenada (%)
Place of birth for the foreign-born population - Haiti (%)
Place of birth for the foreign-born population - Jamaica (%)
Place of birth for the foreign-born population - St. Vincent and the Grenadines (%)
Place of birth for the foreign-born population - Trinidad and Tobago (%)
Place of birth for the foreign-born population - West Indies (%)
Place of birth for the foreign-born population - Other Caribbean (%)
Place of birth for the foreign-born population - Belize (%)
Place of birth for the foreign-born population - Costa Rica (%)
Place of birth for the foreign-born population - El Salvador (%)
Place of birth for the foreign-born population - Guatemala (%)
Place of birth for the foreign-born population - Honduras (%)
Place of birth for the foreign-born population - Mexico (%)
Place of birth for the foreign-born population - Nicaragua (%)
Place of birth for the foreign-born population - Panama (%)
Place of birth for the foreign-born population - Other Central America (%)
Place of birth for the foreign-born population - Argentina (%)
Place of birth for the foreign-born population - Bolivia (%)
Place of birth for the foreign-born population - Brazil (%)
Place of birth for the foreign-born population - Chile (%)
Place of birth for the foreign-born population - Colombia (%)
Place of birth for the foreign-born population - Ecuador (%)
Place of birth for the foreign-born population - Guyana (%)
Place of birth for the foreign-born population - Peru (%)
Place of birth for the foreign-born population - Uruguay (%)
Place of birth for the foreign-born population - Venezuela (%)
Place of birth for the foreign-born population - Other South America (%)
Place of birth for the foreign-born population - Canada (%)
Place of birth for the foreign-born population - Other Northern America (%)
Place of birth for the foreign-born population - Other (%)
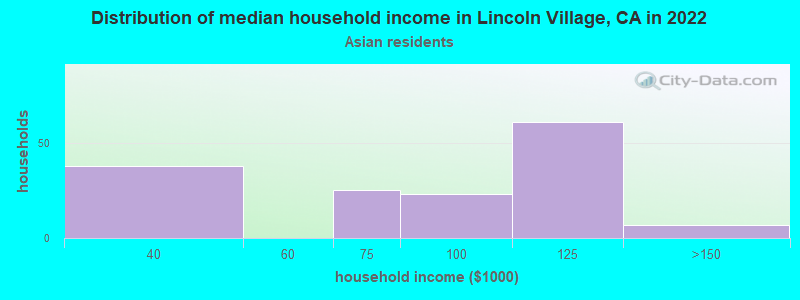
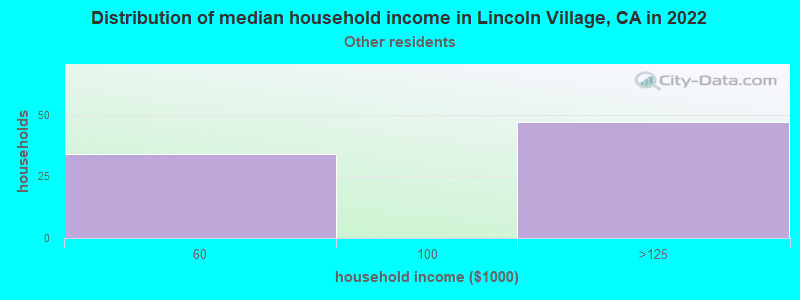
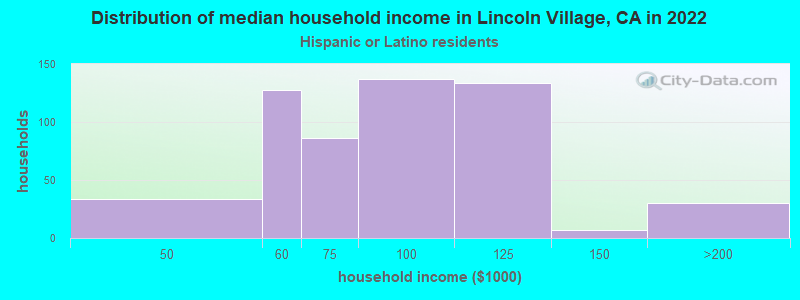
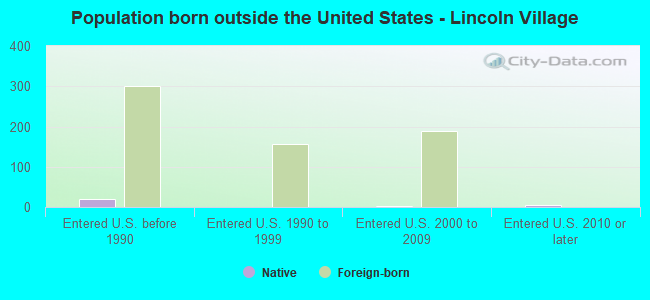
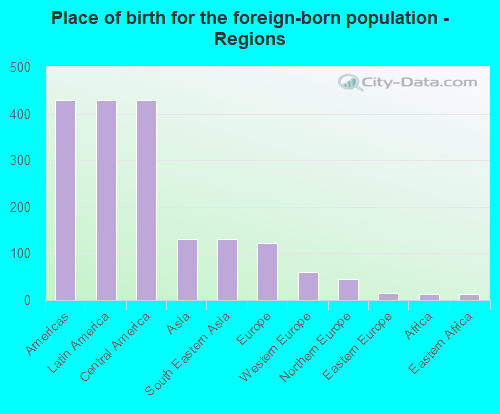
According to 2022 data, the most numerous races in Lincoln Village, CA are Hispanic (2,195 residents), White alone (2,077 residents), and Asian alone (199 residents). 72.1% of Lincoln Village residents speak English at home. 14.0% of Lincoln Village, CA residents are foreign-born (8.7% born in Latin America, 2.7% born in Asia, 2.5% born in Europe), which is 86.4% less than the foreign-born rate of 26.0% across the entire state of California.
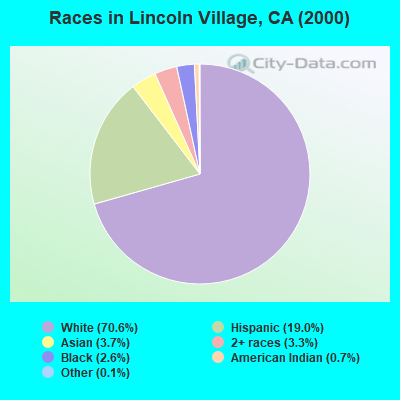
Race distribution in Lincoln Village
2000 2022
15,816,790 46.7% White alone 10,966,556 32.4% Hispanic 3,648,860 10.8% Asian alone 2,181,926 6.4% Black alone 903,115 2.7% Two or more races 178,984 0.5% American Indian alone 103,736 0.3% Native Hawaiian and Other 71,681 0.2% Other race alone
15,732,184 40.3% Hispanic 13,160,426 33.7% White alone 5,957,867 15.3% Asian alone 2,025,218 5.2% Black alone 1,663,222 4.3% Two or more races 251,618 0.6% Other race alone 135,777 0.3% Native Hawaiian and Other 103,030 0.3% American Indian alone
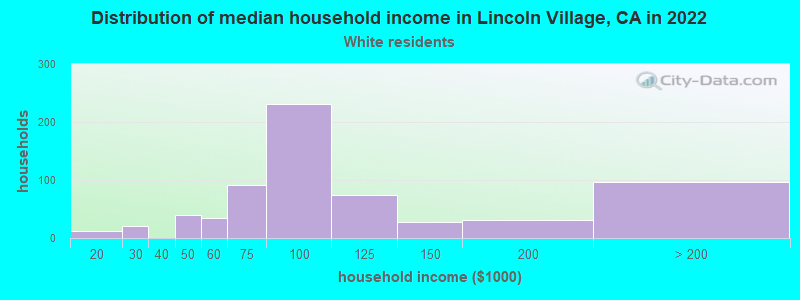
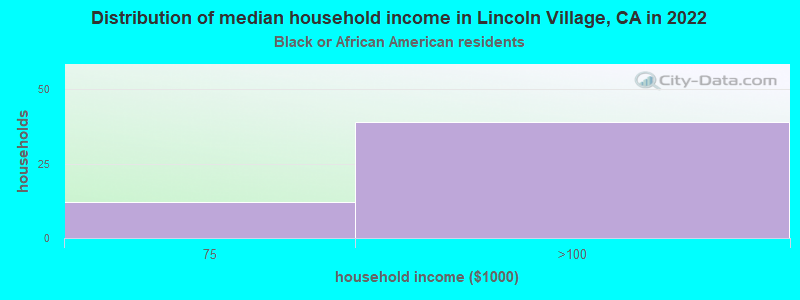
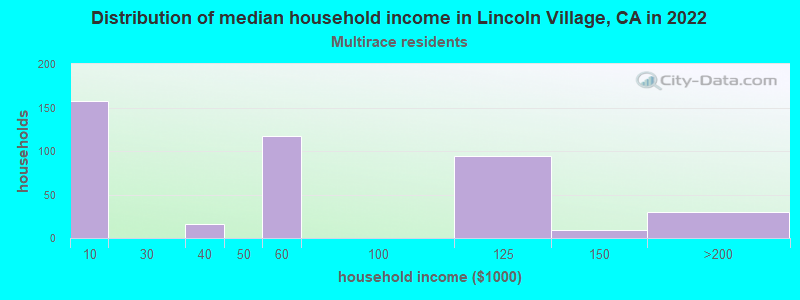
Income and house value in Lincoln Village Median household income in 2022 $102,758 White non-Hispanic householders$20,468 Black householders$105,466 American Indian and Alaska Native householders$44,111 Asian householders$89,855 Some other race householders$91,850 Two or more races householders$90,237 Hispanic or Latino race householdersMedian 2022 house value $453,151 White Non-Hispanic householders$498,142 Black or African American householders$404,920 American Indian or Alaska Native householders $462,869 Asian householders$355,610 Some other race householders$432,275 Two or more races householders$484,465 Hispanic or Latino householders
Median age by race in Lincoln Village
39.2 Median age for White residents38.5 39.9 69.4 Median age for Black or African American residents12.9 Median age for American Indian / Alaska Native residents36.8 Median age for Asian residents36.3 46.6 44.6 Median age for Other race residents36.5 47.4 14.2 Median age for Two or more races residents12.1 15.9 50.2 Median age for White alone residents38.8 51.5 26.5 Median age for Hispanic or Latino residents27.7 26.2
Owner/renter occupied households by race in Lincoln Village
House owners and renters - White residents 850 73.1% Owner occupied314 26.9% Renter occupiedHouse owners and renters - Black or African American residents 31 44.4% Owner occupied39 55.6% Renter occupiedHouse owners and renters - Asian residents 52 72.7% Owner occupied20 27.3% Renter occupiedHouse owners and renters - Other race residents 35 43.9% Owner occupied44 56.1% Renter occupiedHouse owners and renters - Two or more races residents 304 68.2% Owner occupied142 31.8% Renter occupiedHouse owners and renters - White alone residents 773 81.6% Owner occupied175 18.4% Renter occupiedHouse owners and renters - Hispanic or Latino residents 300 54.1% Owner occupied255 45.9% Renter occupied
Language usage in Lincoln Village
English speakers - Total 72.1% of residents of Lincoln Village speak English at home.
21.0% of residents speak Spanish at home 675 71.7% Speak English very well266 28.3% Speak English less than very well7.1% of residents speak other language at home 260 81.5% Speak English very well59 18.5% Speak English less than very well
English speakers - Born in the United States 84.4% of residents of Lincoln Village speak English at home.
7.7% of residents speak Spanish at home 41 100.0% Speak English very well8.1% of residents speak other language at home 43 100.0% Speak English very well
English speakers - Native, born elsewhere 17.2% of residents of Lincoln Village speak English at home.
75.9% of residents speak other language at home 22 100.0% Speak English very well
English speakers - Foreign-born 10.0% of residents of Lincoln Village speak English at home.
56.7% of residents speak Spanish at home 133 34.4% Speak English very well254 65.6% Speak English less than very well32.7% of residents speak other language at home 164 73.5% Speak English very well59 26.5% Speak English less than very well
White (Caucasian) - Speak only English Native:
91.4% (2,309)Foreign-born:
15.4% (48)
White (Caucasian) - Speak another language Native:
10.1% (256)Foreign-born:
83.2% (258)
Asian - Speak another language Native:
35.2% (20)Foreign-born:
97.7% (136)
Other race - Speak another language Native:
54.9% (58)Foreign-born:
98.2% (68)
Two or more races - Speak another language Native:
68.1% (1,307)Foreign-born:
100.0% (102)
White alone - Speak only English Native:
100.0% (1,939)Foreign-born:
50.1% (37)
White alone - Speak another language Native:
0.2% (4)Foreign-born:
52.4% (38)
Hispanic or Latino - Speak only English Native:
62.9% (1,012)Foreign-born:
4.1% (17)
Hispanic or Latino - Speak another language Native:
38.0% (611)Foreign-born:
95.8% (400)
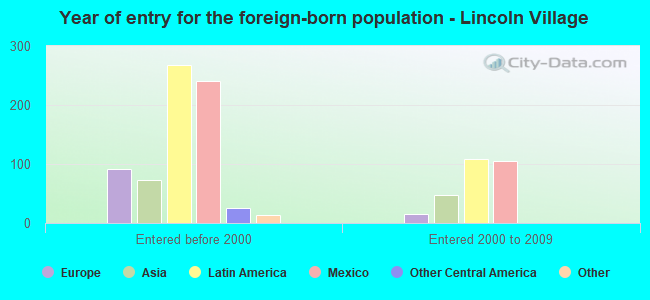
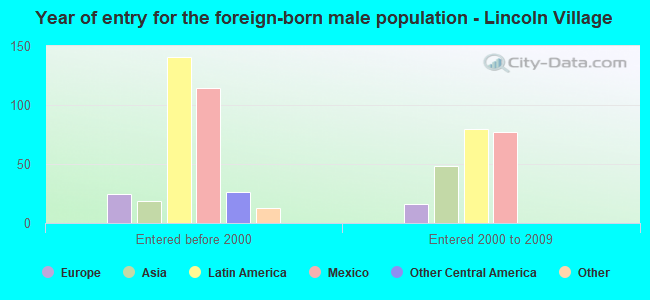
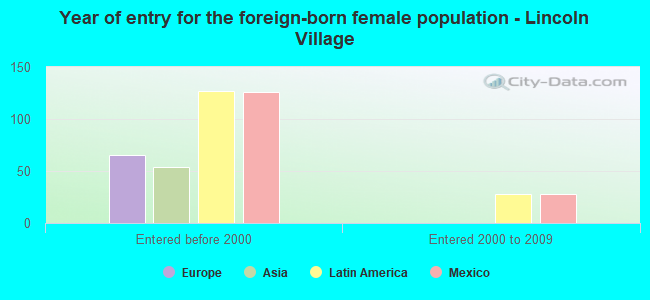
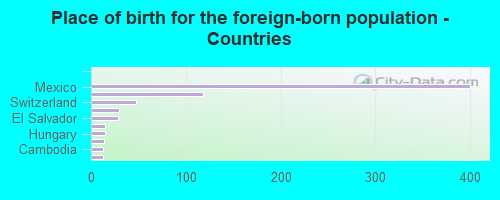
Foreign-born residents in Lincoln Village 697 residents are foreign born (8.7% Latin America , 2.7% Asia , 2.5% Europe ).
This city:
14.0%California:
100.0%
Marital status for residents in Lincoln Village Marital status - White (Caucasian) population 15 years and over
Males 40.8% Never married51.9% Now married0.0% Separated4.8% Widowed2.4% DivorcedFemales 28.5% Never married50.0% Now married1.7% Separated7.2% Widowed12.6% DivorcedWomen who gave birth in the past 12 months Now married:
100.0% (60)Unmarried:
0.0% (0)
Women who did not give birth in the past 12 months Now married:
36.2% (233)Unmarried:
63.8% (410)
Marital status - Black or African American population 15 years and over
Males 0.0% Never married51.9% Now married0.0% Separated48.1% Widowed0.0% DivorcedFemales 0.0% Never married24.6% Now married0.0% Separated0.0% Widowed75.4% DivorcedMarital status - Asian population 15 years and over
Males 56.4% Never married43.6% Now married0.0% Separated0.0% Widowed0.0% DivorcedFemales 0.0% Never married77.4% Now married0.0% Separated0.0% Widowed22.6% DivorcedWomen who gave birth in the past 12 months Now married:
100.0% (26)Unmarried:
0.0% (0)
Women who did not give birth in the past 12 months Now married:
55.3% (27)Unmarried:
44.7% (22)
Marital status - Other race population 15 years and over
Males 24.4% Never married67.8% Now married0.0% Separated0.0% Widowed7.8% DivorcedFemales 6.1% Never married72.7% Now married0.0% Separated0.0% Widowed21.2% DivorcedWomen who did not give birth in the past 12 months Now married:
72.7% (24)Unmarried:
27.3% (9)
Marital status - Two or more races population 15 years and over
Males 38.3% Never married61.7% Now married0.0% Separated0.0% Widowed0.0% DivorcedFemales 52.6% Never married15.1% Now married0.0% Separated0.0% Widowed32.3% DivorcedWomen who did not give birth in the past 12 months Now married:
22.4% (127)Unmarried:
77.6% (442)
Marital status - White alone, not Hispanic / Latino population 15 years and over
Males 37.6% Never married54.5% Now married0.0% Separated4.4% Widowed3.5% DivorcedFemales 29.2% Never married48.7% Now married1.2% Separated10.4% Widowed10.6% DivorcedWomen who gave birth in the past 12 months Now married:
100.0% (21)Unmarried:
0.0% (0)
Women who did not give birth in the past 12 months Now married:
35.2% (147)Unmarried:
64.8% (270)
Marital status - Hispanic or Latino population 15 years and over
Males 47.7% Never married46.9% Now married0.0% Separated4.2% Widowed1.2% DivorcedFemales 34.2% Never married41.7% Now married1.8% Separated0.0% Widowed22.3% DivorcedWomen who gave birth in the past 12 months Now married:
100.0% (54)Unmarried:
0.0% (0)
Women who did not give birth in the past 12 months Now married:
35.7% (205)Unmarried:
64.3% (369)
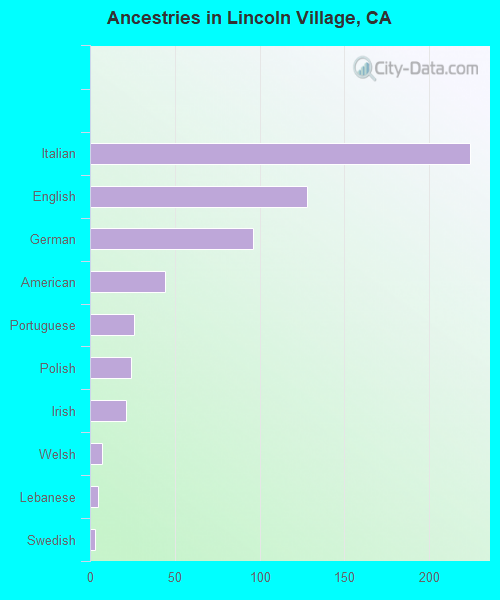
Ancestries in Lincoln Village
146 6.0% Italian107 4.4% Portuguese79 3.3% German78 3.2% English73 3.0% Swedish68 2.8% American41 1.7% Swiss38 1.6% Irish31 1.3% European16 0.7% Norwegian16 0.7% Polish12 0.5% Hungarian11 0.5% French Canadian7 0.3% Lebanese5 0.2% Welsh
Children Nativity (place of birth) in Lincoln Village
Children under 6 years - Living with two parents Both parents native 250 100.0% NativeBoth parents foreign-born 13 100.0% NativeOne native, one foreign-born parent 2 100.0% NativeChildren under 6 years - Living with one parent Native parent 146 100.0% NativeForeign-born parent 15 100.0% NativeChildren 6 to 17 years - Living with two parents Both parents native 297 100.0% Native0 0.0% Foreign-bornBoth parents foreign-born 37 68.8% Native17 31.2% Foreign-bornOne native, one foreign-born parent 41 100.0% NativeChildren 6 to 17 years - Living with one parent Native parent 495 100.0% Native
Grandparents responsible for own grandchildren in Lincoln Village
Grandparents (30 to 59 years) White / Caucasian 23 69.3% Responsible for grandchildren10 30.7% Not responsible for grandchildrenAsian 14 100.0% Not responsible for grandchildrenTwo or more races 397 100.0% Not responsible for grandchildrenWhite alone, not Hispanic / Latino 14 53.0% Responsible for grandchildren13 47.0% Not responsible for grandchildrenHispanic or Latino 74 100.0% Not responsible for grandchildrenGrandparents (60 years and over) White / Caucasian 14 11.6% Responsible for grandchildren106 88.4% Not responsible for grandchildrenAsian 18 100.0% Not responsible for grandchildrenWhite alone, not Hispanic / Latino 15 53.1% Responsible for grandchildren13 46.9% Not responsible for grandchildrenHispanic or Latino 13 8.0% Responsible for grandchildren151 92.0% Not responsible for grandchildren