Races in Lincolnville, Maine (ME) Detailed Stats
Ancestries, Foreign-born residents, place of birth

Recent posts about races in Lincolnville, Maine on our local forum with over 2,400,000 registered users:
 | Camden House Renovation & Settling in (2 replies) |
| Well, here goes. The start to our trek North to Maine, our new home-state. (395 replies) |
| Opinions on Lincolnville (14 replies) |
| Small town Maine retirement (47 replies) |
| Is 62 too old to move to Portland by yourself? (33 replies) |
| Camden Restaurant Suggestions? (16 replies) |
1.8% of Lincolnville, ME residents are foreign-born , which is 65.6% less than the foreign-born rate of 3.0% across the entire state of Maine.
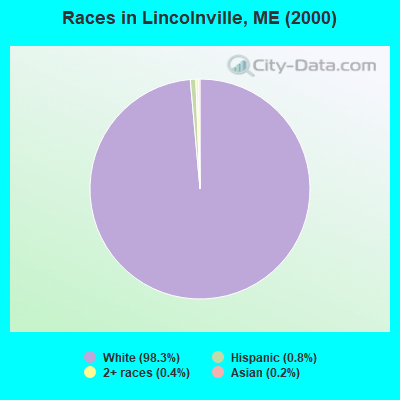
Race distribution in Lincolnville

- 2,00798.3%White alone
- 170.8%Hispanic
- 80.4%Two or more races
- 40.2%Asian alone
- 20.10%Other race alone
- 20.10%American Indian alone
- 10.05%Black alone
- 10.05%Native Hawaiian and Other
Pacific Islander alone
2000
2022
-
- 1,230,29796.5%White alone
- 11,7310.9%Two or more races
- 9,3600.7%Hispanic
- 9,0140.7%Asian alone
- 6,4400.5%Black alone
- 6,9110.5%American Indian alone
- 8360.07%Other race alone
- 3340.03%Native Hawaiian and Other
Pacific Islander alone

-
- 1,249,23390.2%White alone
- 58,3574.2%Two or more races
- 28,7172.1%Hispanic
- 21,5831.6%Black alone
- 16,1511.2%Asian alone
- 5,8730.4%Other race alone
- 5,2050.4%American Indian alone
- 2210.02%Native Hawaiian and Other
Pacific Islander alone

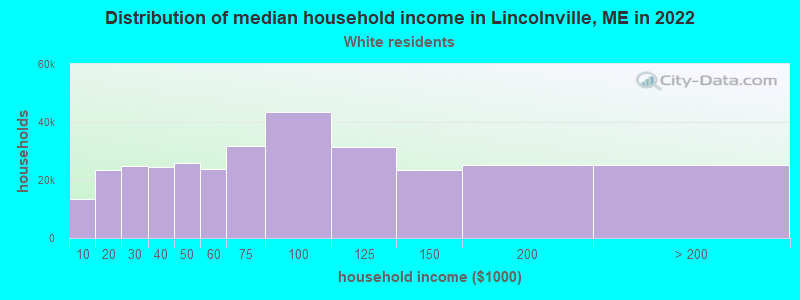
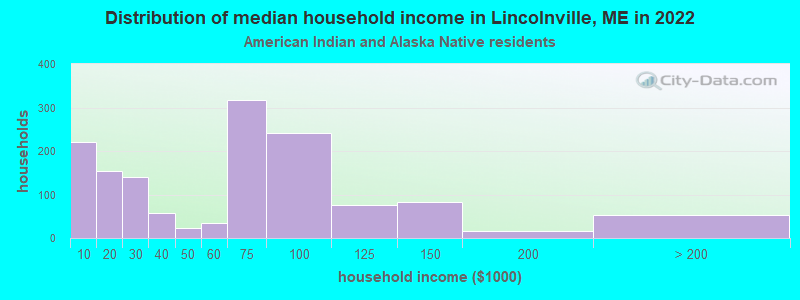
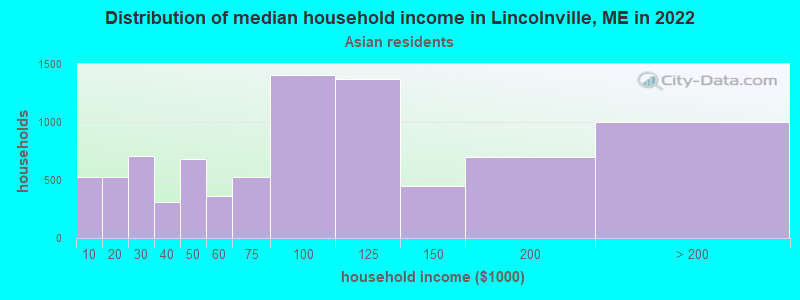
Income and house value in Lincolnville
- Median household income in 2022
- $78,739White non-Hispanic householders
- $24,681American Indian and Alaska Native householders
- $110,919Asian householders
- $159,425Two or more races householders
- $91,199Hispanic or Latino race householders
- Median 2022 house value
- $381,427White Non-Hispanic householders
- over $1,000,000Hispanic or Latino householders
Household income for White non-Hispanic householders
Household income for American Indian and Alaska Native householders
Household income for Asian householders
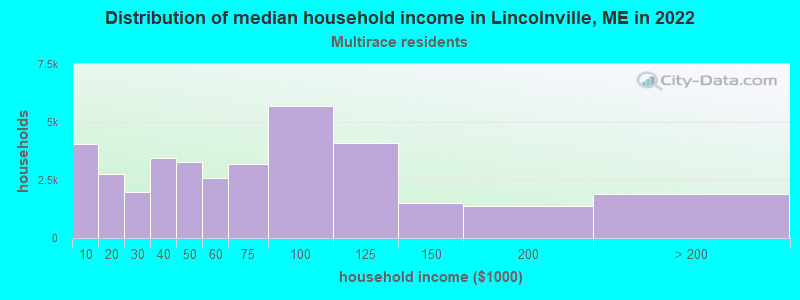
Household income for Two or more races householders
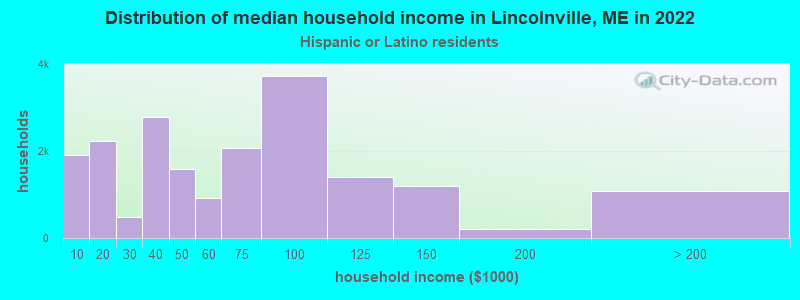
Household income for Hispanic or Latino race householders
Foreign-born residents in Lincolnville
37 residents are foreign born
| This city: | 1.8% |
| Maine: | 2.9% |
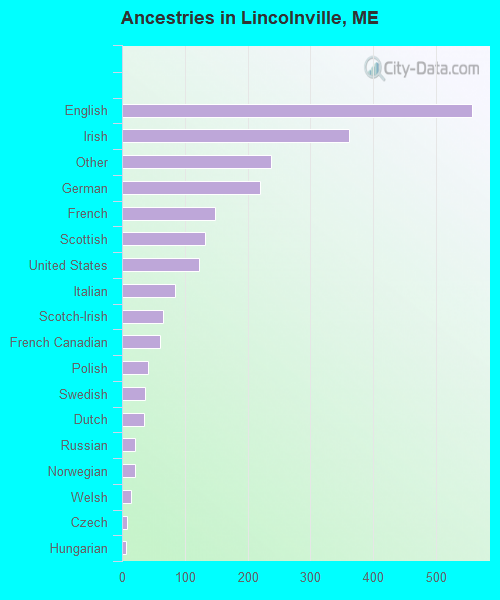
Ancestries in Lincolnville

- 55725.3%English
- 36216.5%Irish
- 23810.8%Other
- 22010.0%German
- 1486.7%French
- 1336.1%Scottish
- 1235.6%United States
- 843.8%Italian
- 653.0%Scotch-Irish
- 602.7%French Canadian
- 411.9%Polish
- 361.6%Swedish
- 351.6%Dutch
- 211.0%Russian
- 200.9%Norwegian
- 150.7%Welsh
- 80.4%Czech
- 60.3%Hungarian
- 50.2%Danish
- 50.2%Swiss
- 40.2%Greek
- 40.2%Portuguese
- 30.1%Subsaharan African
- 30.1%Ukrainian
- 20.09%Lithuanian
Zip codes: 04849.