Races in Linthicum, Maryland (MD) Detailed Stats
Data:
Races - White alone (%)
Races - White alone (% change since 2000)
Races - Black alone (%)
Races - Black alone (% change since 2000)
Races - American Indian alone (%)
Races - American Indian alone (% change since 2000)
Races - Asian alone (%)
Races - Asian alone (% change since 2000)
Races - Hispanic (%)
Races - Hispanic (% change since 2000)
Races - Native Hawaiian and Other Pacific Islander alone (%)
Races - Native Hawaiian and Other Pacific Islander alone (% change since 2000)
Races - Two or more races(%)
Races - Two or more races(% change since 2000)
Races - Other race alone (%)
Races - Other race alone (% change since 2000)
Racial diversity
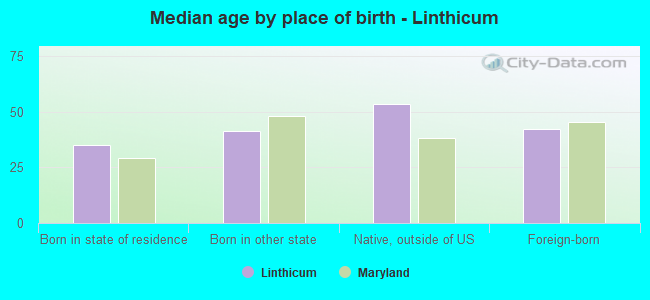
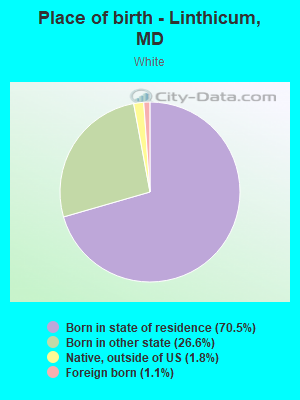
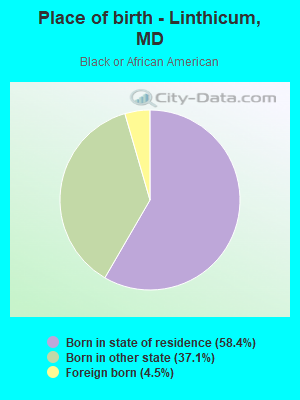
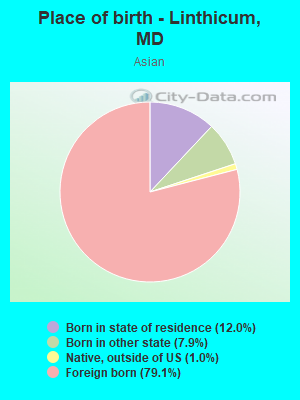
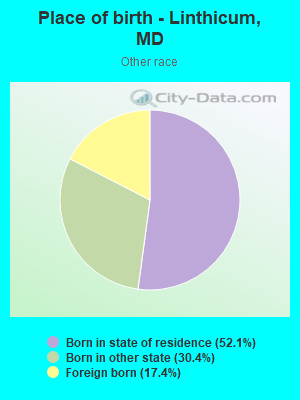
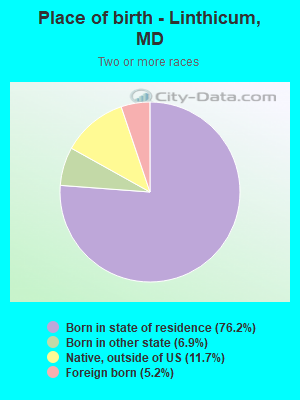
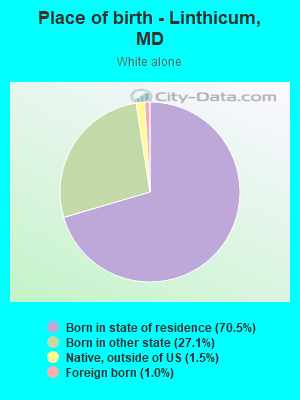
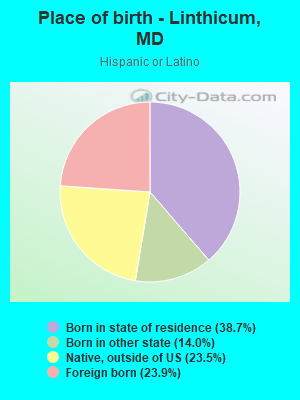
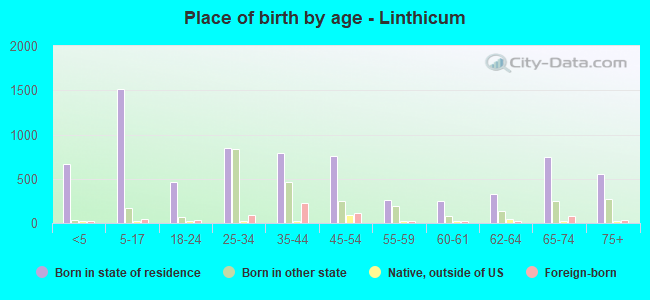
Place of birth - Born in state of residence (%)
Place of birth - Born in state of residence (%) - White
Place of birth - Born in state of residence (%) - Black or African American
Place of birth - Born in state of residence (%) - Asian
Place of birth - Born in state of residence (%) - Hispanic or Latino
Place of birth - Born in state of residence (%) - American Indian and Alaska Native
Place of birth - Born in state of residence (%) - Multirace
Place of birth - Born in state of residence (%) - Other Race
Place of birth - Born in other state (%)
Place of birth - Born in other state (%) - White
Place of birth - Born in other state (%) - Black or African American
Place of birth - Born in other state (%) - Asian
Place of birth - Born in other state (%) - Hispanic or Latino
Place of birth - Born in other state (%) - American Indian and Alaska Native
Place of birth - Born in other state (%) - Multirace
Place of birth - Born in other state (%) - Other Race
Place of birth - Native, outside of US (%)
Place of birth - Native, outside of US (%) - White
Place of birth - Native, outside of US (%) - Black or African American
Place of birth - Native, outside of US (%) - Asian
Place of birth - Native, outside of US (%) - Hispanic or Latino
Place of birth - Native, outside of US (%) - American Indian and Alaska Native
Place of birth - Native, outside of US (%) - Multirace
Place of birth - Native, outside of US (%) - Other Race
Place of birth - Foreign born (%)
Place of birth - Foreign born (%) - White
Place of birth - Foreign born (%) - Black or African American
Place of birth - Foreign born (%) - Asian
Place of birth - Foreign born (%) - Hispanic or Latino
Place of birth - Foreign born (%) - American Indian and Alaska Native
Place of birth - Foreign born (%) - Multirace
Place of birth - Foreign born (%) - Other Race
Residents speaking English at home (%)
Residents speaking English at home - Born in the United States (%)
Residents speaking English at home - Native, born elsewhere (%)
Residents speaking English at home - Foreign born (%)
Residents speaking Spanish at home (%)
Residents speaking Spanish at home - Born in the United States (%)
Residents speaking Spanish at home - Native, born elsewhere (%)
Residents speaking Spanish at home - Foreign born (%)
Residents speaking other language at home (%)
Residents speaking other language at home - Born in the United States (%)
Residents speaking other language at home - Native, born elsewhere (%)
Residents speaking other language at home - Foreign born (%)
Marital status - Never married (%)
Marital status - Now married (%)
Marital status - Separated (%)
Marital status - Widowed (%)
Marital status - Divorced (%)
Ancestries Reported - Arab (%)
Ancestries Reported - Czech (%)
Ancestries Reported - Danish (%)
Ancestries Reported - Dutch (%)
Ancestries Reported - English (%)
Ancestries Reported - French (%)
Ancestries Reported - French Canadian (%)
Ancestries Reported - German (%)
Ancestries Reported - Greek (%)
Ancestries Reported - Hungarian (%)
Ancestries Reported - Irish (%)
Ancestries Reported - Italian (%)
Ancestries Reported - Lithuanian (%)
Ancestries Reported - Norwegian (%)
Ancestries Reported - Polish (%)
Ancestries Reported - Portuguese (%)
Ancestries Reported - Russian (%)
Ancestries Reported - Scotch-Irish (%)
Ancestries Reported - Scottish (%)
Ancestries Reported - Slovak (%)
Ancestries Reported - Subsaharan African (%)
Ancestries Reported - Swedish (%)
Ancestries Reported - Swiss (%)
Ancestries Reported - Ukrainian (%)
Ancestries Reported - United States (%)
Ancestries Reported - Welsh (%)
Ancestries Reported - West Indian (%)
Ancestries Reported - Other (%)
Geographical mobility - Same house 1 year ago (%)
Geographical mobility - Same house 1 year ago (%) - White
Geographical mobility - Same house 1 year ago (%) - Black or African American
Geographical mobility - Same house 1 year ago (%) - Asian
Geographical mobility - Same house 1 year ago (%) - Hispanic or Latino
Geographical mobility - Same house 1 year ago (%) - American Indian and Alaska Native
Geographical mobility - Same house 1 year ago (%) - Multirace
Geographical mobility - Same house 1 year ago (%) - Other Race
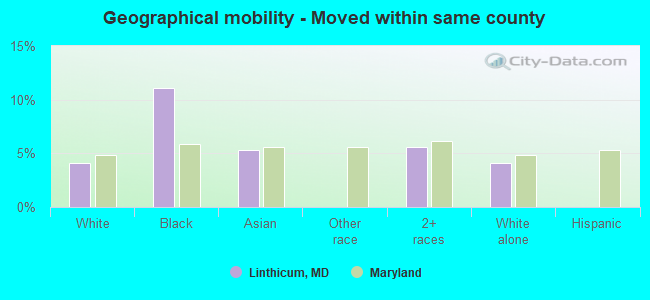
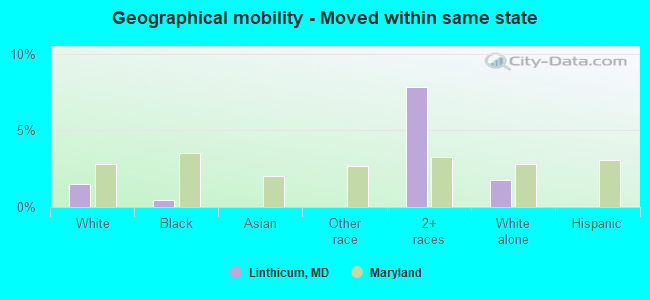
Geographical mobility - Moved within same county (%)
Geographical mobility - Moved within same county (%) - White
Geographical mobility - Moved within same county (%) - Black or African American
Geographical mobility - Moved within same county (%) - Asian
Geographical mobility - Moved within same county (%) - Hispanic or Latino
Geographical mobility - Moved within same county (%) - American Indian and Alaska Native
Geographical mobility - Moved within same county (%) - Multirace
Geographical mobility - Moved within same county (%) - Other Race
Geographical mobility - Moved from different county within same state (%)
Geographical mobility - Moved from different county within same state (%) - White
Geographical mobility - Moved from different county within same state (%) - Black or African American
Geographical mobility - Moved from different county within same state (%) - Asian
Geographical mobility - Moved from different county within same state (%) - Hispanic or Latino
Geographical mobility - Moved from different county within same state (%) - American Indian and Alaska Native
Geographical mobility - Moved from different county within same state (%) - Multirace
Geographical mobility - Moved from different county within same state (%) - Other Race
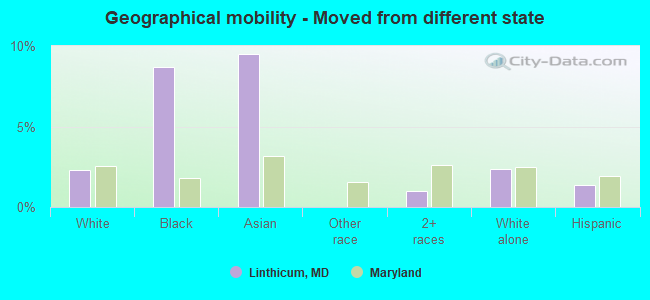
Geographical mobility - Moved from different state (%)
Geographical mobility - Moved from different state (%) - White
Geographical mobility - Moved from different state (%) - Black or African American
Geographical mobility - Moved from different state (%) - Asian
Geographical mobility - Moved from different state (%) - Hispanic or Latino
Geographical mobility - Moved from different state (%) - American Indian and Alaska Native
Geographical mobility - Moved from different state (%) - Multirace
Geographical mobility - Moved from different state (%) - Other Race
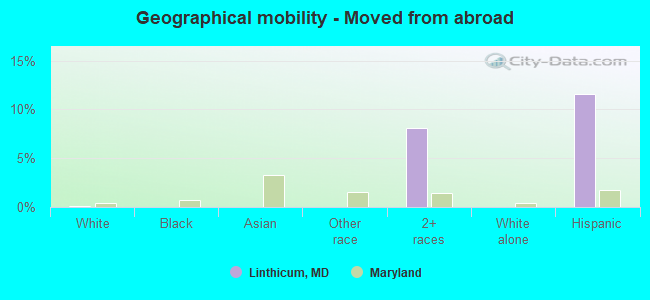
Geographical mobility - Moved from abroad (%)
Geographical mobility - Moved from abroad (%) - White
Geographical mobility - Moved from abroad (%) - Black or African American
Geographical mobility - Moved from abroad (%) - Asian
Geographical mobility - Moved from abroad (%) - Hispanic or Latino
Geographical mobility - Moved from abroad (%) - American Indian and Alaska Native
Geographical mobility - Moved from abroad (%) - Multirace
Geographical mobility - Moved from abroad (%) - Other Race
Place of birth for the foreign-born population - Ireland (%)
Place of birth for the foreign-born population - Denmark (%)
Place of birth for the foreign-born population - Norway (%)
Place of birth for the foreign-born population - Sweden (%)
Place of birth for the foreign-born population - United Kingdom (%)
Place of birth for the foreign-born population - England (%)
Place of birth for the foreign-born population - Scotland (%)
Place of birth for the foreign-born population - Other Northern Europe (%)
Place of birth for the foreign-born population - Austria (%)
Place of birth for the foreign-born population - Belgium (%)
Place of birth for the foreign-born population - France (%)
Place of birth for the foreign-born population - Germany (%)
Place of birth for the foreign-born population - Netherlands (%)
Place of birth for the foreign-born population - Switzerland (%)
Place of birth for the foreign-born population - Other Western Europe (%)
Place of birth for the foreign-born population - Greece (%)
Place of birth for the foreign-born population - Italy (%)
Place of birth for the foreign-born population - Portugal (%)
Place of birth for the foreign-born population - Spain (%)
Place of birth for the foreign-born population - Other Southern Europe (%)
Place of birth for the foreign-born population - Albania (%)
Place of birth for the foreign-born population - Belarus (%)
Place of birth for the foreign-born population - Bosnia and Herzegovina (%)
Place of birth for the foreign-born population - Bulgaria (%)
Place of birth for the foreign-born population - Croatia (%)
Place of birth for the foreign-born population - Czechoslovakia (%)
Place of birth for the foreign-born population - Hungary (%)
Place of birth for the foreign-born population - Latvia (%)
Place of birth for the foreign-born population - Lithuania (%)
Place of birth for the foreign-born population - North Macedonia (Macedonia) (%)
Place of birth for the foreign-born population - Moldova (%)
Place of birth for the foreign-born population - Poland (%)
Place of birth for the foreign-born population - Romania (%)
Place of birth for the foreign-born population - Russia (%)
Place of birth for the foreign-born population - Serbia (%)
Place of birth for the foreign-born population - Ukraine (%)
Place of birth for the foreign-born population - Other Eastern Europe (%)
Place of birth for the foreign-born population - China (%)
Place of birth for the foreign-born population - Hong Kong (%)
Place of birth for the foreign-born population - Taiwan (%)
Place of birth for the foreign-born population - Japan (%)
Place of birth for the foreign-born population - Korea (%)
Place of birth for the foreign-born population - Other Eastern Asia (%)
Place of birth for the foreign-born population - Afghanistan (%)
Place of birth for the foreign-born population - Bangladesh (%)
Place of birth for the foreign-born population - India (%)
Place of birth for the foreign-born population - Iran (%)
Place of birth for the foreign-born population - Kazakhstan (%)
Place of birth for the foreign-born population - Nepal (%)
Place of birth for the foreign-born population - Pakistan (%)
Place of birth for the foreign-born population - Sri Lanka (%)
Place of birth for the foreign-born population - Uzbekistan (%)
Place of birth for the foreign-born population - Other South Central Asia (%)
Place of birth for the foreign-born population - Burma (%)
Place of birth for the foreign-born population - Cambodia (%)
Place of birth for the foreign-born population - Indonesia (%)
Place of birth for the foreign-born population - Laos (%)
Place of birth for the foreign-born population - Malaysia (%)
Place of birth for the foreign-born population - Philippines (%)
Place of birth for the foreign-born population - Singapore (%)
Place of birth for the foreign-born population - Thailand (%)
Place of birth for the foreign-born population - Vietnam (%)
Place of birth for the foreign-born population - Other South Eastern Asia (%)
Place of birth for the foreign-born population - Armenia (%)
Place of birth for the foreign-born population - Iraq (%)
Place of birth for the foreign-born population - Israel (%)
Place of birth for the foreign-born population - Jordan (%)
Place of birth for the foreign-born population - Kuwait (%)
Place of birth for the foreign-born population - Lebanon (%)
Place of birth for the foreign-born population - Saudi Arabia (%)
Place of birth for the foreign-born population - Syria (%)
Place of birth for the foreign-born population - Turkey (%)
Place of birth for the foreign-born population - Yemen (%)
Place of birth for the foreign-born population - Other Western Asia (%)
Place of birth for the foreign-born population - Eritrea (%)
Place of birth for the foreign-born population - Ethiopia (%)
Place of birth for the foreign-born population - Kenya (%)
Place of birth for the foreign-born population - Somalia (%)
Place of birth for the foreign-born population - Uganda (%)
Place of birth for the foreign-born population - Zimbabwe (%)
Place of birth for the foreign-born population - Other Eastern Africa (%)
Place of birth for the foreign-born population - Cameroon (%)
Place of birth for the foreign-born population - Congo (%)
Place of birth for the foreign-born population - Democratic Republic of Congo (Zaire) (%)
Place of birth for the foreign-born population - Other Middle Africa (%)
Place of birth for the foreign-born population - Egypt (%)
Place of birth for the foreign-born population - Morocco (%)
Place of birth for the foreign-born population - Sudan (%)
Place of birth for the foreign-born population - Other Northern Africa (%)
Place of birth for the foreign-born population - South Africa (%)
Place of birth for the foreign-born population - Other Southern Africa (%)
Place of birth for the foreign-born population - Cabo Verde (%)
Place of birth for the foreign-born population - Ghana (%)
Place of birth for the foreign-born population - Liberia (%)
Place of birth for the foreign-born population - Nigeria (%)
Place of birth for the foreign-born population - Senegal (%)
Place of birth for the foreign-born population - Sierra Leone (%)
Place of birth for the foreign-born population - Other Western Africa (%)
Place of birth for the foreign-born population - Australia (%)
Place of birth for the foreign-born population - New Zealand (%)
Place of birth for the foreign-born population - Fiji (%)
Place of birth for the foreign-born population - Micronesia (%)
Place of birth for the foreign-born population - Bahamas (%)
Place of birth for the foreign-born population - Barbados (%)
Place of birth for the foreign-born population - Cuba (%)
Place of birth for the foreign-born population - Dominica (%)
Place of birth for the foreign-born population - Dominican Republic (%)
Place of birth for the foreign-born population - Grenada (%)
Place of birth for the foreign-born population - Haiti (%)
Place of birth for the foreign-born population - Jamaica (%)
Place of birth for the foreign-born population - St. Vincent and the Grenadines (%)
Place of birth for the foreign-born population - Trinidad and Tobago (%)
Place of birth for the foreign-born population - West Indies (%)
Place of birth for the foreign-born population - Other Caribbean (%)
Place of birth for the foreign-born population - Belize (%)
Place of birth for the foreign-born population - Costa Rica (%)
Place of birth for the foreign-born population - El Salvador (%)
Place of birth for the foreign-born population - Guatemala (%)
Place of birth for the foreign-born population - Honduras (%)
Place of birth for the foreign-born population - Mexico (%)
Place of birth for the foreign-born population - Nicaragua (%)
Place of birth for the foreign-born population - Panama (%)
Place of birth for the foreign-born population - Other Central America (%)
Place of birth for the foreign-born population - Argentina (%)
Place of birth for the foreign-born population - Bolivia (%)
Place of birth for the foreign-born population - Brazil (%)
Place of birth for the foreign-born population - Chile (%)
Place of birth for the foreign-born population - Colombia (%)
Place of birth for the foreign-born population - Ecuador (%)
Place of birth for the foreign-born population - Guyana (%)
Place of birth for the foreign-born population - Peru (%)
Place of birth for the foreign-born population - Uruguay (%)
Place of birth for the foreign-born population - Venezuela (%)
Place of birth for the foreign-born population - Other South America (%)
Place of birth for the foreign-born population - Canada (%)
Place of birth for the foreign-born population - Other Northern America (%)
Place of birth for the foreign-born population - Other (%)
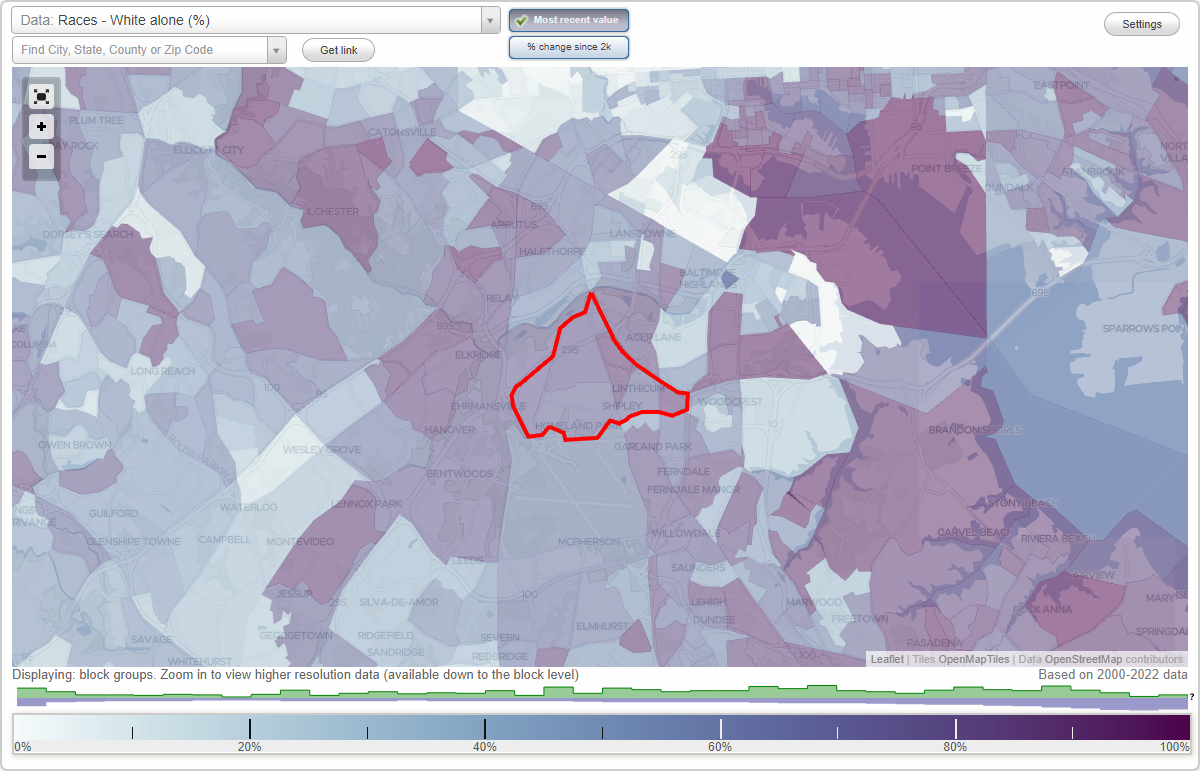
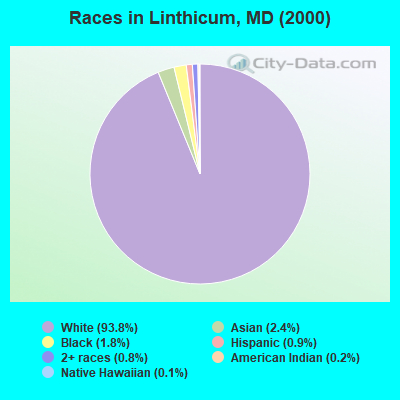
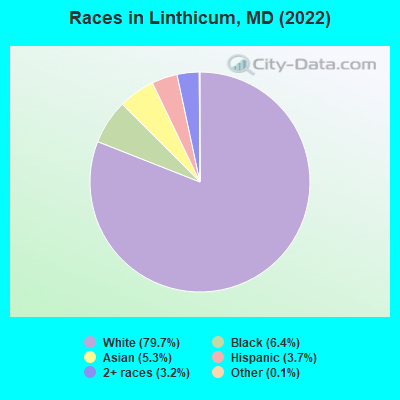
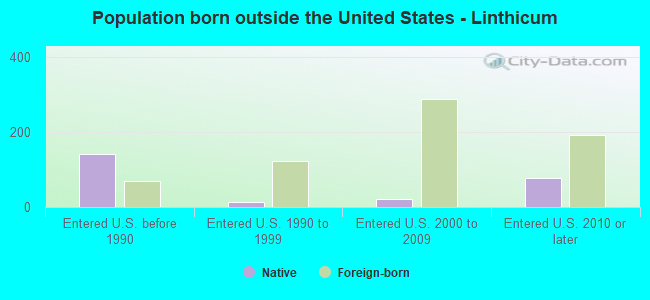
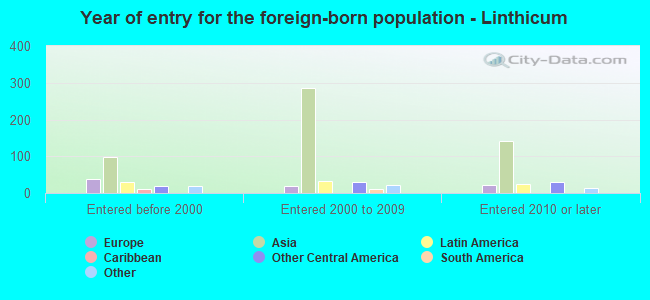
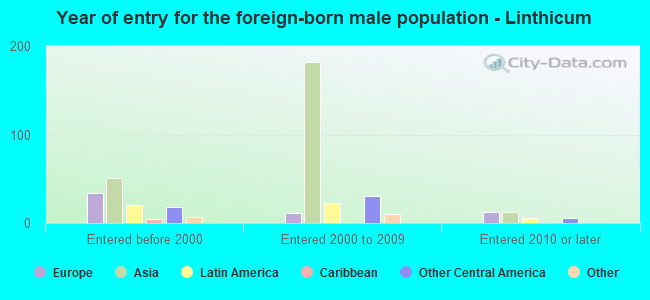
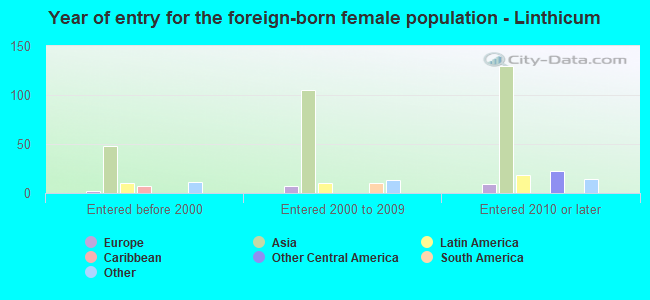
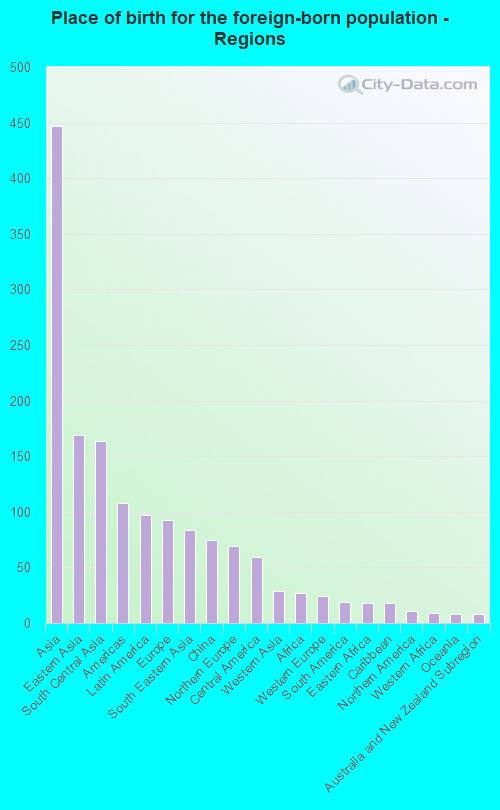
According to 2022 data, the most numerous races in Linthicum, MD are White alone (8,623 residents), Black alone (698 residents), and Hispanic (398 residents). 91.7% of Linthicum residents speak English at home. 6.3% of Linthicum, MD residents are foreign-born (3.9% born in Asia, 0.8% born in Latin America, 0.8% born in Europe), which is 152.5% less than the foreign-born rate of 16.0% across the entire state of Maryland.
Race distribution in Linthicum
2000 2022
3,286,547 62.1% White alone 1,464,735 27.7% Black alone 227,916 4.3% Hispanic 209,738 4.0% Asian alone 82,946 1.6% Two or more races 13,312 0.3% American Indian alone 9,379 0.2% Other race alone 1,913 0.04% Native Hawaiian and Other
2,906,492 47.1% White alone 1,800,914 29.2% Black alone 705,842 11.4% Hispanic 401,818 6.5% Asian alone 291,317 4.7% Two or more races 46,930 0.8% Other race alone 8,930 0.1% American Indian alone 2,417 0.04% Native Hawaiian and Other
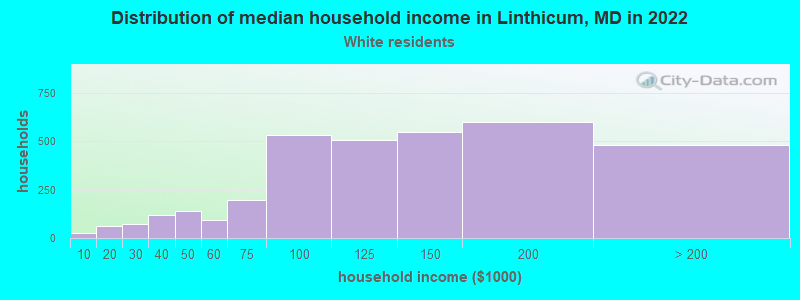
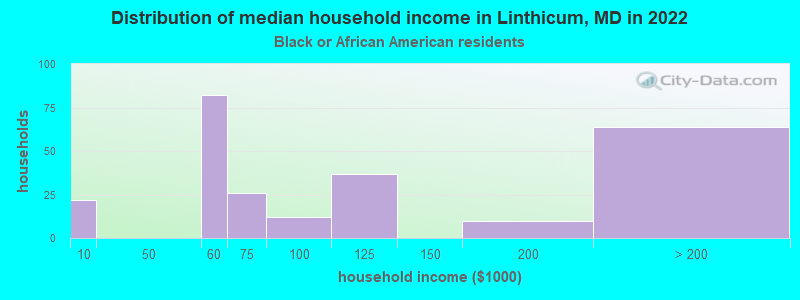
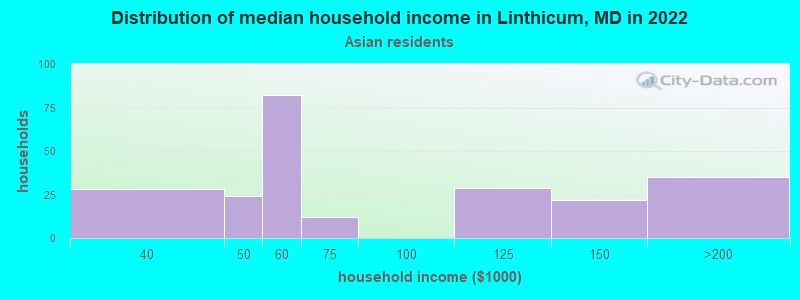
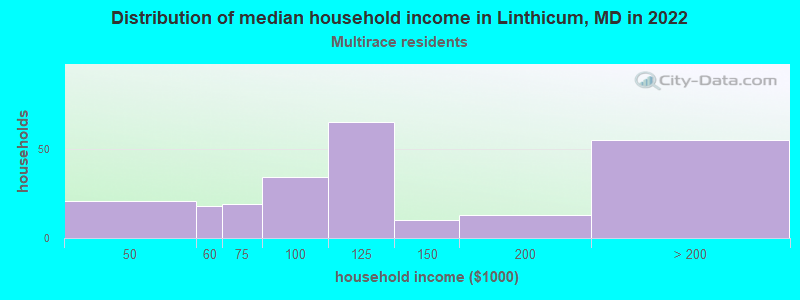
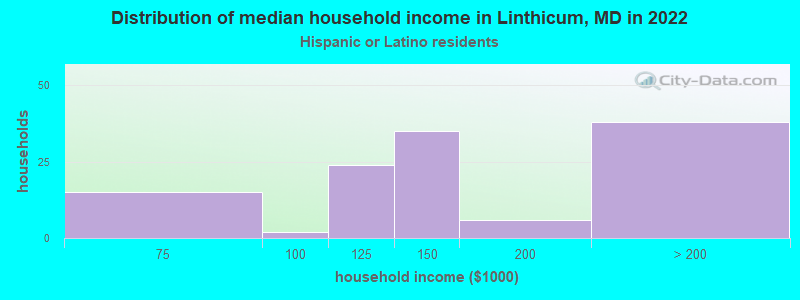
Income and house value in Linthicum Median household income in 2022 $117,438 White non-Hispanic householders$118,344 Two or more races householders$131,644 Hispanic or Latino race householdersMedian 2022 house value $383,516 White Non-Hispanic householders$341,501 Black or African American householders$416,308 American Indian or Alaska Native householders $409,904 Asian householders$416,308 Two or more races householders$576,427 Hispanic or Latino householders
Median age by race in Linthicum
41.4 Median age for White residents38.7 45.6 29.8 Median age for Black or African American residents26.6 34.2 -836,842,104.4 Median age for American Indian / Alaska Native residents-674,418,604.0 -1,072,276,158.6 42.1 Median age for Asian residents40.4 42.6 -534,101,824.6 Median age for Native Hawaiian / Pacific Islander residents-720,061,021.4 -760,942,760.2 3.8 Median age for Other race residents3.0 29.8 27.4 Median age for Two or more races residents28.9 26.1 40.8 Median age for White alone residents38.0 45.0 33.5 Median age for Hispanic or Latino residents34.2 33.8
Owner/renter occupied households by race in Linthicum
House owners and renters - White residents 3,006 86.5% Owner occupied469 13.5% Renter occupiedHouse owners and renters - Black or African American residents 96 38.8% Owner occupied152 61.2% Renter occupiedHouse owners and renters - Asian residents 100 63.2% Owner occupied59 36.8% Renter occupiedHouse owners and renters - Other race residents 3 100.0% Owner occupiedHouse owners and renters - Two or more races residents 148 68.3% Owner occupied69 31.7% Renter occupiedHouse owners and renters - White alone residents 2,999 87.2% Owner occupied441 12.8% Renter occupiedHouse owners and renters - Hispanic or Latino residents 69 59.0% Owner occupied48 41.0% Renter occupied
Language usage in Linthicum
English speakers - Total 91.7% of residents of Linthicum speak English at home.
3.0% of residents speak Spanish at home 158 52.8% Speak English very well141 47.2% Speak English less than very well5.1% of residents speak other language at home 401 77.3% Speak English very well118 22.7% Speak English less than very well
English speakers - Born in the United States 97.7% of residents of Linthicum speak English at home.
0.9% of residents speak Spanish at home 23 100.0% Speak English less than very well1.4% of residents speak other language at home 37 100.0% Speak English very well
English speakers - Native, born elsewhere 52.0% of residents of Linthicum speak English at home.
35.6% of residents speak Spanish at home 59 66.3% Speak English very well30 33.7% Speak English less than very well8.8% of residents speak other language at home 22 100.0% Speak English very well
English speakers - Foreign-born 26.9% of residents of Linthicum speak English at home.
14.3% of residents speak Spanish at home 21 22.1% Speak English very well74 77.9% Speak English less than very well59.2% of residents speak other language at home 295 74.9% Speak English very well99 25.1% Speak English less than very well
White (Caucasian) - Speak only English Native:
98.8% (7,935)Foreign-born:
50.1% (48)
White (Caucasian) - Speak another language Native:
1.6% (125)Foreign-born:
52.3% (50)
Black or African American - Speak only English Native:
98.8% (645)Foreign-born:
30.9% (10)
Black or African American - Speak another language Native:
0.4% (3)Foreign-born:
70.6% (22)
Asian - Speak only English Native:
26.7% (31)Foreign-born:
22.6% (103)
Asian - Speak another language Native:
77.1% (91)Foreign-born:
76.6% (350)
Other race - Speak only English Native:
44.1% (12)Foreign-born:
23.3% (4)
Other race - Speak another language Native:
55.3% (15)Foreign-born:
54.9% (10)
Two or more races - Speak only English Native:
85.1% (426)Foreign-born:
78.2% (24)
Two or more races - Speak another language Native:
12.2% (61)Foreign-born:
44.3% (13)
White alone - Speak only English Native:
98.7% (7,926)Foreign-born:
62.1% (51)
White alone - Speak another language Native:
1.3% (106)Foreign-born:
37.9% (31)
Hispanic or Latino - Speak only English Native:
55.0% (127)Foreign-born:
6.0% (6)
Hispanic or Latino - Speak another language Native:
45.0% (104)Foreign-born:
95.3% (92)
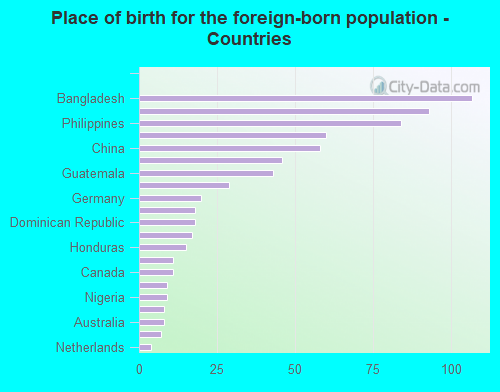
Foreign-born residents in Linthicum 686 residents are foreign born (3.9% Asia , 0.8% Latin America , 0.8% Europe ).
This city:
6.3%Maryland:
15.7%
Marital status for residents in Linthicum Marital status - White (Caucasian) population 15 years and over
Males 31.2% Never married55.5% Now married1.1% Separated3.4% Widowed8.9% DivorcedFemales 18.3% Never married54.4% Now married0.8% Separated10.7% Widowed15.8% DivorcedWomen who gave birth in the past 12 months Now married:
100.0% (41)Unmarried:
0.0% (0)
Women who did not give birth in the past 12 months Now married:
58.4% (971)Unmarried:
41.6% (691)
Marital status - Black or African American population 15 years and over
Males 48.0% Never married4.3% Now married0.4% Separated2.5% Widowed44.8% DivorcedFemales 78.5% Never married18.3% Now married0.0% Separated0.0% Widowed3.1% DivorcedWomen who did not give birth in the past 12 months Now married:
26.5% (32)Unmarried:
73.5% (88)
Marital status - Asian population 15 years and over
Males 26.3% Never married50.0% Now married0.0% Separated0.0% Widowed23.7% DivorcedFemales 34.0% Never married48.0% Now married0.0% Separated18.0% Widowed0.0% DivorcedWomen who did not give birth in the past 12 months Now married:
51.7% (101)Unmarried:
48.3% (95)
Marital status - Other race population 15 years and over
Males 0.0% Never married100.0% Now married0.0% Separated0.0% Widowed0.0% DivorcedFemales 32.4% Never married67.6% Now married0.0% Separated0.0% Widowed0.0% DivorcedWomen who gave birth in the past 12 months Now married:
100.0% (15)Unmarried:
0.0% (0)
Women who did not give birth in the past 12 months Now married:
50.0% (14)Unmarried:
50.0% (14)
Marital status - Two or more races population 15 years and over
Males 41.8% Never married58.2% Now married0.0% Separated0.0% Widowed0.0% DivorcedFemales 51.0% Never married43.4% Now married0.0% Separated0.0% Widowed5.6% DivorcedWomen who did not give birth in the past 12 months Now married:
42.0% (100)Unmarried:
58.0% (138)
Marital status - White alone, not Hispanic / Latino population 15 years and over
Males 30.9% Never married55.3% Now married1.2% Separated3.5% Widowed9.1% DivorcedFemales 18.5% Never married54.3% Now married0.8% Separated10.8% Widowed15.6% DivorcedWomen who gave birth in the past 12 months Now married:
100.0% (42)Unmarried:
0.0% (0)
Women who did not give birth in the past 12 months Now married:
58.8% (997)Unmarried:
41.2% (699)
Marital status - Hispanic or Latino population 15 years and over
Males 42.5% Never married57.5% Now married0.0% Separated0.0% Widowed0.0% DivorcedFemales 13.9% Never married75.2% Now married0.0% Separated0.0% Widowed10.9% DivorcedWomen who gave birth in the past 12 months Now married:
100.0% (14)Unmarried:
0.0% (0)
Women who did not give birth in the past 12 months Now married:
55.4% (35)Unmarried:
44.6% (28)
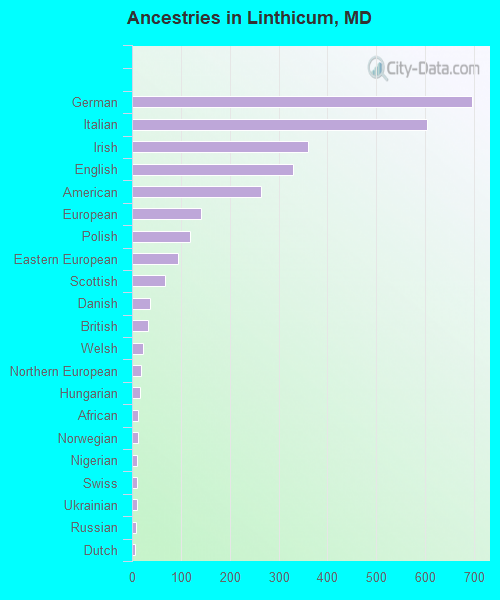
Ancestries in Linthicum
696 16.9% German603 14.6% Italian360 8.7% Irish330 8.0% English265 6.4% American141 3.4% European119 2.9% Polish95 2.3% Eastern European67 1.6% Scottish37 0.9% Danish32 0.8% British22 0.5% Welsh18 0.4% Northern European16 0.4% Hungarian13 0.3% African12 0.3% Norwegian11 0.3% Nigerian11 0.3% Swiss11 0.3% Ukrainian8 0.2% Russian7 0.2% Dutch6 0.1% Lithuanian6 0.1% Slovak2 0.05% Yugoslavian1 0.02% French Canadian
Children Nativity (place of birth) in Linthicum
Children under 6 years - Living with two parents Both parents native 726 100.0% NativeBoth parents foreign-born 23 100.0% NativeOne native, one foreign-born parent 5 100.0% NativeChildren under 6 years - Living with one parent Native parent 59 100.0% NativeChildren 6 to 17 years - Living with two parents Both parents native 995 100.0% NativeBoth parents foreign-born 77 58.2% Native55 41.8% Foreign-bornOne native, one foreign-born parent 80 100.0% NativeChildren 6 to 17 years - Living with one parent Native parent 362 100.0% NativeForeign-born parent 4 52.0% Native4 48.0% Foreign-born
Grandparents responsible for own grandchildren in Linthicum
Grandparents (30 to 59 years) White / Caucasian 13 100.0% Not responsible for grandchildrenWhite alone, not Hispanic / Latino 14 100.0% Not responsible for grandchildren
Grandparents (60 years and over) White / Caucasian 2 2.7% Responsible for grandchildren88 97.3% Not responsible for grandchildrenWhite alone, not Hispanic / Latino 3 2.8% Responsible for grandchildren90 97.2% Not responsible for grandchildren