Races in Loma Linda, Missouri (MO) Detailed Stats
Data:
Races - White alone (%)
Races - White alone (% change since 2000)
Races - Black alone (%)
Races - Black alone (% change since 2000)
Races - American Indian alone (%)
Races - American Indian alone (% change since 2000)
Races - Asian alone (%)
Races - Asian alone (% change since 2000)
Races - Hispanic (%)
Races - Hispanic (% change since 2000)
Races - Native Hawaiian and Other Pacific Islander alone (%)
Races - Native Hawaiian and Other Pacific Islander alone (% change since 2000)
Races - Two or more races(%)
Races - Two or more races(% change since 2000)
Races - Other race alone (%)
Races - Other race alone (% change since 2000)
Racial diversity
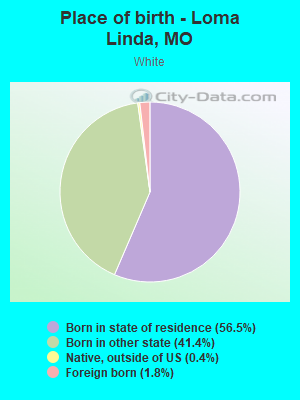
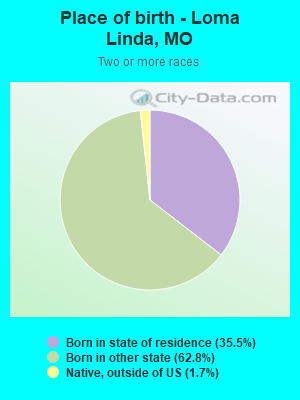
Place of birth - Born in state of residence (%)
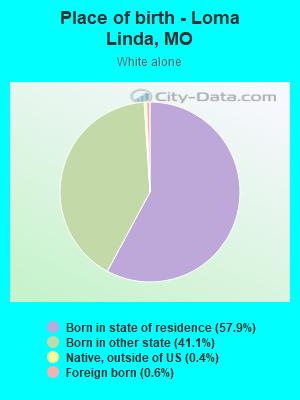
Place of birth - Born in state of residence (%) - White
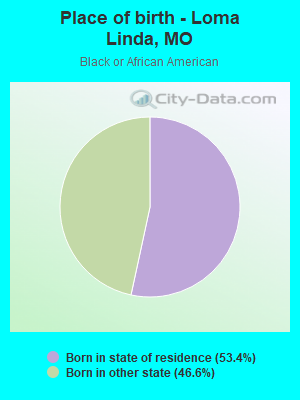
Place of birth - Born in state of residence (%) - Black or African American
Place of birth - Born in state of residence (%) - Asian
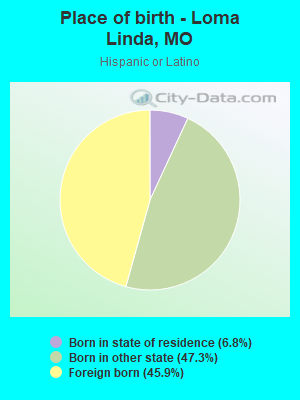
Place of birth - Born in state of residence (%) - Hispanic or Latino
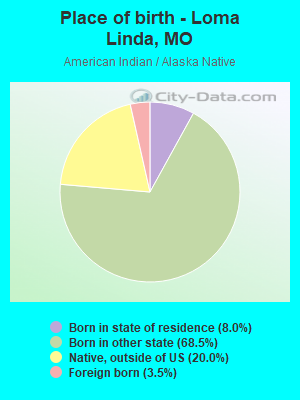
Place of birth - Born in state of residence (%) - American Indian and Alaska Native
Place of birth - Born in state of residence (%) - Multirace
Place of birth - Born in state of residence (%) - Other Race
Place of birth - Born in other state (%)
Place of birth - Born in other state (%) - White
Place of birth - Born in other state (%) - Black or African American
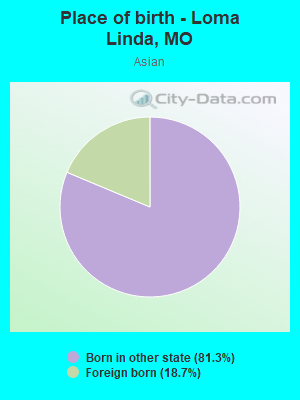
Place of birth - Born in other state (%) - Asian
Place of birth - Born in other state (%) - Hispanic or Latino
Place of birth - Born in other state (%) - American Indian and Alaska Native
Place of birth - Born in other state (%) - Multirace
Place of birth - Born in other state (%) - Other Race
Place of birth - Native, outside of US (%)
Place of birth - Native, outside of US (%) - White
Place of birth - Native, outside of US (%) - Black or African American
Place of birth - Native, outside of US (%) - Asian
Place of birth - Native, outside of US (%) - Hispanic or Latino
Place of birth - Native, outside of US (%) - American Indian and Alaska Native
Place of birth - Native, outside of US (%) - Multirace
Place of birth - Native, outside of US (%) - Other Race
Place of birth - Foreign born (%)
Place of birth - Foreign born (%) - White
Place of birth - Foreign born (%) - Black or African American
Place of birth - Foreign born (%) - Asian
Place of birth - Foreign born (%) - Hispanic or Latino
Place of birth - Foreign born (%) - American Indian and Alaska Native
Place of birth - Foreign born (%) - Multirace
Place of birth - Foreign born (%) - Other Race
Residents speaking English at home (%)
Residents speaking English at home - Born in the United States (%)
Residents speaking English at home - Native, born elsewhere (%)
Residents speaking English at home - Foreign born (%)
Residents speaking Spanish at home (%)
Residents speaking Spanish at home - Born in the United States (%)
Residents speaking Spanish at home - Native, born elsewhere (%)
Residents speaking Spanish at home - Foreign born (%)
Residents speaking other language at home (%)
Residents speaking other language at home - Born in the United States (%)
Residents speaking other language at home - Native, born elsewhere (%)
Residents speaking other language at home - Foreign born (%)
Marital status - Never married (%)
Marital status - Now married (%)
Marital status - Separated (%)
Marital status - Widowed (%)
Marital status - Divorced (%)
Ancestries Reported - Arab (%)
Ancestries Reported - Czech (%)
Ancestries Reported - Danish (%)
Ancestries Reported - Dutch (%)
Ancestries Reported - English (%)
Ancestries Reported - French (%)
Ancestries Reported - French Canadian (%)
Ancestries Reported - German (%)
Ancestries Reported - Greek (%)
Ancestries Reported - Hungarian (%)
Ancestries Reported - Irish (%)
Ancestries Reported - Italian (%)
Ancestries Reported - Lithuanian (%)
Ancestries Reported - Norwegian (%)
Ancestries Reported - Polish (%)
Ancestries Reported - Portuguese (%)
Ancestries Reported - Russian (%)
Ancestries Reported - Scotch-Irish (%)
Ancestries Reported - Scottish (%)
Ancestries Reported - Slovak (%)
Ancestries Reported - Subsaharan African (%)
Ancestries Reported - Swedish (%)
Ancestries Reported - Swiss (%)
Ancestries Reported - Ukrainian (%)
Ancestries Reported - United States (%)
Ancestries Reported - Welsh (%)
Ancestries Reported - West Indian (%)
Ancestries Reported - Other (%)
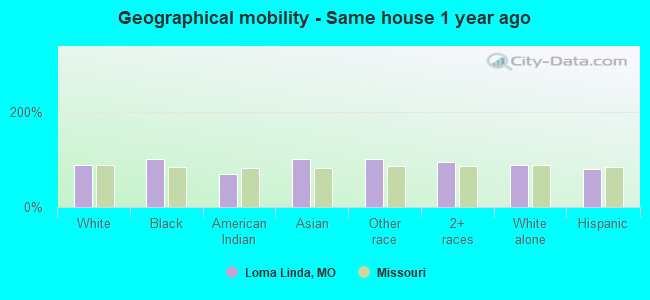
Geographical mobility - Same house 1 year ago (%)
Geographical mobility - Same house 1 year ago (%) - White
Geographical mobility - Same house 1 year ago (%) - Black or African American
Geographical mobility - Same house 1 year ago (%) - Asian
Geographical mobility - Same house 1 year ago (%) - Hispanic or Latino
Geographical mobility - Same house 1 year ago (%) - American Indian and Alaska Native
Geographical mobility - Same house 1 year ago (%) - Multirace
Geographical mobility - Same house 1 year ago (%) - Other Race
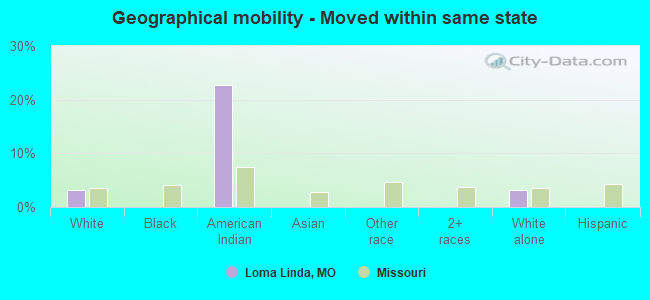
Geographical mobility - Moved within same county (%)
Geographical mobility - Moved within same county (%) - White
Geographical mobility - Moved within same county (%) - Black or African American
Geographical mobility - Moved within same county (%) - Asian
Geographical mobility - Moved within same county (%) - Hispanic or Latino
Geographical mobility - Moved within same county (%) - American Indian and Alaska Native
Geographical mobility - Moved within same county (%) - Multirace
Geographical mobility - Moved within same county (%) - Other Race
Geographical mobility - Moved from different county within same state (%)
Geographical mobility - Moved from different county within same state (%) - White
Geographical mobility - Moved from different county within same state (%) - Black or African American
Geographical mobility - Moved from different county within same state (%) - Asian
Geographical mobility - Moved from different county within same state (%) - Hispanic or Latino
Geographical mobility - Moved from different county within same state (%) - American Indian and Alaska Native
Geographical mobility - Moved from different county within same state (%) - Multirace
Geographical mobility - Moved from different county within same state (%) - Other Race
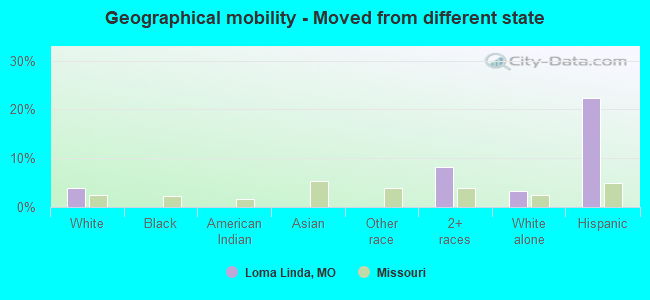
Geographical mobility - Moved from different state (%)
Geographical mobility - Moved from different state (%) - White
Geographical mobility - Moved from different state (%) - Black or African American
Geographical mobility - Moved from different state (%) - Asian
Geographical mobility - Moved from different state (%) - Hispanic or Latino
Geographical mobility - Moved from different state (%) - American Indian and Alaska Native
Geographical mobility - Moved from different state (%) - Multirace
Geographical mobility - Moved from different state (%) - Other Race
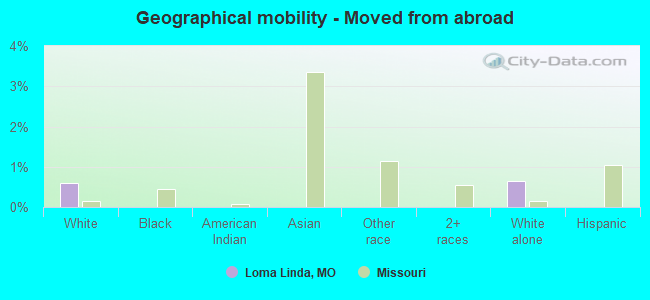
Geographical mobility - Moved from abroad (%)
Geographical mobility - Moved from abroad (%) - White
Geographical mobility - Moved from abroad (%) - Black or African American
Geographical mobility - Moved from abroad (%) - Asian
Geographical mobility - Moved from abroad (%) - Hispanic or Latino
Geographical mobility - Moved from abroad (%) - American Indian and Alaska Native
Geographical mobility - Moved from abroad (%) - Multirace
Geographical mobility - Moved from abroad (%) - Other Race
Place of birth for the foreign-born population - Ireland (%)
Place of birth for the foreign-born population - Denmark (%)
Place of birth for the foreign-born population - Norway (%)
Place of birth for the foreign-born population - Sweden (%)
Place of birth for the foreign-born population - United Kingdom (%)
Place of birth for the foreign-born population - England (%)
Place of birth for the foreign-born population - Scotland (%)
Place of birth for the foreign-born population - Other Northern Europe (%)
Place of birth for the foreign-born population - Austria (%)
Place of birth for the foreign-born population - Belgium (%)
Place of birth for the foreign-born population - France (%)
Place of birth for the foreign-born population - Germany (%)
Place of birth for the foreign-born population - Netherlands (%)
Place of birth for the foreign-born population - Switzerland (%)
Place of birth for the foreign-born population - Other Western Europe (%)
Place of birth for the foreign-born population - Greece (%)
Place of birth for the foreign-born population - Italy (%)
Place of birth for the foreign-born population - Portugal (%)
Place of birth for the foreign-born population - Spain (%)
Place of birth for the foreign-born population - Other Southern Europe (%)
Place of birth for the foreign-born population - Albania (%)
Place of birth for the foreign-born population - Belarus (%)
Place of birth for the foreign-born population - Bosnia and Herzegovina (%)
Place of birth for the foreign-born population - Bulgaria (%)
Place of birth for the foreign-born population - Croatia (%)
Place of birth for the foreign-born population - Czechoslovakia (%)
Place of birth for the foreign-born population - Hungary (%)
Place of birth for the foreign-born population - Latvia (%)
Place of birth for the foreign-born population - Lithuania (%)
Place of birth for the foreign-born population - North Macedonia (Macedonia) (%)
Place of birth for the foreign-born population - Moldova (%)
Place of birth for the foreign-born population - Poland (%)
Place of birth for the foreign-born population - Romania (%)
Place of birth for the foreign-born population - Russia (%)
Place of birth for the foreign-born population - Serbia (%)
Place of birth for the foreign-born population - Ukraine (%)
Place of birth for the foreign-born population - Other Eastern Europe (%)
Place of birth for the foreign-born population - China (%)
Place of birth for the foreign-born population - Hong Kong (%)
Place of birth for the foreign-born population - Taiwan (%)
Place of birth for the foreign-born population - Japan (%)
Place of birth for the foreign-born population - Korea (%)
Place of birth for the foreign-born population - Other Eastern Asia (%)
Place of birth for the foreign-born population - Afghanistan (%)
Place of birth for the foreign-born population - Bangladesh (%)
Place of birth for the foreign-born population - India (%)
Place of birth for the foreign-born population - Iran (%)
Place of birth for the foreign-born population - Kazakhstan (%)
Place of birth for the foreign-born population - Nepal (%)
Place of birth for the foreign-born population - Pakistan (%)
Place of birth for the foreign-born population - Sri Lanka (%)
Place of birth for the foreign-born population - Uzbekistan (%)
Place of birth for the foreign-born population - Other South Central Asia (%)
Place of birth for the foreign-born population - Burma (%)
Place of birth for the foreign-born population - Cambodia (%)
Place of birth for the foreign-born population - Indonesia (%)
Place of birth for the foreign-born population - Laos (%)
Place of birth for the foreign-born population - Malaysia (%)
Place of birth for the foreign-born population - Philippines (%)
Place of birth for the foreign-born population - Singapore (%)
Place of birth for the foreign-born population - Thailand (%)
Place of birth for the foreign-born population - Vietnam (%)
Place of birth for the foreign-born population - Other South Eastern Asia (%)
Place of birth for the foreign-born population - Armenia (%)
Place of birth for the foreign-born population - Iraq (%)
Place of birth for the foreign-born population - Israel (%)
Place of birth for the foreign-born population - Jordan (%)
Place of birth for the foreign-born population - Kuwait (%)
Place of birth for the foreign-born population - Lebanon (%)
Place of birth for the foreign-born population - Saudi Arabia (%)
Place of birth for the foreign-born population - Syria (%)
Place of birth for the foreign-born population - Turkey (%)
Place of birth for the foreign-born population - Yemen (%)
Place of birth for the foreign-born population - Other Western Asia (%)
Place of birth for the foreign-born population - Eritrea (%)
Place of birth for the foreign-born population - Ethiopia (%)
Place of birth for the foreign-born population - Kenya (%)
Place of birth for the foreign-born population - Somalia (%)
Place of birth for the foreign-born population - Uganda (%)
Place of birth for the foreign-born population - Zimbabwe (%)
Place of birth for the foreign-born population - Other Eastern Africa (%)
Place of birth for the foreign-born population - Cameroon (%)
Place of birth for the foreign-born population - Congo (%)
Place of birth for the foreign-born population - Democratic Republic of Congo (Zaire) (%)
Place of birth for the foreign-born population - Other Middle Africa (%)
Place of birth for the foreign-born population - Egypt (%)
Place of birth for the foreign-born population - Morocco (%)
Place of birth for the foreign-born population - Sudan (%)
Place of birth for the foreign-born population - Other Northern Africa (%)
Place of birth for the foreign-born population - South Africa (%)
Place of birth for the foreign-born population - Other Southern Africa (%)
Place of birth for the foreign-born population - Cabo Verde (%)
Place of birth for the foreign-born population - Ghana (%)
Place of birth for the foreign-born population - Liberia (%)
Place of birth for the foreign-born population - Nigeria (%)
Place of birth for the foreign-born population - Senegal (%)
Place of birth for the foreign-born population - Sierra Leone (%)
Place of birth for the foreign-born population - Other Western Africa (%)
Place of birth for the foreign-born population - Australia (%)
Place of birth for the foreign-born population - New Zealand (%)
Place of birth for the foreign-born population - Fiji (%)
Place of birth for the foreign-born population - Micronesia (%)
Place of birth for the foreign-born population - Bahamas (%)
Place of birth for the foreign-born population - Barbados (%)
Place of birth for the foreign-born population - Cuba (%)
Place of birth for the foreign-born population - Dominica (%)
Place of birth for the foreign-born population - Dominican Republic (%)
Place of birth for the foreign-born population - Grenada (%)
Place of birth for the foreign-born population - Haiti (%)
Place of birth for the foreign-born population - Jamaica (%)
Place of birth for the foreign-born population - St. Vincent and the Grenadines (%)
Place of birth for the foreign-born population - Trinidad and Tobago (%)
Place of birth for the foreign-born population - West Indies (%)
Place of birth for the foreign-born population - Other Caribbean (%)
Place of birth for the foreign-born population - Belize (%)
Place of birth for the foreign-born population - Costa Rica (%)
Place of birth for the foreign-born population - El Salvador (%)
Place of birth for the foreign-born population - Guatemala (%)
Place of birth for the foreign-born population - Honduras (%)
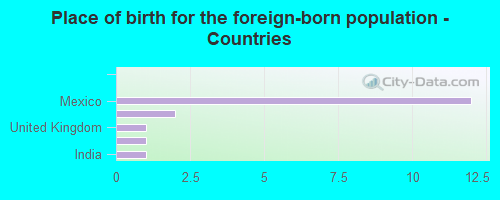
Place of birth for the foreign-born population - Mexico (%)
Place of birth for the foreign-born population - Nicaragua (%)
Place of birth for the foreign-born population - Panama (%)
Place of birth for the foreign-born population - Other Central America (%)
Place of birth for the foreign-born population - Argentina (%)
Place of birth for the foreign-born population - Bolivia (%)
Place of birth for the foreign-born population - Brazil (%)
Place of birth for the foreign-born population - Chile (%)
Place of birth for the foreign-born population - Colombia (%)
Place of birth for the foreign-born population - Ecuador (%)
Place of birth for the foreign-born population - Guyana (%)
Place of birth for the foreign-born population - Peru (%)
Place of birth for the foreign-born population - Uruguay (%)
Place of birth for the foreign-born population - Venezuela (%)
Place of birth for the foreign-born population - Other South America (%)
Place of birth for the foreign-born population - Canada (%)
Place of birth for the foreign-born population - Other Northern America (%)
Place of birth for the foreign-born population - Other (%)
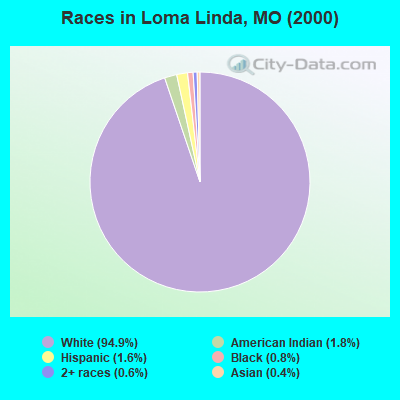
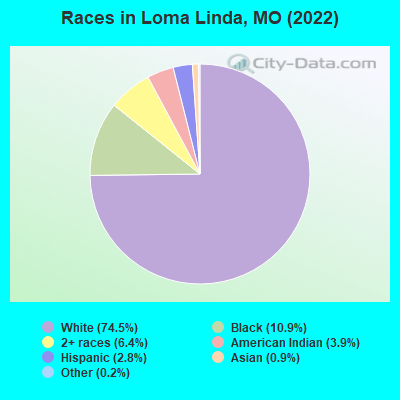
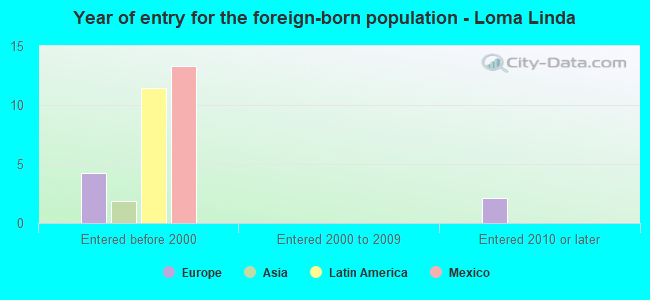
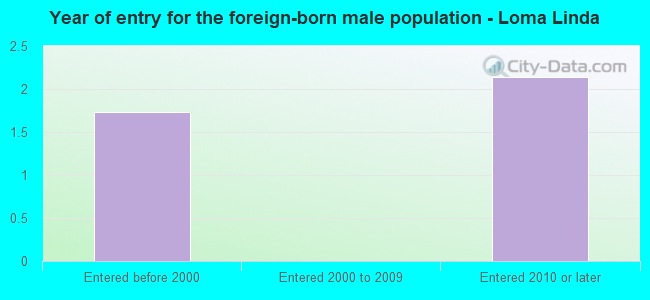
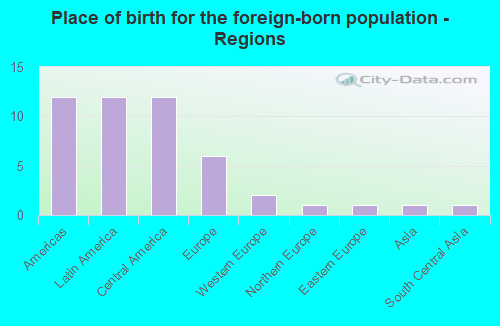
According to 2022 data, the most numerous races in Loma Linda, MO are White alone (737 residents), Black alone (108 residents), and Two or more races (63 residents). 98.4% of Loma Linda residents speak English at home. 2.1% of Loma Linda, MO residents are foreign-born (1.3% born in Latin America, 0.7% born in Europe), which is 88.6% less than the foreign-born rate of 4.0% across the entire state of Missouri.
Race distribution in Loma Linda
2000 2022
4,686,474 83.8% White alone 625,667 11.2% Black alone 118,592 2.1% Hispanic 71,905 1.3% Two or more races 61,041 1.1% Asian alone 23,302 0.4% American Indian alone 5,291 0.09% Other race alone 2,939 0.05% Native Hawaiian and Other
4,733,411 76.6% White alone 656,739 10.6% Black alone 316,300 5.1% Two or more races 291,763 4.7% Hispanic 132,436 2.1% Asian alone 27,467 0.4% Other race alone 12,313 0.2% American Indian alone 7,528 0.1% Native Hawaiian and Other
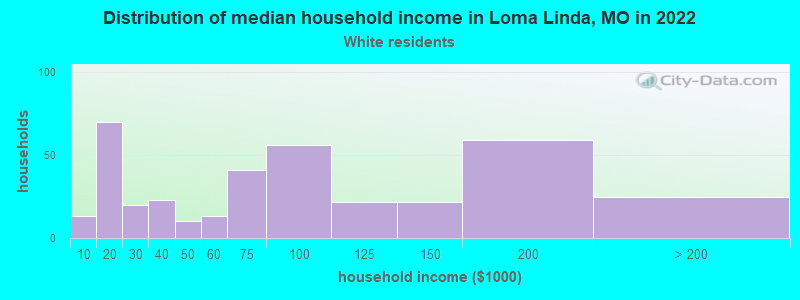
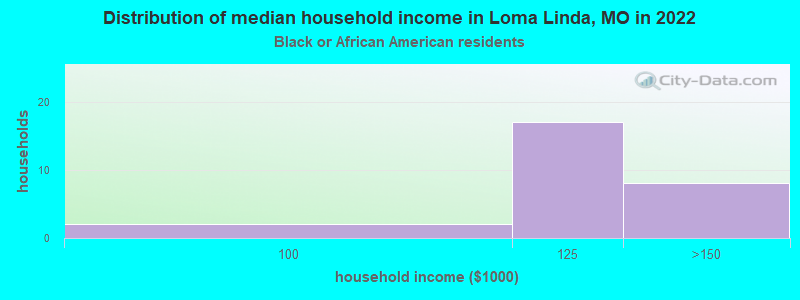
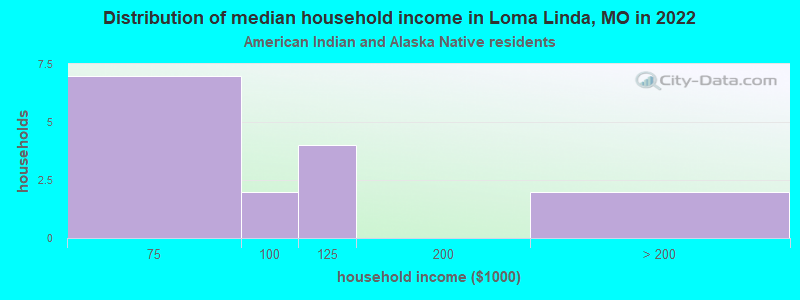
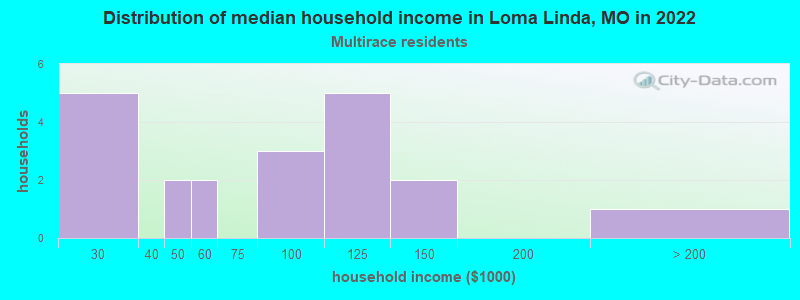
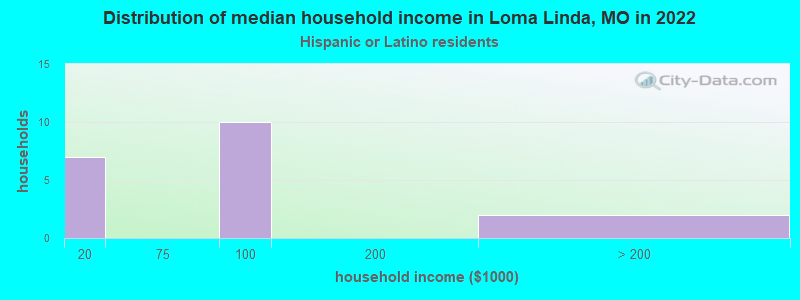
Income and house value in Loma Linda Median household income in 2022 $70,622 White non-Hispanic householders$107,060 Black householders$111,026 American Indian and Alaska Native householders$87,631 Hispanic or Latino race householdersMedian 2022 house value $267,347 White Non-Hispanic householders$257,064 Black or African American householders$278,486 American Indian or Alaska Native householders$599,817 Hispanic or Latino householders
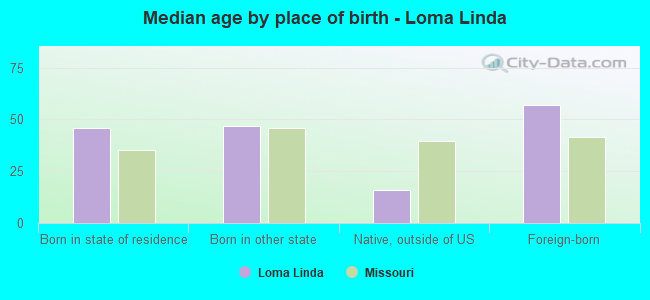
Median age by race in Loma Linda
48.1 Median age for White residents46.0 52.0 28.6 Median age for Black or African American residents21.7 28.7 34.8 Median age for American Indian / Alaska Native residents37.7 33.1 -670,509,125.2 Median age for Asian residents-676,616,914.7 -666,666,666.0 -693,430,656.2 Median age for Native Hawaiian / Pacific Islander residents-683,513,838.1 -752,136,751.4 -693,236,714.3 Median age for Other race residents-694,252,872.9 -684,343,433.7 34.1 Median age for Two or more races residents34.6 35.9 47.7 Median age for White alone residents46.1 51.4 52.4 Median age for Hispanic or Latino residents32.5 51.7
Owner/renter occupied households by race in Loma Linda
House owners and renters - White residents 311 82.4% Owner occupied67 17.6% Renter occupiedHouse owners and renters - Black or African American residents 20 74.6% Owner occupied7 25.4% Renter occupiedHouse owners and renters - American Indian / Alaska Native residents 13 100.0% Owner occupiedHouse owners and renters - Asian residents 8 100.0% Renter occupiedHouse owners and renters - Two or more races residents 9 51.0% Owner occupied9 49.0% Renter occupiedHouse owners and renters - White alone residents 295 81.4% Owner occupied67 18.6% Renter occupiedHouse owners and renters - Hispanic or Latino residents 21 100.0% Owner occupied
Language usage in Loma Linda
English speakers - Total 98.4% of residents of Loma Linda speak English at home.
0.9% of residents speak Spanish at home 8 100.0% Speak English very well0.6% of residents speak other language at home 6 100.0% Speak English very well
English speakers - Born in the United States 99.1% of residents of Loma Linda speak English at home.
0.2% of residents speak Spanish at home 1 100.0% Speak English very well0.2% of residents speak other language at home 1 100.0% Speak English very well
All residents speak only English at home
English speakers - Foreign-born 47.6% of residents of Loma Linda speak English at home.
28.6% of residents speak Spanish at home 6 100.0% Speak English very well14.3% of residents speak other language at home 3 100.0% Speak English very well
White (Caucasian) - Speak only English Native:
99.8% (722)Foreign-born:
51.2% (7)
White (Caucasian) - Speak another language Native:
0.4% (3)Foreign-born:
49.5% (7)
Asian - Speak only English Native:
100.0% (9)Foreign-born:
99.3% (2)
White alone - Speak only English Native:
99.7% (722)Foreign-born:
52.5% (2)
White alone - Speak another language Native:
0.3% (2)Foreign-born:
42.8% (2)
Hispanic or Latino - Speak only English Native:
89.4% (8)Foreign-born:
48.4% (6)
Hispanic or Latino - Speak another language Native:
12.0% (1)Foreign-born:
53.5% (7)
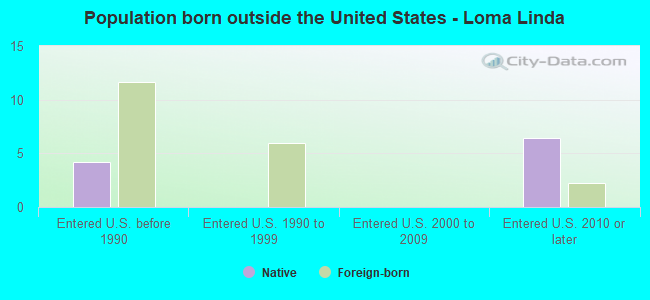
Foreign-born residents in Loma Linda 21 residents are foreign born (1.3% Latin America , 0.7% Europe ).
This city:
2.1%Missouri:
4.2%
Marital status for residents in Loma Linda Marital status - White (Caucasian) population 15 years and over
Males 13.8% Never married54.4% Now married1.7% Separated3.9% Widowed26.2% DivorcedFemales 24.6% Never married61.2% Now married0.0% Separated7.3% Widowed6.9% DivorcedWomen who gave birth in the past 12 months Now married:
100.0% (2)Unmarried:
0.0% (0)
Women who did not give birth in the past 12 months Now married:
42.6% (54)Unmarried:
57.4% (72)
Marital status - Black or African American population 15 years and over
Males 0.0% Never married100.0% Now married0.0% Separated0.0% Widowed0.0% DivorcedFemales 58.0% Never married42.0% Now married0.0% Separated0.0% Widowed0.0% DivorcedWomen who gave birth in the past 12 months Now married:
0.0% (0)Unmarried:
100.0% (27)
Marital status - American Indian / Alaska Native population 15 years and over
Males 16.7% Never married83.3% Now married0.0% Separated0.0% Widowed0.0% DivorcedFemales 17.4% Never married60.9% Now married0.0% Separated0.0% Widowed21.7% DivorcedWomen who did not give birth in the past 12 months Now married:
60.9% (14)Unmarried:
39.1% (9)
Marital status - Asian population 15 years and over
Males 100.0% Never married0.0% Now married0.0% Separated0.0% Widowed0.0% DivorcedFemales 0.0% Never married100.0% Now married0.0% Separated0.0% Widowed0.0% DivorcedWomen who did not give birth in the past 12 months Now married:
100.0% (2)Unmarried:
0.0% (0)
Marital status - Two or more races population 15 years and over
Males 23.1% Never married69.2% Now married7.7% Separated0.0% Widowed0.0% DivorcedFemales 31.8% Never married50.0% Now married0.0% Separated13.6% Widowed4.5% DivorcedWomen who did not give birth in the past 12 months Now married:
58.8% (14)Unmarried:
41.2% (10)
Marital status - White alone, not Hispanic / Latino population 15 years and over
Males 14.0% Never married54.7% Now married1.7% Separated3.9% Widowed25.7% DivorcedFemales 23.7% Never married63.8% Now married0.0% Separated5.3% Widowed7.2% DivorcedWomen who gave birth in the past 12 months Now married:
100.0% (2)Unmarried:
0.0% (0)
Women who did not give birth in the past 12 months Now married:
42.6% (54)Unmarried:
57.4% (73)
Marital status - Hispanic or Latino population 15 years and over
Males 25.0% Never married37.5% Now married0.0% Separated0.0% Widowed37.5% DivorcedFemales 46.2% Never married0.0% Now married0.0% Separated53.8% Widowed0.0% Divorced
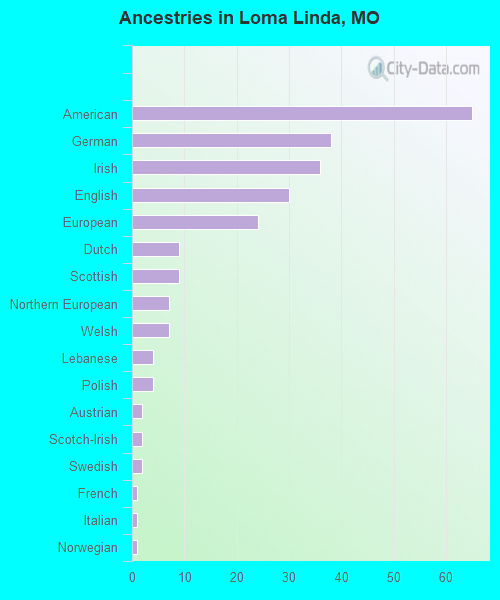
Ancestries in Loma Linda
65 14.2% American38 8.3% German36 7.9% Irish30 6.6% English24 5.3% European9 2.0% Dutch9 2.0% Scottish7 1.5% Northern European7 1.5% Welsh4 0.9% Lebanese4 0.9% Polish2 0.4% Austrian2 0.4% Scotch-Irish2 0.4% Swedish1 0.2% French1 0.2% Italian1 0.2% Norwegian
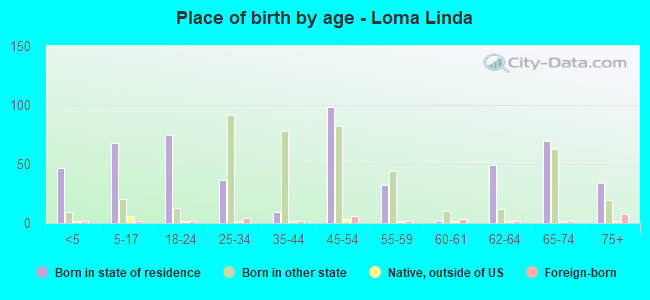
Children Nativity (place of birth) in Loma Linda
Children under 6 years - Living with two parents Both parents native 28 100.0% NativeOne native, one foreign-born parent 2 100.0% NativeChildren under 6 years - Living with one parent Native parent 31 100.0% Native
Children 6 to 17 years - Living with two parents Both parents native 70 100.0% NativeChildren 6 to 17 years - Living with one parent Native parent 17 100.0% Native
Grandparents responsible for own grandchildren in Loma Linda
Grandparents (30 to 59 years) White / Caucasian 6 100.0% Not responsible for grandchildrenBlack or African American 27 100.0% Responsible for grandchildrenWhite alone, not Hispanic / Latino 6 100.0% Not responsible for grandchildren
Grandparents (60 years and over)