Races in Loveland, Colorado (CO) Detailed Stats
Data:
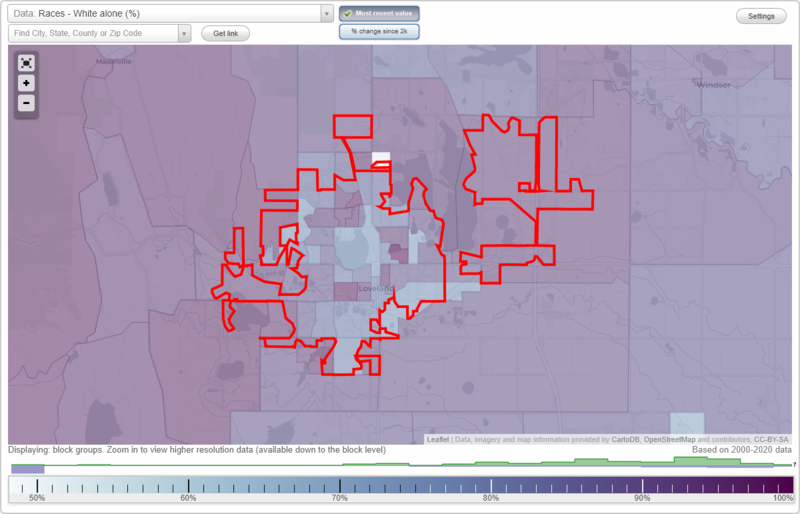
Races - White alone (%)
Races - White alone (% change since 2000)
Races - Black alone (%)
Races - Black alone (% change since 2000)
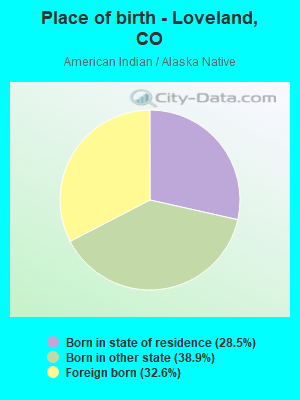
Races - American Indian alone (%)
Races - American Indian alone (% change since 2000)
Races - Asian alone (%)
Races - Asian alone (% change since 2000)
Races - Hispanic (%)
Races - Hispanic (% change since 2000)
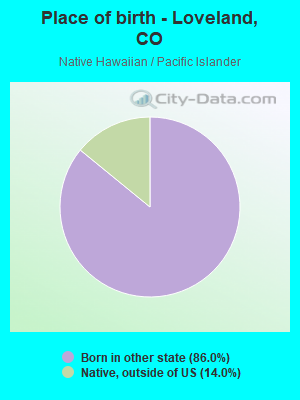
Races - Native Hawaiian and Other Pacific Islander alone (%)
Races - Native Hawaiian and Other Pacific Islander alone (% change since 2000)
Races - Two or more races(%)
Races - Two or more races(% change since 2000)
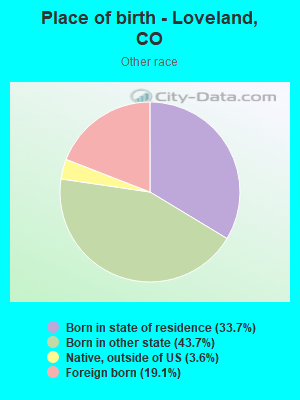
Races - Other race alone (%)
Races - Other race alone (% change since 2000)
Racial diversity
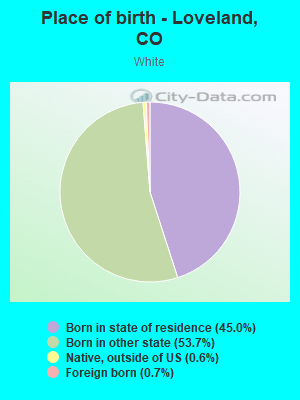
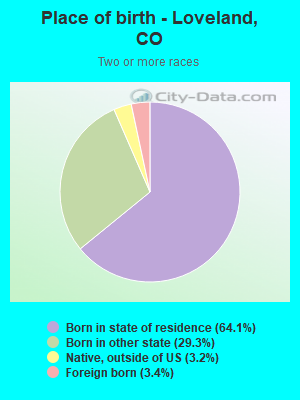
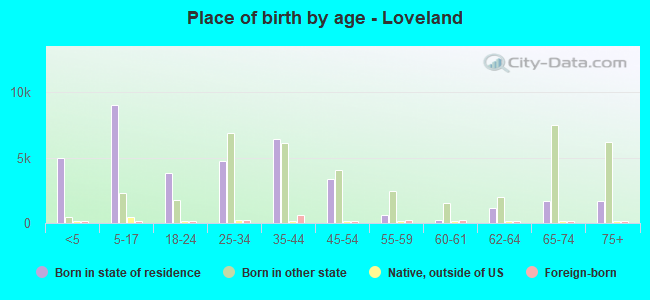
Place of birth - Born in state of residence (%)
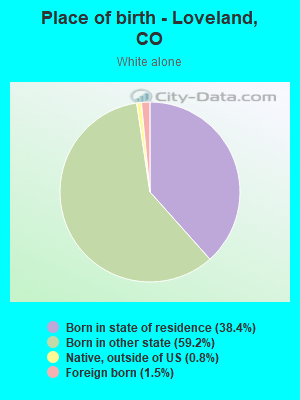
Place of birth - Born in state of residence (%) - White
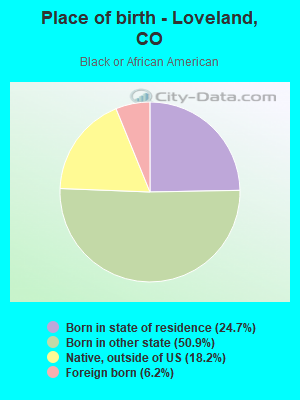
Place of birth - Born in state of residence (%) - Black or African American
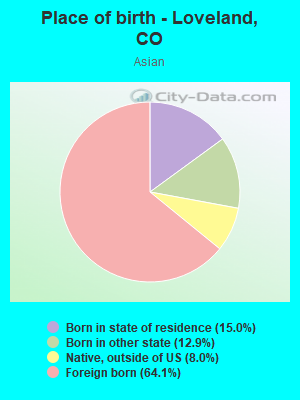
Place of birth - Born in state of residence (%) - Asian
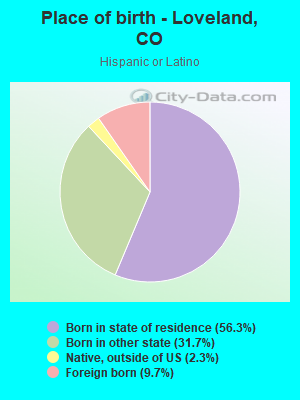
Place of birth - Born in state of residence (%) - Hispanic or Latino
Place of birth - Born in state of residence (%) - American Indian and Alaska Native
Place of birth - Born in state of residence (%) - Multirace
Place of birth - Born in state of residence (%) - Other Race
Place of birth - Born in other state (%)
Place of birth - Born in other state (%) - White
Place of birth - Born in other state (%) - Black or African American
Place of birth - Born in other state (%) - Asian
Place of birth - Born in other state (%) - Hispanic or Latino
Place of birth - Born in other state (%) - American Indian and Alaska Native
Place of birth - Born in other state (%) - Multirace
Place of birth - Born in other state (%) - Other Race
Place of birth - Native, outside of US (%)
Place of birth - Native, outside of US (%) - White
Place of birth - Native, outside of US (%) - Black or African American
Place of birth - Native, outside of US (%) - Asian
Place of birth - Native, outside of US (%) - Hispanic or Latino
Place of birth - Native, outside of US (%) - American Indian and Alaska Native
Place of birth - Native, outside of US (%) - Multirace
Place of birth - Native, outside of US (%) - Other Race
Place of birth - Foreign born (%)
Place of birth - Foreign born (%) - White
Place of birth - Foreign born (%) - Black or African American
Place of birth - Foreign born (%) - Asian
Place of birth - Foreign born (%) - Hispanic or Latino
Place of birth - Foreign born (%) - American Indian and Alaska Native
Place of birth - Foreign born (%) - Multirace
Place of birth - Foreign born (%) - Other Race
Residents speaking English at home (%)
Residents speaking English at home - Born in the United States (%)
Residents speaking English at home - Native, born elsewhere (%)
Residents speaking English at home - Foreign born (%)
Residents speaking Spanish at home (%)
Residents speaking Spanish at home - Born in the United States (%)
Residents speaking Spanish at home - Native, born elsewhere (%)
Residents speaking Spanish at home - Foreign born (%)
Residents speaking other language at home (%)
Residents speaking other language at home - Born in the United States (%)
Residents speaking other language at home - Native, born elsewhere (%)
Residents speaking other language at home - Foreign born (%)
Marital status - Never married (%)
Marital status - Now married (%)
Marital status - Separated (%)
Marital status - Widowed (%)
Marital status - Divorced (%)
Ancestries Reported - Arab (%)
Ancestries Reported - Czech (%)
Ancestries Reported - Danish (%)
Ancestries Reported - Dutch (%)
Ancestries Reported - English (%)
Ancestries Reported - French (%)
Ancestries Reported - French Canadian (%)
Ancestries Reported - German (%)
Ancestries Reported - Greek (%)
Ancestries Reported - Hungarian (%)
Ancestries Reported - Irish (%)
Ancestries Reported - Italian (%)
Ancestries Reported - Lithuanian (%)
Ancestries Reported - Norwegian (%)
Ancestries Reported - Polish (%)
Ancestries Reported - Portuguese (%)
Ancestries Reported - Russian (%)
Ancestries Reported - Scotch-Irish (%)
Ancestries Reported - Scottish (%)
Ancestries Reported - Slovak (%)
Ancestries Reported - Subsaharan African (%)
Ancestries Reported - Swedish (%)
Ancestries Reported - Swiss (%)
Ancestries Reported - Ukrainian (%)
Ancestries Reported - United States (%)
Ancestries Reported - Welsh (%)
Ancestries Reported - West Indian (%)
Ancestries Reported - Other (%)
Geographical mobility - Same house 1 year ago (%)
Geographical mobility - Same house 1 year ago (%) - White
Geographical mobility - Same house 1 year ago (%) - Black or African American
Geographical mobility - Same house 1 year ago (%) - Asian
Geographical mobility - Same house 1 year ago (%) - Hispanic or Latino
Geographical mobility - Same house 1 year ago (%) - American Indian and Alaska Native
Geographical mobility - Same house 1 year ago (%) - Multirace
Geographical mobility - Same house 1 year ago (%) - Other Race
Geographical mobility - Moved within same county (%)
Geographical mobility - Moved within same county (%) - White
Geographical mobility - Moved within same county (%) - Black or African American
Geographical mobility - Moved within same county (%) - Asian
Geographical mobility - Moved within same county (%) - Hispanic or Latino
Geographical mobility - Moved within same county (%) - American Indian and Alaska Native
Geographical mobility - Moved within same county (%) - Multirace
Geographical mobility - Moved within same county (%) - Other Race
Geographical mobility - Moved from different county within same state (%)
Geographical mobility - Moved from different county within same state (%) - White
Geographical mobility - Moved from different county within same state (%) - Black or African American
Geographical mobility - Moved from different county within same state (%) - Asian
Geographical mobility - Moved from different county within same state (%) - Hispanic or Latino
Geographical mobility - Moved from different county within same state (%) - American Indian and Alaska Native
Geographical mobility - Moved from different county within same state (%) - Multirace
Geographical mobility - Moved from different county within same state (%) - Other Race
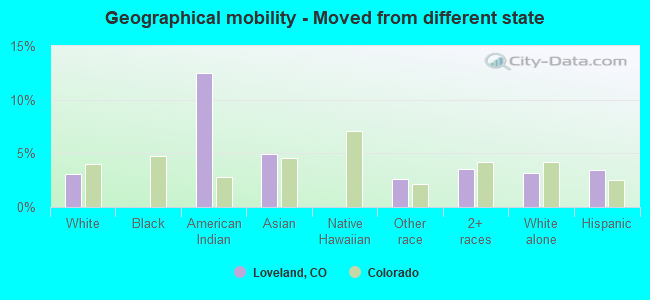
Geographical mobility - Moved from different state (%)
Geographical mobility - Moved from different state (%) - White
Geographical mobility - Moved from different state (%) - Black or African American
Geographical mobility - Moved from different state (%) - Asian
Geographical mobility - Moved from different state (%) - Hispanic or Latino
Geographical mobility - Moved from different state (%) - American Indian and Alaska Native
Geographical mobility - Moved from different state (%) - Multirace
Geographical mobility - Moved from different state (%) - Other Race
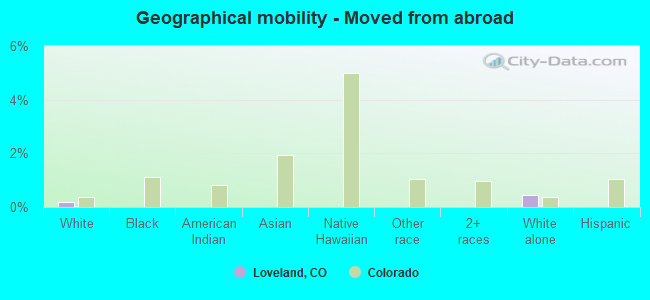
Geographical mobility - Moved from abroad (%)
Geographical mobility - Moved from abroad (%) - White
Geographical mobility - Moved from abroad (%) - Black or African American
Geographical mobility - Moved from abroad (%) - Asian
Geographical mobility - Moved from abroad (%) - Hispanic or Latino
Geographical mobility - Moved from abroad (%) - American Indian and Alaska Native
Geographical mobility - Moved from abroad (%) - Multirace
Geographical mobility - Moved from abroad (%) - Other Race
Place of birth for the foreign-born population - Ireland (%)
Place of birth for the foreign-born population - Denmark (%)
Place of birth for the foreign-born population - Norway (%)
Place of birth for the foreign-born population - Sweden (%)
Place of birth for the foreign-born population - United Kingdom (%)
Place of birth for the foreign-born population - England (%)
Place of birth for the foreign-born population - Scotland (%)
Place of birth for the foreign-born population - Other Northern Europe (%)
Place of birth for the foreign-born population - Austria (%)
Place of birth for the foreign-born population - Belgium (%)
Place of birth for the foreign-born population - France (%)
Place of birth for the foreign-born population - Germany (%)
Place of birth for the foreign-born population - Netherlands (%)
Place of birth for the foreign-born population - Switzerland (%)
Place of birth for the foreign-born population - Other Western Europe (%)
Place of birth for the foreign-born population - Greece (%)
Place of birth for the foreign-born population - Italy (%)
Place of birth for the foreign-born population - Portugal (%)
Place of birth for the foreign-born population - Spain (%)
Place of birth for the foreign-born population - Other Southern Europe (%)
Place of birth for the foreign-born population - Albania (%)
Place of birth for the foreign-born population - Belarus (%)
Place of birth for the foreign-born population - Bosnia and Herzegovina (%)
Place of birth for the foreign-born population - Bulgaria (%)
Place of birth for the foreign-born population - Croatia (%)
Place of birth for the foreign-born population - Czechoslovakia (%)
Place of birth for the foreign-born population - Hungary (%)
Place of birth for the foreign-born population - Latvia (%)
Place of birth for the foreign-born population - Lithuania (%)
Place of birth for the foreign-born population - North Macedonia (Macedonia) (%)
Place of birth for the foreign-born population - Moldova (%)
Place of birth for the foreign-born population - Poland (%)
Place of birth for the foreign-born population - Romania (%)
Place of birth for the foreign-born population - Russia (%)
Place of birth for the foreign-born population - Serbia (%)
Place of birth for the foreign-born population - Ukraine (%)
Place of birth for the foreign-born population - Other Eastern Europe (%)
Place of birth for the foreign-born population - China (%)
Place of birth for the foreign-born population - Hong Kong (%)
Place of birth for the foreign-born population - Taiwan (%)
Place of birth for the foreign-born population - Japan (%)
Place of birth for the foreign-born population - Korea (%)
Place of birth for the foreign-born population - Other Eastern Asia (%)
Place of birth for the foreign-born population - Afghanistan (%)
Place of birth for the foreign-born population - Bangladesh (%)
Place of birth for the foreign-born population - India (%)
Place of birth for the foreign-born population - Iran (%)
Place of birth for the foreign-born population - Kazakhstan (%)
Place of birth for the foreign-born population - Nepal (%)
Place of birth for the foreign-born population - Pakistan (%)
Place of birth for the foreign-born population - Sri Lanka (%)
Place of birth for the foreign-born population - Uzbekistan (%)
Place of birth for the foreign-born population - Other South Central Asia (%)
Place of birth for the foreign-born population - Burma (%)
Place of birth for the foreign-born population - Cambodia (%)
Place of birth for the foreign-born population - Indonesia (%)
Place of birth for the foreign-born population - Laos (%)
Place of birth for the foreign-born population - Malaysia (%)
Place of birth for the foreign-born population - Philippines (%)
Place of birth for the foreign-born population - Singapore (%)
Place of birth for the foreign-born population - Thailand (%)
Place of birth for the foreign-born population - Vietnam (%)
Place of birth for the foreign-born population - Other South Eastern Asia (%)
Place of birth for the foreign-born population - Armenia (%)
Place of birth for the foreign-born population - Iraq (%)
Place of birth for the foreign-born population - Israel (%)
Place of birth for the foreign-born population - Jordan (%)
Place of birth for the foreign-born population - Kuwait (%)
Place of birth for the foreign-born population - Lebanon (%)
Place of birth for the foreign-born population - Saudi Arabia (%)
Place of birth for the foreign-born population - Syria (%)
Place of birth for the foreign-born population - Turkey (%)
Place of birth for the foreign-born population - Yemen (%)
Place of birth for the foreign-born population - Other Western Asia (%)
Place of birth for the foreign-born population - Eritrea (%)
Place of birth for the foreign-born population - Ethiopia (%)
Place of birth for the foreign-born population - Kenya (%)
Place of birth for the foreign-born population - Somalia (%)
Place of birth for the foreign-born population - Uganda (%)
Place of birth for the foreign-born population - Zimbabwe (%)
Place of birth for the foreign-born population - Other Eastern Africa (%)
Place of birth for the foreign-born population - Cameroon (%)
Place of birth for the foreign-born population - Congo (%)
Place of birth for the foreign-born population - Democratic Republic of Congo (Zaire) (%)
Place of birth for the foreign-born population - Other Middle Africa (%)
Place of birth for the foreign-born population - Egypt (%)
Place of birth for the foreign-born population - Morocco (%)
Place of birth for the foreign-born population - Sudan (%)
Place of birth for the foreign-born population - Other Northern Africa (%)
Place of birth for the foreign-born population - South Africa (%)
Place of birth for the foreign-born population - Other Southern Africa (%)
Place of birth for the foreign-born population - Cabo Verde (%)
Place of birth for the foreign-born population - Ghana (%)
Place of birth for the foreign-born population - Liberia (%)
Place of birth for the foreign-born population - Nigeria (%)
Place of birth for the foreign-born population - Senegal (%)
Place of birth for the foreign-born population - Sierra Leone (%)
Place of birth for the foreign-born population - Other Western Africa (%)
Place of birth for the foreign-born population - Australia (%)
Place of birth for the foreign-born population - New Zealand (%)
Place of birth for the foreign-born population - Fiji (%)
Place of birth for the foreign-born population - Micronesia (%)
Place of birth for the foreign-born population - Bahamas (%)
Place of birth for the foreign-born population - Barbados (%)
Place of birth for the foreign-born population - Cuba (%)
Place of birth for the foreign-born population - Dominica (%)
Place of birth for the foreign-born population - Dominican Republic (%)
Place of birth for the foreign-born population - Grenada (%)
Place of birth for the foreign-born population - Haiti (%)
Place of birth for the foreign-born population - Jamaica (%)
Place of birth for the foreign-born population - St. Vincent and the Grenadines (%)
Place of birth for the foreign-born population - Trinidad and Tobago (%)
Place of birth for the foreign-born population - West Indies (%)
Place of birth for the foreign-born population - Other Caribbean (%)
Place of birth for the foreign-born population - Belize (%)
Place of birth for the foreign-born population - Costa Rica (%)
Place of birth for the foreign-born population - El Salvador (%)
Place of birth for the foreign-born population - Guatemala (%)
Place of birth for the foreign-born population - Honduras (%)
Place of birth for the foreign-born population - Mexico (%)
Place of birth for the foreign-born population - Nicaragua (%)
Place of birth for the foreign-born population - Panama (%)
Place of birth for the foreign-born population - Other Central America (%)
Place of birth for the foreign-born population - Argentina (%)
Place of birth for the foreign-born population - Bolivia (%)
Place of birth for the foreign-born population - Brazil (%)
Place of birth for the foreign-born population - Chile (%)
Place of birth for the foreign-born population - Colombia (%)
Place of birth for the foreign-born population - Ecuador (%)
Place of birth for the foreign-born population - Guyana (%)
Place of birth for the foreign-born population - Peru (%)
Place of birth for the foreign-born population - Uruguay (%)
Place of birth for the foreign-born population - Venezuela (%)
Place of birth for the foreign-born population - Other South America (%)
Place of birth for the foreign-born population - Canada (%)
Place of birth for the foreign-born population - Other Northern America (%)
Place of birth for the foreign-born population - Other (%)
Latest news about races in Loveland, CO collected exclusively by city-data.com from local newspapers, TV, and radio stations
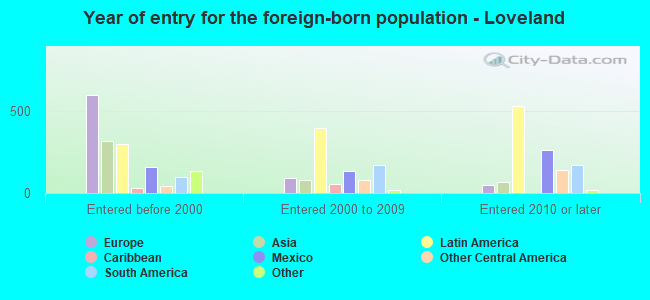
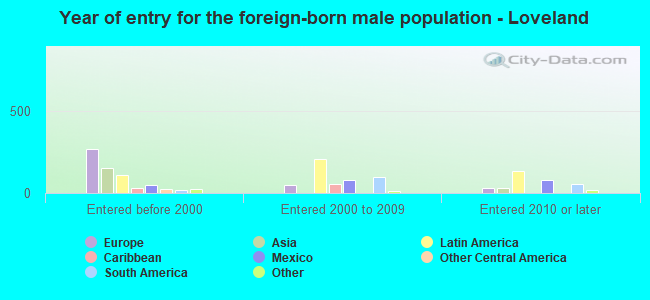
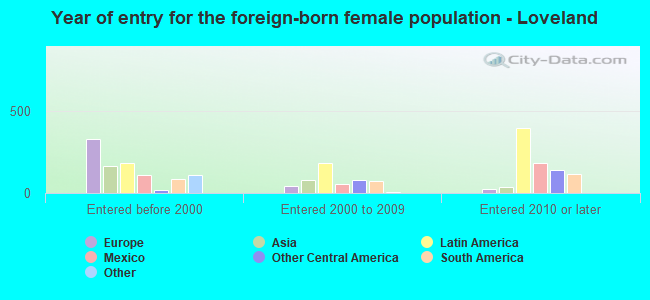
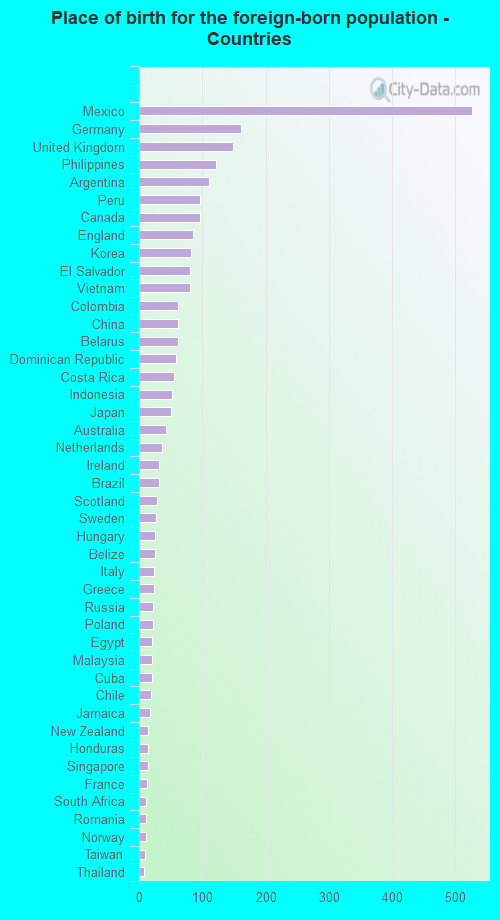
According to 2022 data, the most numerous races in Loveland, CO are White alone (66,486 residents), Hispanic (10,727 residents), and Two or more races (2,376 residents). 94.2% of Loveland residents speak English at home. 3.1% of Loveland, CO residents are foreign-born (1.4% born in Latin America, 0.9% born in Europe, 0.6% born in Asia), which is 188.0% less than the foreign-born rate of 9.0% across the entire state of Colorado.
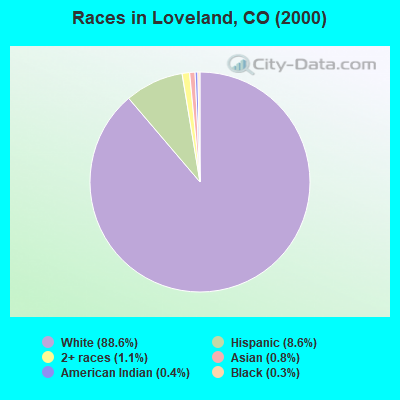
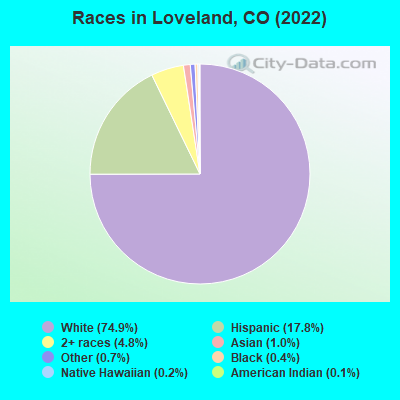
Race distribution in Loveland
2000 2022
3,202,880 74.5% White alone 735,601 17.1% Hispanic 158,443 3.7% Black alone 93,277 2.2% Asian alone 72,721 1.7% Two or more races 28,982 0.7% American Indian alone 5,512 0.1% Other race alone 3,845 0.09% Native Hawaiian and Other
3,793,270 65.0% White alone 1,314,962 22.5% Hispanic 268,754 4.6% Two or more races 220,756 3.8% Black alone 182,658 3.1% Asian alone 29,798 0.5% Other race alone 23,389 0.4% American Indian alone 6,339 0.1% Native Hawaiian and Other
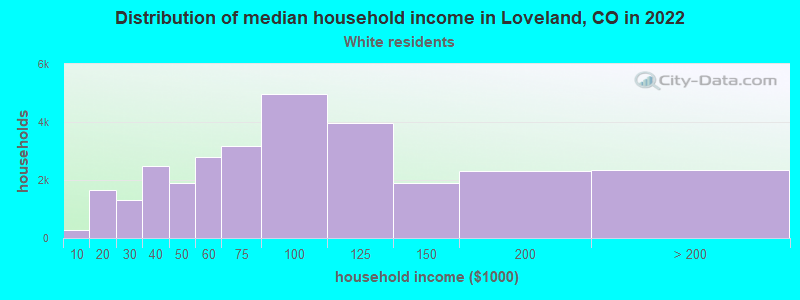
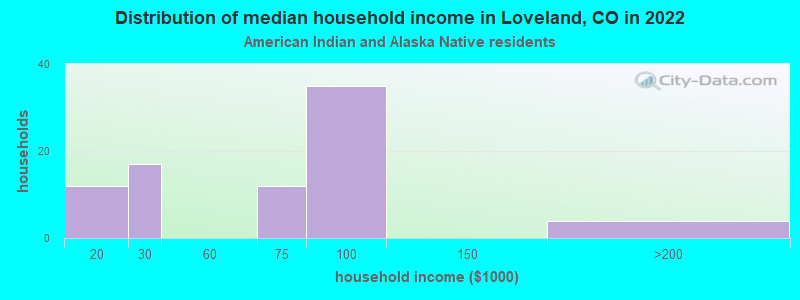
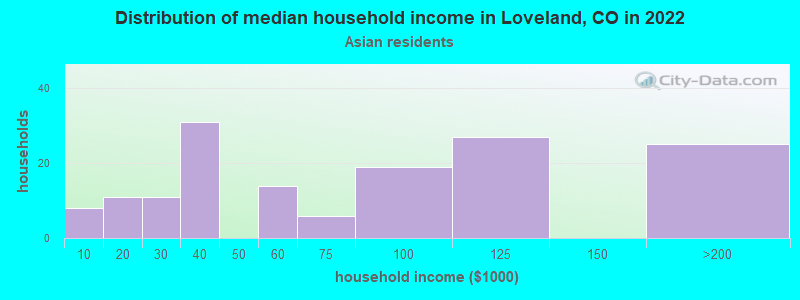
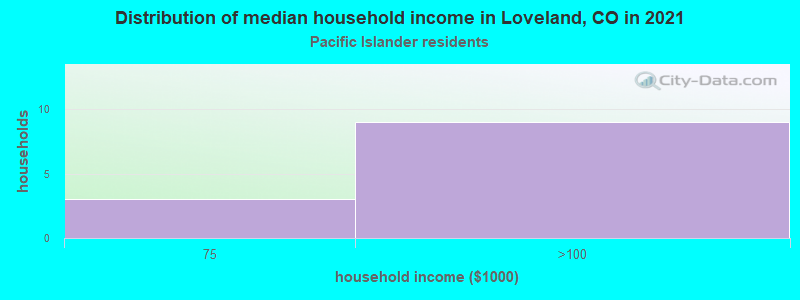
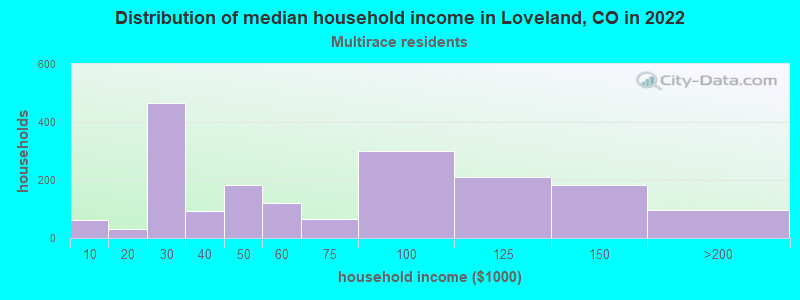
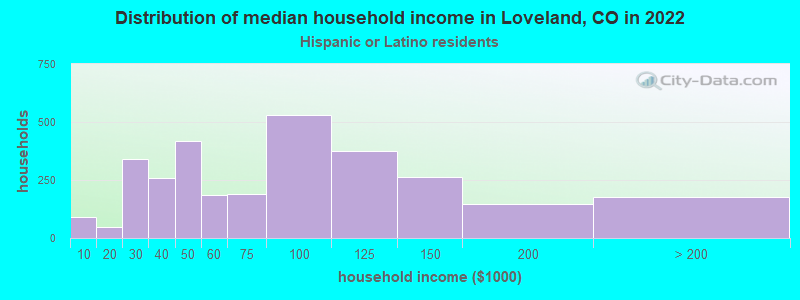
Income and house value in Loveland Median household income in 2022 $86,511 White non-Hispanic householders$99,941 Black householders$66,700 American Indian and Alaska Native householders$83,616 Asian householders$150,329 Some other race householders$131,960 Two or more races householders$90,596 Hispanic or Latino race householdersMedian 2022 house value $518,825 White Non-Hispanic householders$403,383 Black or African American householders$513,186 American Indian or Alaska Native householders $594,792 Asian householders$504,893 Some other race householders$445,845 Two or more races householders$473,047 Hispanic or Latino householders
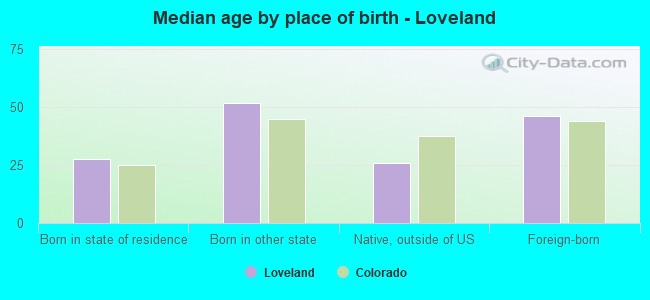
Median age by race in Loveland
40.2 Median age for White residents39.0 41.3 8.1 Median age for Black or African American residents30.6 Median age for American Indian / Alaska Native residents43.6 Median age for Asian residents43.1 42.4 84.3 Median age for Native Hawaiian / Pacific Islander residents29.6 Median age for Other race residents28.6 32.6 25.4 Median age for Two or more races residents48.4 15.2 40.6 Median age for White alone residents39.3 43.9 26.5 Median age for Hispanic or Latino residents28.6 18.9
Owner/renter occupied households by race in Loveland
House owners and renters - White residents 20,604 65.1% Owner occupied11,027 34.9% Renter occupiedHouse owners and renters - Black or African American residents 35 32.4% Owner occupied72 67.6% Renter occupiedHouse owners and renters - American Indian / Alaska Native residents 112 50.0% Owner occupied112 50.0% Renter occupiedHouse owners and renters - Asian residents 122 60.4% Owner occupied80 39.6% Renter occupiedHouse owners and renters - Native Hawaiian / Pacific Islander residents 24 100.0% Owner occupiedHouse owners and renters - Other race residents 200 63.1% Owner occupied117 36.9% Renter occupiedHouse owners and renters - Two or more races residents 1,018 61.2% Owner occupied644 38.8% Renter occupiedHouse owners and renters - White alone residents 20,116 65.0% Owner occupied10,853 35.0% Renter occupiedHouse owners and renters - Hispanic or Latino residents 1,429 54.7% Owner occupied1,182 45.3% Renter occupied
Language usage in Loveland
English speakers - Total 94.2% of residents of Loveland speak English at home.
4.3% of residents speak Spanish at home 2,313 71.9% Speak English very well902 28.1% Speak English less than very well2.0% of residents speak other language at home 918 59.8% Speak English very well618 40.2% Speak English less than very well
English speakers - Born in the United States 96.1% of residents of Loveland speak English at home.
3.0% of residents speak Spanish at home 861 67.1% Speak English very well423 32.9% Speak English less than very well0.9% of residents speak other language at home 285 72.3% Speak English very well109 27.7% Speak English less than very well
English speakers - Native, born elsewhere 81.8% of residents of Loveland speak English at home.
13.8% of residents speak Spanish at home 142 100.0% Speak English very well5.0% of residents speak other language at home 51 100.0% Speak English very well
English speakers - Foreign-born 40.4% of residents of Loveland speak English at home.
35.1% of residents speak Spanish at home 679 76.0% Speak English very well215 24.0% Speak English less than very well26.7% of residents speak other language at home 396 58.4% Speak English very well282 41.6% Speak English less than very well
White (Caucasian) - Speak only English Native:
100.0% (66,866)Foreign-born:
70.7% (636)
White (Caucasian) - Speak another language Native:
1.7% (1,134)Foreign-born:
48.4% (435)
Black or African American - Speak only English Native:
85.8% (291)Foreign-born:
82.0% (21)
Black or African American - Speak another language Native:
15.9% (54)Foreign-born:
10.3% (3)
American Indian / Alaska Native - Speak another language Native:
8.5% (29)Foreign-born:
100.0% (173)
Asian - Speak only English Native:
78.9% (231)Foreign-born:
27.1% (125)
Asian - Speak another language Native:
23.9% (70)Foreign-born:
66.7% (308)
Other race - Speak only English Native:
58.5% (582)Foreign-born:
79.3% (183)
Other race - Speak another language Native:
40.7% (405)Foreign-born:
56.0% (129)
Two or more races - Speak only English Native:
80.9% (5,125)Foreign-born:
17.5% (38)
Two or more races - Speak another language Native:
14.5% (919)Foreign-born:
74.4% (160)
White alone - Speak only English Native:
99.2% (62,724)Foreign-born:
78.5% (648)
White alone - Speak another language Native:
1.1% (674)Foreign-born:
30.3% (250)
Hispanic or Latino - Speak another language Native:
17.0% (1,928)Foreign-born:
97.8% (565)
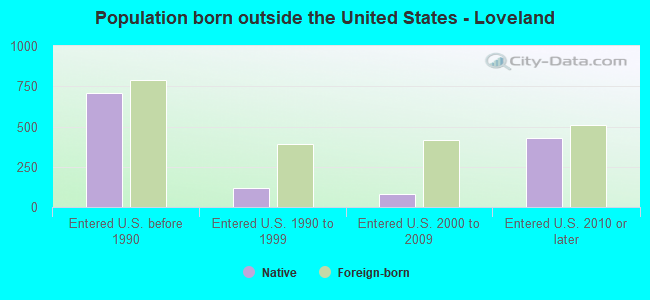
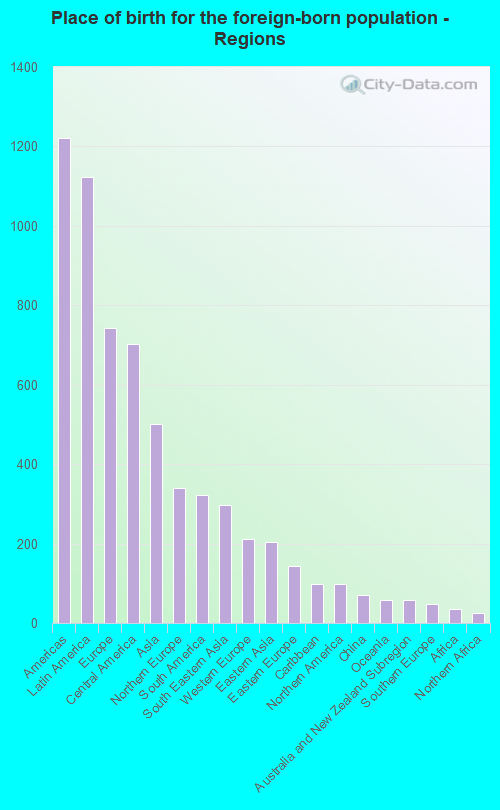
Foreign-born residents in Loveland 2,561 residents are foreign born (1.4% Latin America , 0.9% Europe , 0.6% Asia ).
This city:
3.1%Colorado:
100.0%
Marital status for residents in Loveland Marital status - White (Caucasian) population 15 years and over
Males 29.0% Never married58.0% Now married0.0% Separated1.4% Widowed11.6% DivorcedFemales 24.6% Never married52.1% Now married0.3% Separated7.7% Widowed15.3% DivorcedWomen who gave birth in the past 12 months Now married:
68.4% (685)Unmarried:
31.6% (317)
Women who did not give birth in the past 12 months Now married:
51.5% (7,008)Unmarried:
48.5% (6,604)
Marital status - Black or African American population 15 years and over
Males 19.8% Never married77.7% Now married0.0% Separated0.0% Widowed2.5% DivorcedFemales 54.7% Never married22.4% Now married17.1% Separated0.0% Widowed5.9% DivorcedWomen who did not give birth in the past 12 months Now married:
20.5% (25)Unmarried:
79.5% (96)
Marital status - American Indian / Alaska Native population 15 years and over
Males 12.9% Never married53.2% Now married0.0% Separated13.7% Widowed20.2% DivorcedFemales 62.6% Never married13.6% Now married0.0% Separated10.7% Widowed13.1% DivorcedWomen who gave birth in the past 12 months Now married:
100.0% (20)Unmarried:
0.0% (0)
Women who did not give birth in the past 12 months Now married:
0.0% (0)Unmarried:
100.0% (130)
Marital status - Asian population 15 years and over
Males 36.8% Never married61.0% Now married0.0% Separated0.0% Widowed2.2% DivorcedFemales 12.4% Never married55.8% Now married8.7% Separated12.2% Widowed10.8% DivorcedWomen who did not give birth in the past 12 months Now married:
65.5% (139)Unmarried:
34.5% (73)
Marital status - Native Hawaiian / Pacific Islander population 15 years and over
Males 0.0% Never married100.0% Now married0.0% Separated0.0% Widowed0.0% DivorcedFemales 42.9% Never married28.6% Now married0.0% Separated28.6% Widowed0.0% DivorcedWomen who did not give birth in the past 12 months Now married:
0.0% (0)Unmarried:
100.0% (9)
Marital status - Other race population 15 years and over
Males 51.4% Never married34.8% Now married5.5% Separated1.7% Widowed6.6% DivorcedFemales 33.2% Never married55.7% Now married0.0% Separated1.4% Widowed9.7% DivorcedWomen who did not give birth in the past 12 months Now married:
45.2% (132)Unmarried:
54.8% (161)
Marital status - Two or more races population 15 years and over
Males 50.4% Never married41.9% Now married0.0% Separated0.0% Widowed7.7% DivorcedFemales 34.8% Never married54.9% Now married5.5% Separated0.0% Widowed4.8% DivorcedWomen who gave birth in the past 12 months Now married:
100.0% (72)Unmarried:
0.0% (0)
Women who did not give birth in the past 12 months Now married:
58.5% (1,047)Unmarried:
41.5% (742)
Marital status - White alone, not Hispanic / Latino population 15 years and over
Males 27.7% Never married58.2% Now married0.0% Separated1.7% Widowed12.5% DivorcedFemales 23.2% Never married52.9% Now married0.4% Separated8.0% Widowed15.6% DivorcedWomen who gave birth in the past 12 months Now married:
68.4% (739)Unmarried:
31.6% (342)
Women who did not give birth in the past 12 months Now married:
52.4% (6,751)Unmarried:
47.6% (6,141)
Marital status - Hispanic or Latino population 15 years and over
Males 38.3% Never married52.6% Now married0.0% Separated2.0% Widowed7.1% DivorcedFemales 40.3% Never married37.8% Now married0.0% Separated5.0% Widowed16.9% DivorcedWomen who gave birth in the past 12 months Now married:
92.4% (131)Unmarried:
7.6% (11)
Women who did not give birth in the past 12 months Now married:
51.7% (1,358)Unmarried:
48.3% (1,266)
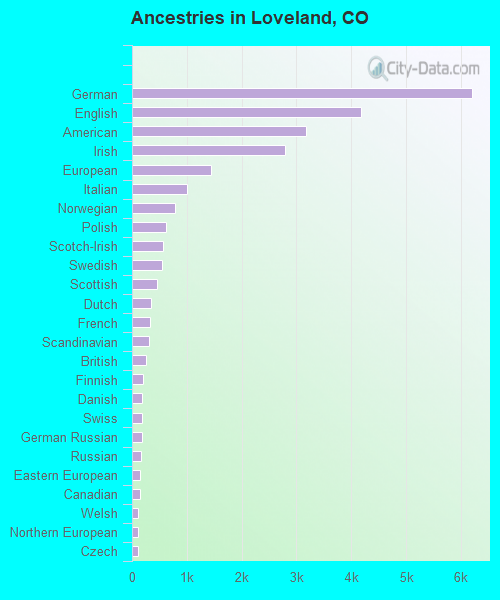
Ancestries in Loveland
5,285 16.1% German3,045 9.3% English2,776 8.5% American2,196 6.7% Irish2,106 6.4% European921 2.8% Italian698 2.1% Norwegian575 1.8% Dutch557 1.7% Scottish468 1.4% Polish464 1.4% Scandinavian454 1.4% Scotch-Irish423 1.3% Swedish357 1.1% British289 0.9% Northern European279 0.9% French245 0.7% Czech204 0.6% Finnish201 0.6% Danish171 0.5% French Canadian142 0.4% Hungarian130 0.4% Welsh112 0.3% Eastern European106 0.3% Belgian103 0.3% Canadian91 0.3% Slovak73 0.2% Russian63 0.2% Iranian56 0.2% German Russian46 0.1% Australian34 0.1% Swiss31 0.09% Czechoslovakian22 0.07% Syrian21 0.06% Greek21 0.06% Lithuanian19 0.06% Cajun19 0.06% Romanian18 0.05% Basque18 0.05% Jamaican17 0.05% Yugoslavian15 0.05% Ukrainian12 0.04% Latvian11 0.03% Croatian8 0.02% Celtic7 0.02% Pennsylvania German6 0.02% Slovene6 0.02% Turkish4 0.01% Austrian
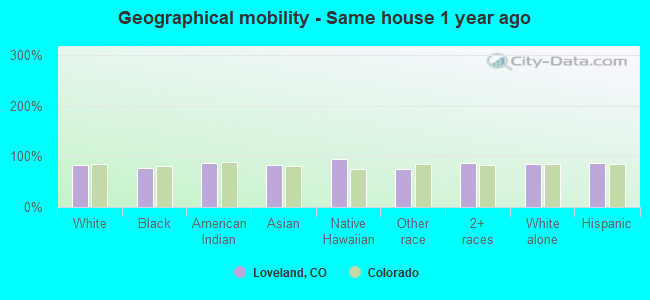
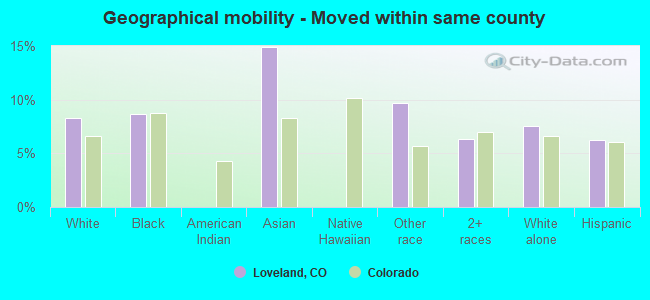
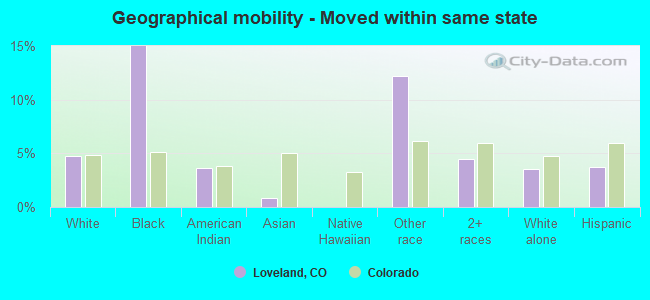
Geographical mobility in Loveland Same house 1 year ago 56,705 83.7% White (Caucasian)325 77.7% Black or African American401 86.3% American Indian / Alaska Native697 83.0% Asian37 94.1% Native Hawaiian / Pacific Islander912 75.4% Other race5,668 86.5% Two or more races54,777 85.3% White alone, not Hispanic / Latino8,608 86.8% Hispanic or LatinoMoved within same county 5,589 8.2% White / Caucasian36 8.6% Black or African American125 14.9% Asian117 9.7% Other race412 6.3% Two or more races4,832 7.5% White alone, not Hispanic / Latino616 6.2% Hispanic or LatinoMoved within same state 3,209 4.7% White / Caucasian63 15.0% Black or African American17 3.6% American Indian / Alaska Native7 0.9% Asian148 12.2% Other race291 4.4% Two or more races2,267 3.5% White alone, not Hispanic / Latino368 3.7% Hispanic or LatinoMoved from different state 2,059 3.0% White / Caucasian58 12.5% American Indian / Alaska Native41 4.9% Asian32 2.7% Other race235 3.6% Two or more races2,029 3.2% White alone, not Hispanic / Latino346 3.5% Hispanic or LatinoMoved from abroad 131 0.2% White287 0.4% White alone, not Hispanic / Latino
Children Nativity (place of birth) in Loveland
Children under 6 years - Living with two parents Both parents native 3,268 100.0% NativeBoth parents foreign-born 99 94.0% Native6 6.0% Foreign-bornOne native, one foreign-born parent 323 100.0% NativeChildren under 6 years - Living with one parent Native parent 893 100.0% NativeForeign-born parent 41 100.0% NativeChildren 6 to 17 years - Living with two parents Both parents native 7,021 99.8% Native12 0.2% Foreign-bornBoth parents foreign-born 178 91.6% Native16 8.4% Foreign-bornOne native, one foreign-born parent 382 100.0% NativeChildren 6 to 17 years - Living with one parent Native parent 2,751 100.0% NativeForeign-born parent 91 59.1% Native63 40.9% Foreign-born
Grandparents responsible for own grandchildren in Loveland
Grandparents (30 to 59 years) White / Caucasian 240 48.0% Responsible for grandchildren259 52.0% Not responsible for grandchildrenAsian 11 100.0% Responsible for grandchildrenTwo or more races 91 100.0% Responsible for grandchildrenWhite alone, not Hispanic / Latino 205 42.9% Responsible for grandchildren273 57.1% Not responsible for grandchildrenHispanic or Latino 68 51.1% Responsible for grandchildren65 48.9% Not responsible for grandchildrenGrandparents (60 years and over) White / Caucasian 110 27.2% Responsible for grandchildren294 72.8% Not responsible for grandchildrenAsian 12 100.0% Not responsible for grandchildrenTwo or more races 37 100.0% Not responsible for grandchildrenWhite alone, not Hispanic / Latino 128 27.5% Responsible for grandchildren337 72.5% Not responsible for grandchildrenHispanic or Latino 10 17.7% Responsible for grandchildren47 82.3% Not responsible for grandchildren