Races in Mamakating, New York (NY) Detailed Stats
Ancestries, Foreign-born residents, place of birth
5.4% of Mamakating, NY residents are foreign-born (2.8% born in Europe, 1.8% born in Latin America, 0.8% born in Asia), which is 308.2% less than the foreign-born rate of 22.0% across the entire state of New York.
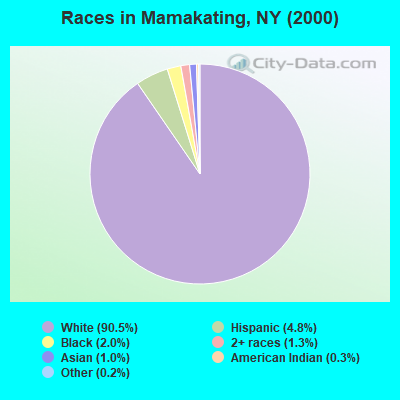
Race distribution in Mamakating

- 9,95590.5%White alone
- 5254.8%Hispanic
- 2152.0%Black alone
- 1401.3%Two or more races
- 1121.0%Asian alone
- 350.3%American Indian alone
- 200.2%Other race alone
2000
2022
-
- 11,760,98162.0%White alone
- 2,867,58315.1%Hispanic
- 2,812,62314.8%Black alone
- 1,035,9265.5%Asian alone
- 366,1161.9%Two or more races
- 75,4990.4%Other race alone
- 52,4990.3%American Indian alone
- 5,2300.03%Native Hawaiian and Other
Pacific Islander alone

-
- 10,408,93352.9%White alone
- 3,867,29919.7%Hispanic
- 2,633,84013.4%Black alone
- 1,776,2869.0%Asian alone
- 732,6703.7%Two or more races
- 216,1101.1%Other race alone
- 35,0820.2%American Indian alone
- 6,9310.04%Native Hawaiian and Other
Pacific Islander alone

Income and house value in Mamakating
- Median household income in 2022
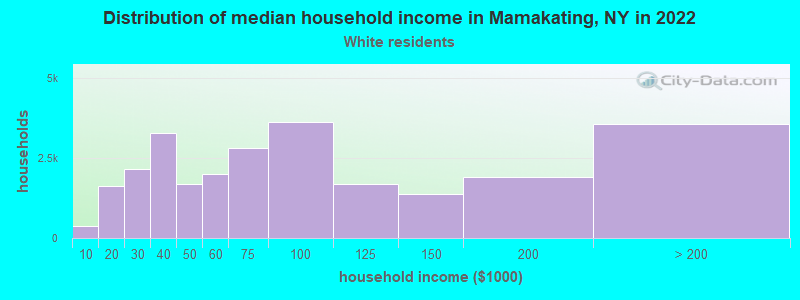
- $71,855White non-Hispanic householders
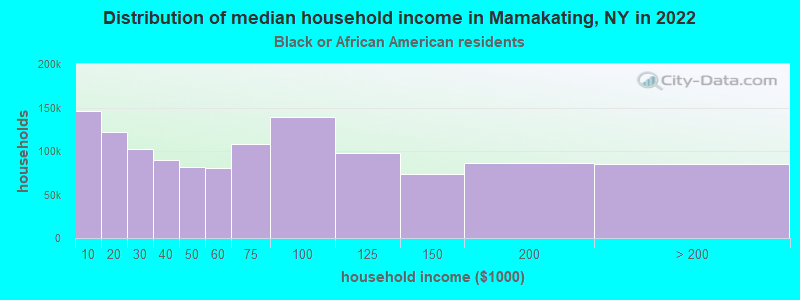
- $123,248Black householders
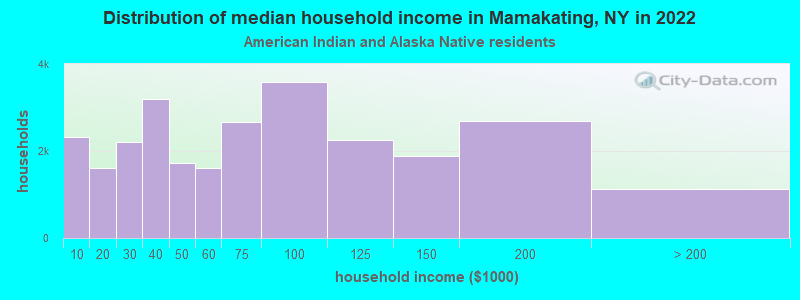
- $70,428American Indian and Alaska Native householders
- $145,898Asian householders
- $65,905Some other race householders
- $91,976Two or more races householders
- $92,477Hispanic or Latino race householders
- Median 2022 house value
- $303,678White Non-Hispanic householders
- $387,577Black or African American householders
- $215,827American Indian or Alaska Native householders
- $362,954Asian householders
- $341,980Some other race householders
- $361,130Two or more races householders
- $408,552Hispanic or Latino householders
Household income for White non-Hispanic householders
Household income for Black householders
Household income for American Indian and Alaska Native householders
Household income for Asian householders

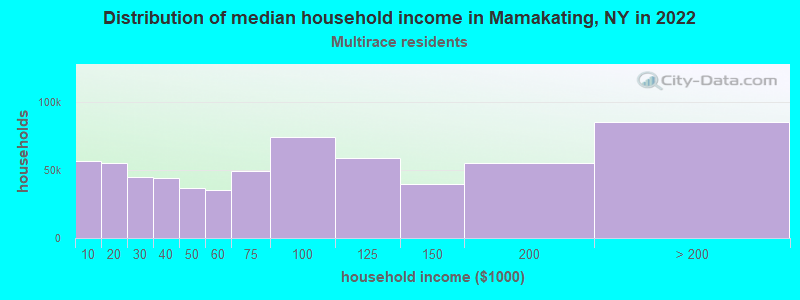
Household income for Two or more races householders
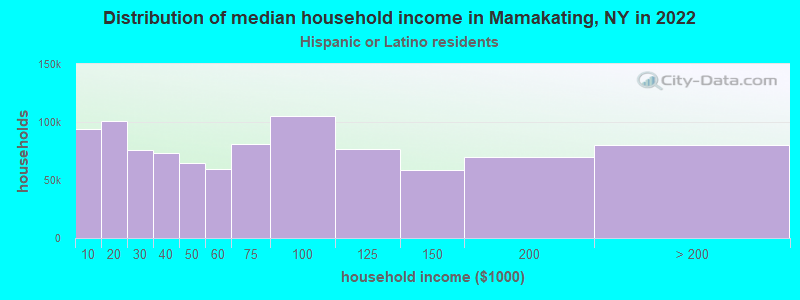
Household income for Hispanic or Latino race householders
Foreign-born residents in Mamakating
593 residents are foreign born (2.8% Europe, 1.8% Latin America, 0.8% Asia).
| This city: | 5.4% |
| New York: | 20.4% |
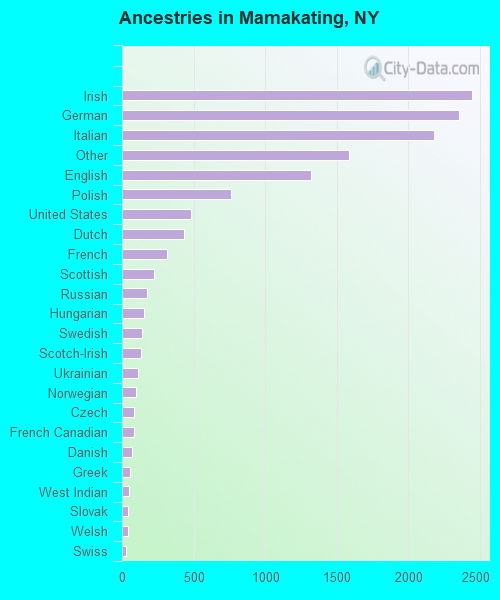
Ancestries in Mamakating

- 2,44018.2%Irish
- 2,35117.6%German
- 2,17516.3%Italian
- 1,58611.9%Other
- 1,3199.9%English
- 7585.7%Polish
- 4853.6%United States
- 4303.2%Dutch
- 3132.3%French
- 2261.7%Scottish
- 1781.3%Russian
- 1521.1%Hungarian
- 1371.0%Swedish
- 1341.0%Scotch-Irish
- 1110.8%Ukrainian
- 950.7%Norwegian
- 870.7%Czech
- 840.6%French Canadian
- 700.5%Danish
- 530.4%Greek
- 480.4%West Indian
- 450.3%Slovak
- 410.3%Welsh
- 280.2%Swiss
- 170.1%Lithuanian
- 110.08%Portuguese
- 30.02%Subsaharan African
Zip codes: 12790.