Races in Mamaroneck, New York (NY) Detailed Stats
Data:
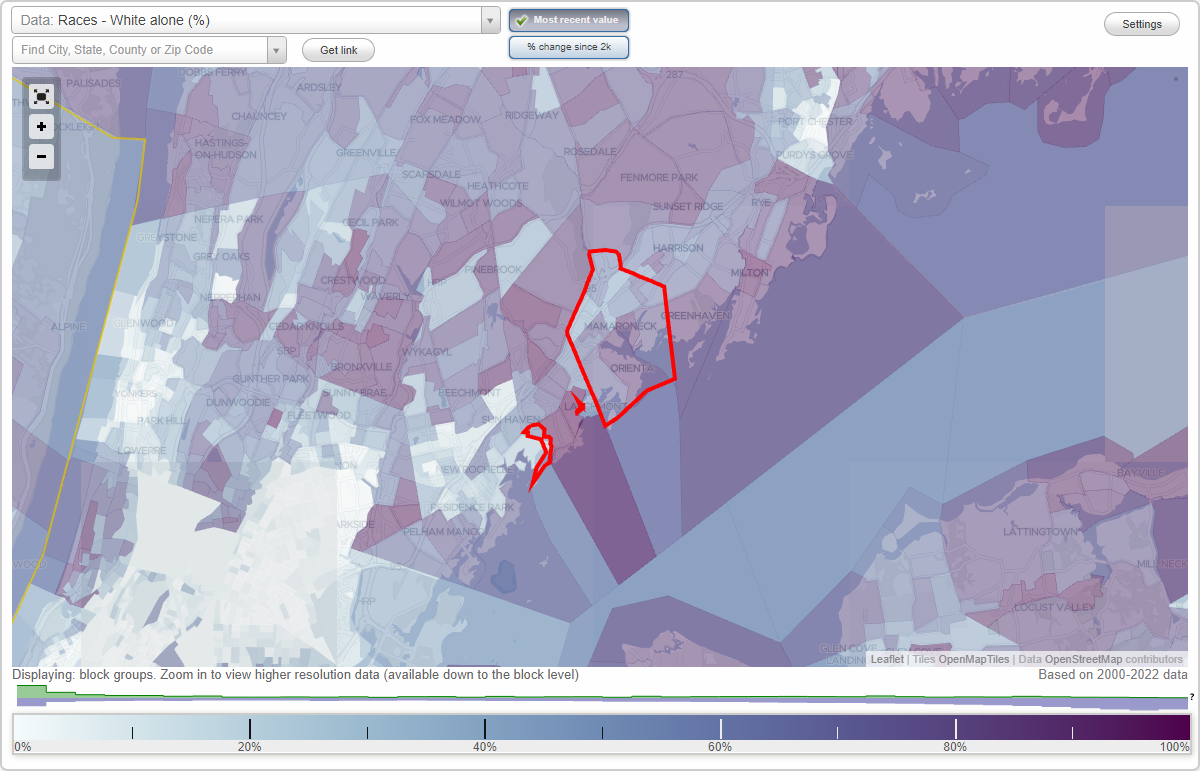
Races - White alone (%)
Races - White alone (% change since 2000)
Races - Black alone (%)
Races - Black alone (% change since 2000)
Races - American Indian alone (%)
Races - American Indian alone (% change since 2000)
Races - Asian alone (%)
Races - Asian alone (% change since 2000)
Races - Hispanic (%)
Races - Hispanic (% change since 2000)
Races - Native Hawaiian and Other Pacific Islander alone (%)
Races - Native Hawaiian and Other Pacific Islander alone (% change since 2000)
Races - Two or more races(%)
Races - Two or more races(% change since 2000)
Races - Other race alone (%)
Races - Other race alone (% change since 2000)
Racial diversity
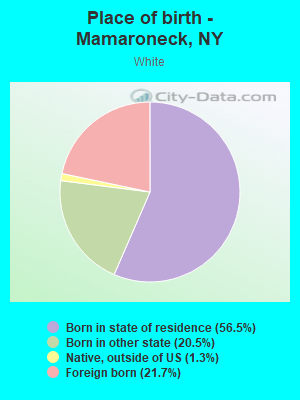
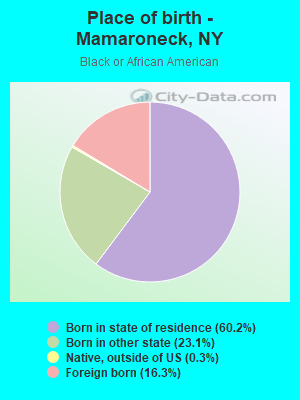
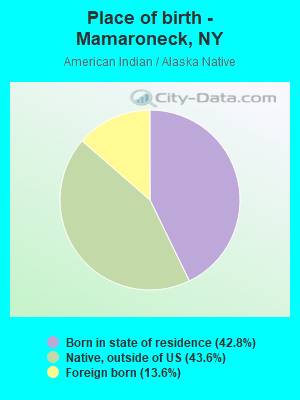
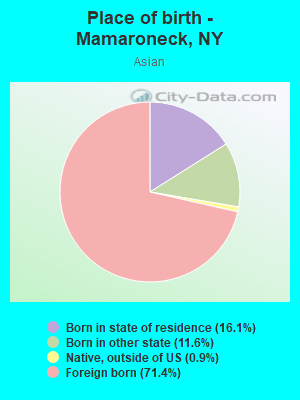
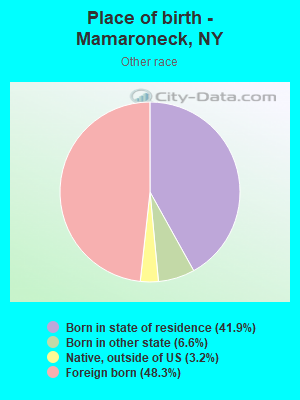
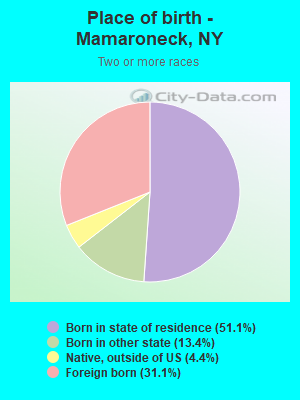
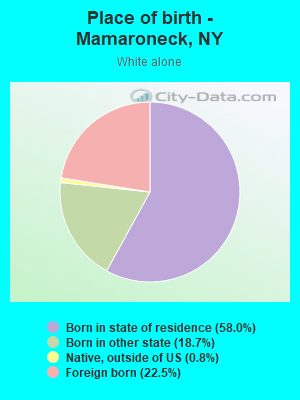
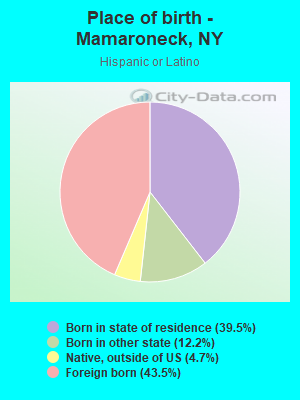
Place of birth - Born in state of residence (%)
Place of birth - Born in state of residence (%) - White
Place of birth - Born in state of residence (%) - Black or African American
Place of birth - Born in state of residence (%) - Asian
Place of birth - Born in state of residence (%) - Hispanic or Latino
Place of birth - Born in state of residence (%) - American Indian and Alaska Native
Place of birth - Born in state of residence (%) - Multirace
Place of birth - Born in state of residence (%) - Other Race
Place of birth - Born in other state (%)
Place of birth - Born in other state (%) - White
Place of birth - Born in other state (%) - Black or African American
Place of birth - Born in other state (%) - Asian
Place of birth - Born in other state (%) - Hispanic or Latino
Place of birth - Born in other state (%) - American Indian and Alaska Native
Place of birth - Born in other state (%) - Multirace
Place of birth - Born in other state (%) - Other Race
Place of birth - Native, outside of US (%)
Place of birth - Native, outside of US (%) - White
Place of birth - Native, outside of US (%) - Black or African American
Place of birth - Native, outside of US (%) - Asian
Place of birth - Native, outside of US (%) - Hispanic or Latino
Place of birth - Native, outside of US (%) - American Indian and Alaska Native
Place of birth - Native, outside of US (%) - Multirace
Place of birth - Native, outside of US (%) - Other Race
Place of birth - Foreign born (%)
Place of birth - Foreign born (%) - White
Place of birth - Foreign born (%) - Black or African American
Place of birth - Foreign born (%) - Asian
Place of birth - Foreign born (%) - Hispanic or Latino
Place of birth - Foreign born (%) - American Indian and Alaska Native
Place of birth - Foreign born (%) - Multirace
Place of birth - Foreign born (%) - Other Race
Residents speaking English at home (%)
Residents speaking English at home - Born in the United States (%)
Residents speaking English at home - Native, born elsewhere (%)
Residents speaking English at home - Foreign born (%)
Residents speaking Spanish at home (%)
Residents speaking Spanish at home - Born in the United States (%)
Residents speaking Spanish at home - Native, born elsewhere (%)
Residents speaking Spanish at home - Foreign born (%)
Residents speaking other language at home (%)
Residents speaking other language at home - Born in the United States (%)
Residents speaking other language at home - Native, born elsewhere (%)
Residents speaking other language at home - Foreign born (%)
Marital status - Never married (%)
Marital status - Now married (%)
Marital status - Separated (%)
Marital status - Widowed (%)
Marital status - Divorced (%)
Ancestries Reported - Arab (%)
Ancestries Reported - Czech (%)
Ancestries Reported - Danish (%)
Ancestries Reported - Dutch (%)
Ancestries Reported - English (%)
Ancestries Reported - French (%)
Ancestries Reported - French Canadian (%)
Ancestries Reported - German (%)
Ancestries Reported - Greek (%)
Ancestries Reported - Hungarian (%)
Ancestries Reported - Irish (%)
Ancestries Reported - Italian (%)
Ancestries Reported - Lithuanian (%)
Ancestries Reported - Norwegian (%)
Ancestries Reported - Polish (%)
Ancestries Reported - Portuguese (%)
Ancestries Reported - Russian (%)
Ancestries Reported - Scotch-Irish (%)
Ancestries Reported - Scottish (%)
Ancestries Reported - Slovak (%)
Ancestries Reported - Subsaharan African (%)
Ancestries Reported - Swedish (%)
Ancestries Reported - Swiss (%)
Ancestries Reported - Ukrainian (%)
Ancestries Reported - United States (%)
Ancestries Reported - Welsh (%)
Ancestries Reported - West Indian (%)
Ancestries Reported - Other (%)
Geographical mobility - Same house 1 year ago (%)
Geographical mobility - Same house 1 year ago (%) - White
Geographical mobility - Same house 1 year ago (%) - Black or African American
Geographical mobility - Same house 1 year ago (%) - Asian
Geographical mobility - Same house 1 year ago (%) - Hispanic or Latino
Geographical mobility - Same house 1 year ago (%) - American Indian and Alaska Native
Geographical mobility - Same house 1 year ago (%) - Multirace
Geographical mobility - Same house 1 year ago (%) - Other Race
Geographical mobility - Moved within same county (%)
Geographical mobility - Moved within same county (%) - White
Geographical mobility - Moved within same county (%) - Black or African American
Geographical mobility - Moved within same county (%) - Asian
Geographical mobility - Moved within same county (%) - Hispanic or Latino
Geographical mobility - Moved within same county (%) - American Indian and Alaska Native
Geographical mobility - Moved within same county (%) - Multirace
Geographical mobility - Moved within same county (%) - Other Race
Geographical mobility - Moved from different county within same state (%)
Geographical mobility - Moved from different county within same state (%) - White
Geographical mobility - Moved from different county within same state (%) - Black or African American
Geographical mobility - Moved from different county within same state (%) - Asian
Geographical mobility - Moved from different county within same state (%) - Hispanic or Latino
Geographical mobility - Moved from different county within same state (%) - American Indian and Alaska Native
Geographical mobility - Moved from different county within same state (%) - Multirace
Geographical mobility - Moved from different county within same state (%) - Other Race
Geographical mobility - Moved from different state (%)
Geographical mobility - Moved from different state (%) - White
Geographical mobility - Moved from different state (%) - Black or African American
Geographical mobility - Moved from different state (%) - Asian
Geographical mobility - Moved from different state (%) - Hispanic or Latino
Geographical mobility - Moved from different state (%) - American Indian and Alaska Native
Geographical mobility - Moved from different state (%) - Multirace
Geographical mobility - Moved from different state (%) - Other Race
Geographical mobility - Moved from abroad (%)
Geographical mobility - Moved from abroad (%) - White
Geographical mobility - Moved from abroad (%) - Black or African American
Geographical mobility - Moved from abroad (%) - Asian
Geographical mobility - Moved from abroad (%) - Hispanic or Latino
Geographical mobility - Moved from abroad (%) - American Indian and Alaska Native
Geographical mobility - Moved from abroad (%) - Multirace
Geographical mobility - Moved from abroad (%) - Other Race
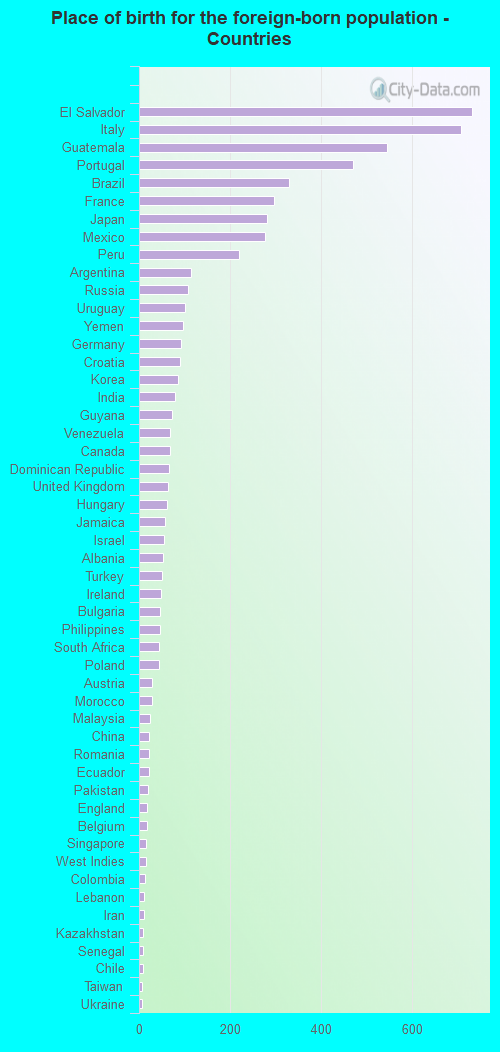
Place of birth for the foreign-born population - Ireland (%)
Place of birth for the foreign-born population - Denmark (%)
Place of birth for the foreign-born population - Norway (%)
Place of birth for the foreign-born population - Sweden (%)
Place of birth for the foreign-born population - United Kingdom (%)
Place of birth for the foreign-born population - England (%)
Place of birth for the foreign-born population - Scotland (%)
Place of birth for the foreign-born population - Other Northern Europe (%)
Place of birth for the foreign-born population - Austria (%)
Place of birth for the foreign-born population - Belgium (%)
Place of birth for the foreign-born population - France (%)
Place of birth for the foreign-born population - Germany (%)
Place of birth for the foreign-born population - Netherlands (%)
Place of birth for the foreign-born population - Switzerland (%)
Place of birth for the foreign-born population - Other Western Europe (%)
Place of birth for the foreign-born population - Greece (%)
Place of birth for the foreign-born population - Italy (%)
Place of birth for the foreign-born population - Portugal (%)
Place of birth for the foreign-born population - Spain (%)
Place of birth for the foreign-born population - Other Southern Europe (%)
Place of birth for the foreign-born population - Albania (%)
Place of birth for the foreign-born population - Belarus (%)
Place of birth for the foreign-born population - Bosnia and Herzegovina (%)
Place of birth for the foreign-born population - Bulgaria (%)
Place of birth for the foreign-born population - Croatia (%)
Place of birth for the foreign-born population - Czechoslovakia (%)
Place of birth for the foreign-born population - Hungary (%)
Place of birth for the foreign-born population - Latvia (%)
Place of birth for the foreign-born population - Lithuania (%)
Place of birth for the foreign-born population - North Macedonia (Macedonia) (%)
Place of birth for the foreign-born population - Moldova (%)
Place of birth for the foreign-born population - Poland (%)
Place of birth for the foreign-born population - Romania (%)
Place of birth for the foreign-born population - Russia (%)
Place of birth for the foreign-born population - Serbia (%)
Place of birth for the foreign-born population - Ukraine (%)
Place of birth for the foreign-born population - Other Eastern Europe (%)
Place of birth for the foreign-born population - China (%)
Place of birth for the foreign-born population - Hong Kong (%)
Place of birth for the foreign-born population - Taiwan (%)
Place of birth for the foreign-born population - Japan (%)
Place of birth for the foreign-born population - Korea (%)
Place of birth for the foreign-born population - Other Eastern Asia (%)
Place of birth for the foreign-born population - Afghanistan (%)
Place of birth for the foreign-born population - Bangladesh (%)
Place of birth for the foreign-born population - India (%)
Place of birth for the foreign-born population - Iran (%)
Place of birth for the foreign-born population - Kazakhstan (%)
Place of birth for the foreign-born population - Nepal (%)
Place of birth for the foreign-born population - Pakistan (%)
Place of birth for the foreign-born population - Sri Lanka (%)
Place of birth for the foreign-born population - Uzbekistan (%)
Place of birth for the foreign-born population - Other South Central Asia (%)
Place of birth for the foreign-born population - Burma (%)
Place of birth for the foreign-born population - Cambodia (%)
Place of birth for the foreign-born population - Indonesia (%)
Place of birth for the foreign-born population - Laos (%)
Place of birth for the foreign-born population - Malaysia (%)
Place of birth for the foreign-born population - Philippines (%)
Place of birth for the foreign-born population - Singapore (%)
Place of birth for the foreign-born population - Thailand (%)
Place of birth for the foreign-born population - Vietnam (%)
Place of birth for the foreign-born population - Other South Eastern Asia (%)
Place of birth for the foreign-born population - Armenia (%)
Place of birth for the foreign-born population - Iraq (%)
Place of birth for the foreign-born population - Israel (%)
Place of birth for the foreign-born population - Jordan (%)
Place of birth for the foreign-born population - Kuwait (%)
Place of birth for the foreign-born population - Lebanon (%)
Place of birth for the foreign-born population - Saudi Arabia (%)
Place of birth for the foreign-born population - Syria (%)
Place of birth for the foreign-born population - Turkey (%)
Place of birth for the foreign-born population - Yemen (%)
Place of birth for the foreign-born population - Other Western Asia (%)
Place of birth for the foreign-born population - Eritrea (%)
Place of birth for the foreign-born population - Ethiopia (%)
Place of birth for the foreign-born population - Kenya (%)
Place of birth for the foreign-born population - Somalia (%)
Place of birth for the foreign-born population - Uganda (%)
Place of birth for the foreign-born population - Zimbabwe (%)
Place of birth for the foreign-born population - Other Eastern Africa (%)
Place of birth for the foreign-born population - Cameroon (%)
Place of birth for the foreign-born population - Congo (%)
Place of birth for the foreign-born population - Democratic Republic of Congo (Zaire) (%)
Place of birth for the foreign-born population - Other Middle Africa (%)
Place of birth for the foreign-born population - Egypt (%)
Place of birth for the foreign-born population - Morocco (%)
Place of birth for the foreign-born population - Sudan (%)
Place of birth for the foreign-born population - Other Northern Africa (%)
Place of birth for the foreign-born population - South Africa (%)
Place of birth for the foreign-born population - Other Southern Africa (%)
Place of birth for the foreign-born population - Cabo Verde (%)
Place of birth for the foreign-born population - Ghana (%)
Place of birth for the foreign-born population - Liberia (%)
Place of birth for the foreign-born population - Nigeria (%)
Place of birth for the foreign-born population - Senegal (%)
Place of birth for the foreign-born population - Sierra Leone (%)
Place of birth for the foreign-born population - Other Western Africa (%)
Place of birth for the foreign-born population - Australia (%)
Place of birth for the foreign-born population - New Zealand (%)
Place of birth for the foreign-born population - Fiji (%)
Place of birth for the foreign-born population - Micronesia (%)
Place of birth for the foreign-born population - Bahamas (%)
Place of birth for the foreign-born population - Barbados (%)
Place of birth for the foreign-born population - Cuba (%)
Place of birth for the foreign-born population - Dominica (%)
Place of birth for the foreign-born population - Dominican Republic (%)
Place of birth for the foreign-born population - Grenada (%)
Place of birth for the foreign-born population - Haiti (%)
Place of birth for the foreign-born population - Jamaica (%)
Place of birth for the foreign-born population - St. Vincent and the Grenadines (%)
Place of birth for the foreign-born population - Trinidad and Tobago (%)
Place of birth for the foreign-born population - West Indies (%)
Place of birth for the foreign-born population - Other Caribbean (%)
Place of birth for the foreign-born population - Belize (%)
Place of birth for the foreign-born population - Costa Rica (%)
Place of birth for the foreign-born population - El Salvador (%)
Place of birth for the foreign-born population - Guatemala (%)
Place of birth for the foreign-born population - Honduras (%)
Place of birth for the foreign-born population - Mexico (%)
Place of birth for the foreign-born population - Nicaragua (%)
Place of birth for the foreign-born population - Panama (%)
Place of birth for the foreign-born population - Other Central America (%)
Place of birth for the foreign-born population - Argentina (%)
Place of birth for the foreign-born population - Bolivia (%)
Place of birth for the foreign-born population - Brazil (%)
Place of birth for the foreign-born population - Chile (%)
Place of birth for the foreign-born population - Colombia (%)
Place of birth for the foreign-born population - Ecuador (%)
Place of birth for the foreign-born population - Guyana (%)
Place of birth for the foreign-born population - Peru (%)
Place of birth for the foreign-born population - Uruguay (%)
Place of birth for the foreign-born population - Venezuela (%)
Place of birth for the foreign-born population - Other South America (%)
Place of birth for the foreign-born population - Canada (%)
Place of birth for the foreign-born population - Other Northern America (%)
Place of birth for the foreign-born population - Other (%)
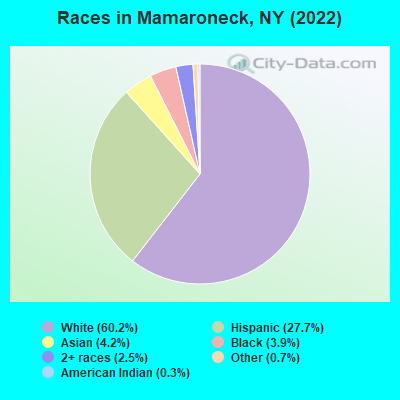
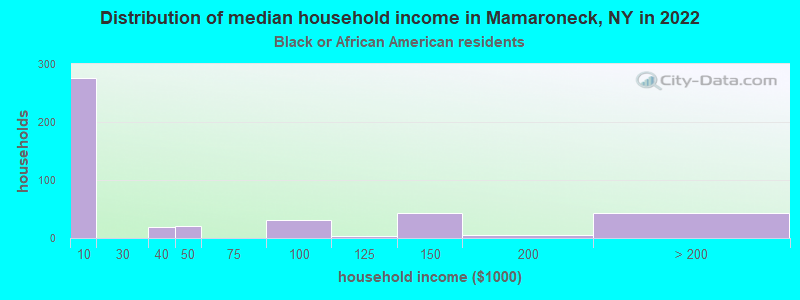
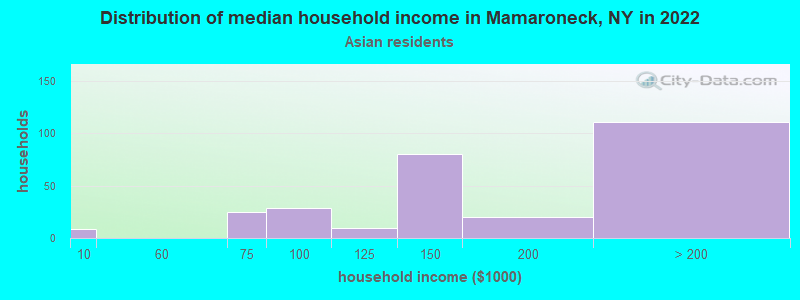
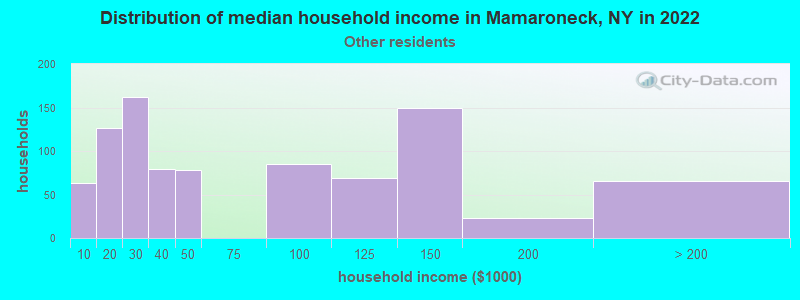
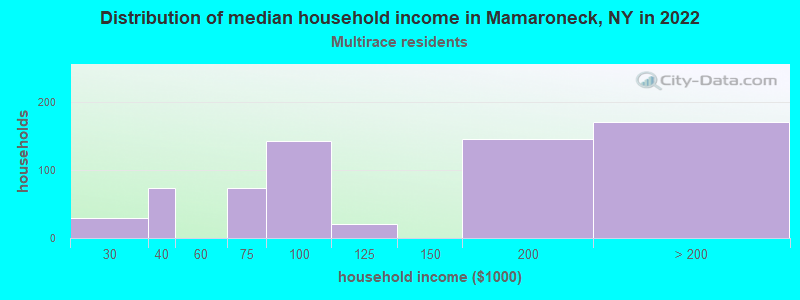
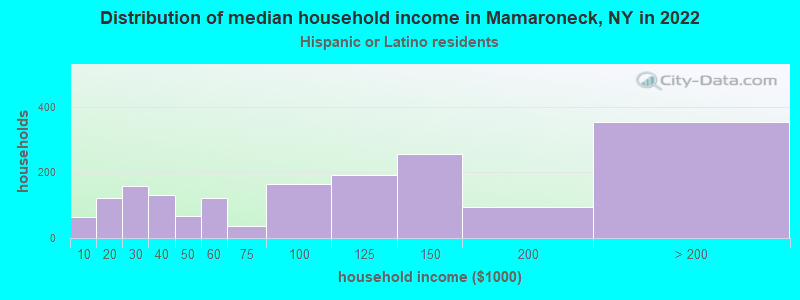
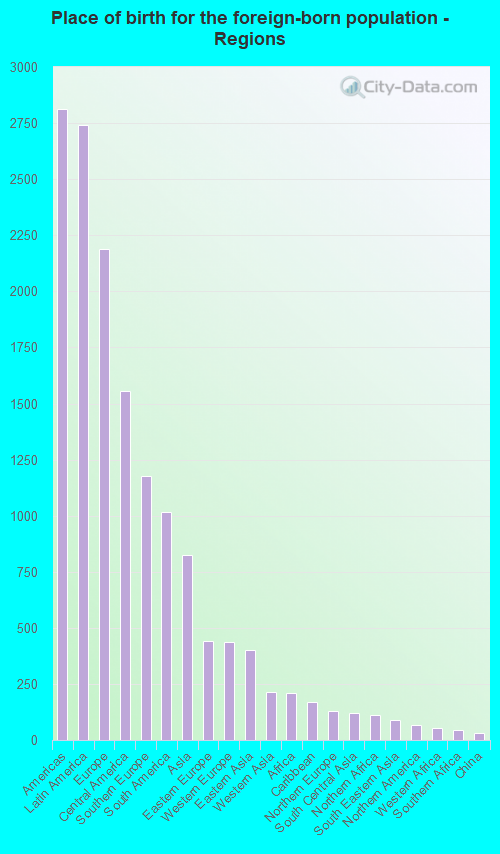
According to 2022 data, the most numerous races in Mamaroneck, NY are White alone (11,915 residents), Hispanic (5,472 residents), and Black alone (778 residents). 56.2% of Mamaroneck residents speak English at home. 30.5% of Mamaroneck, NY residents are foreign-born (13.9% born in Latin America, 11.1% born in Europe, 4.2% born in Asia), which is 27.9% greater than the foreign-born rate of 22.0% across the entire state of New York.
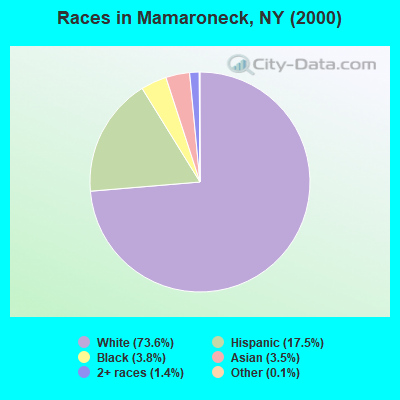
Race distribution in Mamaroneck
2000 2022
11,760,981 62.0% White alone 2,867,583 15.1% Hispanic 2,812,623 14.8% Black alone 1,035,926 5.5% Asian alone 366,116 1.9% Two or more races 75,499 0.4% Other race alone 52,499 0.3% American Indian alone 5,230 0.03% Native Hawaiian and Other
10,408,933 52.9% White alone 3,867,299 19.7% Hispanic 2,633,840 13.4% Black alone 1,776,286 9.0% Asian alone 732,670 3.7% Two or more races 216,110 1.1% Other race alone 35,082 0.2% American Indian alone 6,931 0.04% Native Hawaiian and Other
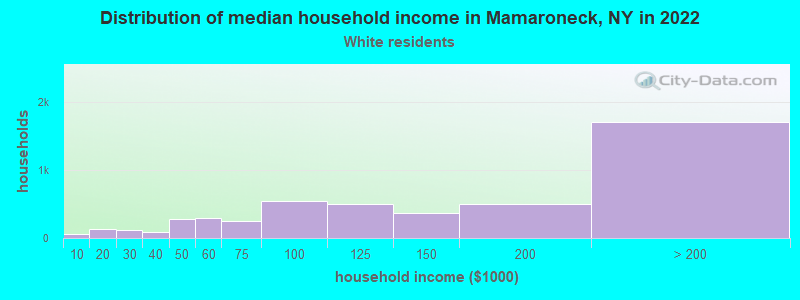
Income and house value in Mamaroneck Median household income in 2022 $131,459 White non-Hispanic householders$2,183 Black householders$139,276 Asian householders$131,862 Two or more races householders$90,784 Hispanic or Latino race householdersMedian 2022 house value $856,221 White Non-Hispanic householders$751,860 Black or African American householders$601,581 American Indian or Alaska Native householders $917,214 Asian householders$637,759 Some other race householders$600,885 Two or more races householders$632,425 Hispanic or Latino householders
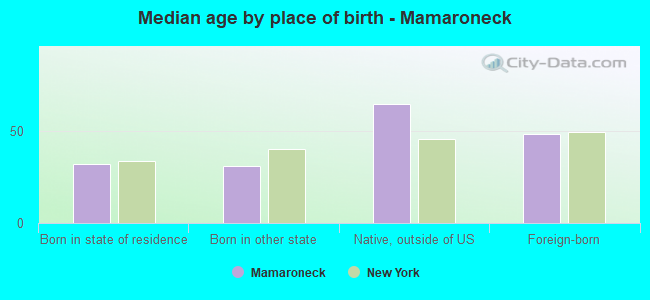
Median age by race in Mamaroneck
45.9 Median age for White residents42.0 48.6 29.9 Median age for Black or African American residents30.4 41.4 16.9 Median age for American Indian / Alaska Native residents17.2 -554,999,999.4 37.0 Median age for Asian residents37.4 37.1 -487,992,314.6 Median age for Native Hawaiian / Pacific Islander residents-477,502,295.2 -666,666,666.0 33.0 Median age for Other race residents37.7 20.8 41.4 Median age for Two or more races residents41.4 40.5 45.7 Median age for White alone residents41.9 48.8 37.8 Median age for Hispanic or Latino residents38.3 36.7
Owner/renter occupied households by race in Mamaroneck
House owners and renters - White residents 3,622 74.7% Owner occupied1,226 25.3% Renter occupiedHouse owners and renters - Black or African American residents 94 25.0% Owner occupied282 75.0% Renter occupiedHouse owners and renters - American Indian / Alaska Native residents 19 100.0% Renter occupiedHouse owners and renters - Asian residents 203 74.3% Owner occupied70 25.7% Renter occupiedHouse owners and renters - Other race residents 109 13.1% Owner occupied720 86.9% Renter occupiedHouse owners and renters - Two or more races residents 310 43.7% Owner occupied399 56.3% Renter occupiedHouse owners and renters - White alone residents 3,441 76.4% Owner occupied1,064 23.6% Renter occupiedHouse owners and renters - Hispanic or Latino residents 529 29.2% Owner occupied1,285 70.8% Renter occupied
Language usage in Mamaroneck
English speakers - Total 56.2% of residents of Mamaroneck speak English at home.
25.0% of residents speak Spanish at home 2,651 56.6% Speak English very well2,029 43.4% Speak English less than very well18.6% of residents speak other language at home 2,299 66.1% Speak English very well1,180 33.9% Speak English less than very well
English speakers - Born in the United States 82.3% of residents of Mamaroneck speak English at home.
11.7% of residents speak Spanish at home 285 83.3% Speak English very well57 16.7% Speak English less than very well3.8% of residents speak other language at home 112 100.0% Speak English very well
English speakers - Native, born elsewhere 17.6% of residents of Mamaroneck speak English at home.
71.3% of residents speak Spanish at home 102 34.5% Speak English very well194 65.5% Speak English less than very well17.3% of residents speak other language at home 72 100.0% Speak English very well
English speakers - Foreign-born 19.2% of residents of Mamaroneck speak English at home.
34.8% of residents speak Spanish at home 649 30.7% Speak English very well1,463 69.3% Speak English less than very well44.7% of residents speak other language at home 1,645 60.6% Speak English very well1,070 39.4% Speak English less than very well
White (Caucasian) - Speak only English Native:
85.9% (7,897)Foreign-born:
27.9% (745)
White (Caucasian) - Speak another language Native:
12.7% (1,171)Foreign-born:
69.0% (1,845)
Black or African American - Speak only English Native:
96.9% (602)Foreign-born:
76.0% (101)
Black or African American - Speak another language Native:
4.1% (26)Foreign-born:
25.1% (34)
American Indian / Alaska Native - Speak another language Native:
100.0% (176)Foreign-born:
100.0% (21)
Asian - Speak only English Native:
39.9% (51)Foreign-born:
8.4% (49)
Asian - Speak another language Native:
60.3% (77)Foreign-born:
90.9% (525)
Other race - Speak only English Native:
9.5% (142)Foreign-born:
12.3% (171)
Other race - Speak another language Native:
93.8% (1,401)Foreign-born:
88.7% (1,236)
Two or more races - Speak only English Native:
57.6% (682)Foreign-born:
10.3% (68)
Two or more races - Speak another language Native:
42.3% (501)Foreign-born:
89.9% (591)
White alone - Speak only English Native:
88.2% (7,583)Foreign-born:
23.2% (612)
White alone - Speak another language Native:
11.3% (976)Foreign-born:
73.9% (1,951)
Hispanic or Latino - Speak only English Native:
25.6% (748)Foreign-born:
14.3% (336)
Hispanic or Latino - Speak another language Native:
75.7% (2,208)Foreign-born:
87.2% (2,045)
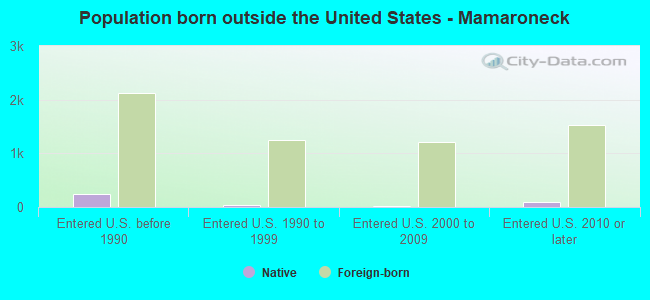
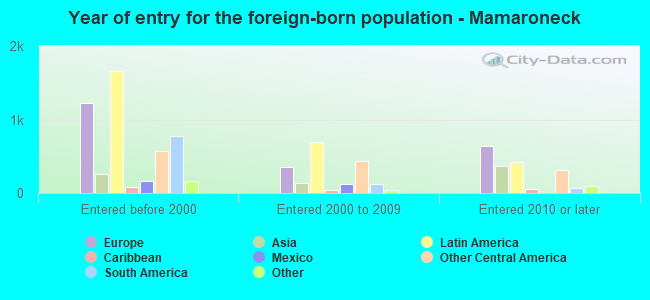
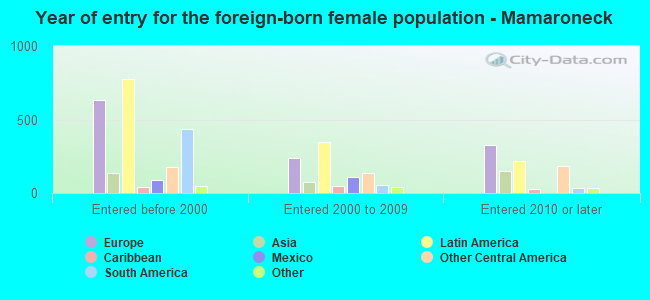
Foreign-born residents in Mamaroneck 6,036 residents are foreign born (13.9% Latin America , 11.1% Europe , 4.2% Asia ).
This city:
30.5%New York:
22.6%
Marital status for residents in Mamaroneck Marital status - White (Caucasian) population 15 years and over
Males 33.1% Never married55.6% Now married3.2% Separated4.0% Widowed4.0% DivorcedFemales 23.1% Never married52.3% Now married4.7% Separated9.8% Widowed10.2% DivorcedWomen who gave birth in the past 12 months Now married:
100.0% (121)Unmarried:
0.0% (0)
Women who did not give birth in the past 12 months Now married:
51.3% (1,221)Unmarried:
48.7% (1,158)
Marital status - Black or African American population 15 years and over
Males 65.5% Never married26.8% Now married0.0% Separated1.3% Widowed6.4% DivorcedFemales 31.6% Never married32.0% Now married4.9% Separated15.4% Widowed16.2% DivorcedWomen who did not give birth in the past 12 months Now married:
62.0% (73)Unmarried:
38.0% (45)
Marital status - American Indian / Alaska Native population 15 years and over
Males 65.8% Never married34.2% Now married0.0% Separated0.0% Widowed0.0% DivorcedFemales 0.0% Never married100.0% Now married0.0% Separated0.0% Widowed0.0% DivorcedWomen who did not give birth in the past 12 months Now married:
100.0% (29)Unmarried:
0.0% (0)
Marital status - Asian population 15 years and over
Males 7.1% Never married92.9% Now married0.0% Separated0.0% Widowed0.0% DivorcedFemales 15.9% Never married82.5% Now married0.0% Separated0.0% Widowed1.6% DivorcedWomen who gave birth in the past 12 months Now married:
100.0% (29)Unmarried:
0.0% (0)
Women who did not give birth in the past 12 months Now married:
72.5% (129)Unmarried:
27.5% (49)
Marital status - Other race population 15 years and over
Males 41.9% Never married42.8% Now married12.6% Separated0.0% Widowed2.7% DivorcedFemales 32.5% Never married37.6% Now married13.1% Separated5.8% Widowed11.0% DivorcedWomen who did not give birth in the past 12 months Now married:
46.2% (334)Unmarried:
53.8% (390)
Marital status - Two or more races population 15 years and over
Males 32.5% Never married60.6% Now married0.0% Separated0.0% Widowed6.9% DivorcedFemales 23.0% Never married70.0% Now married5.3% Separated0.0% Widowed1.8% DivorcedWomen who did not give birth in the past 12 months Now married:
68.9% (306)Unmarried:
31.1% (138)
Marital status - White alone, not Hispanic / Latino population 15 years and over
Males 34.1% Never married54.7% Now married2.1% Separated4.6% Widowed4.6% DivorcedFemales 21.0% Never married56.2% Now married3.3% Separated10.9% Widowed8.5% DivorcedWomen who gave birth in the past 12 months Now married:
100.0% (112)Unmarried:
0.0% (0)
Women who did not give birth in the past 12 months Now married:
57.0% (1,172)Unmarried:
43.0% (886)
Marital status - Hispanic or Latino population 15 years and over
Males 35.7% Never married51.8% Now married9.2% Separated0.0% Widowed3.2% DivorcedFemales 29.9% Never married41.2% Now married11.9% Separated3.5% Widowed13.5% DivorcedWomen who gave birth in the past 12 months Now married:
100.0% (18)Unmarried:
0.0% (0)
Women who did not give birth in the past 12 months Now married:
45.8% (642)Unmarried:
54.2% (759)
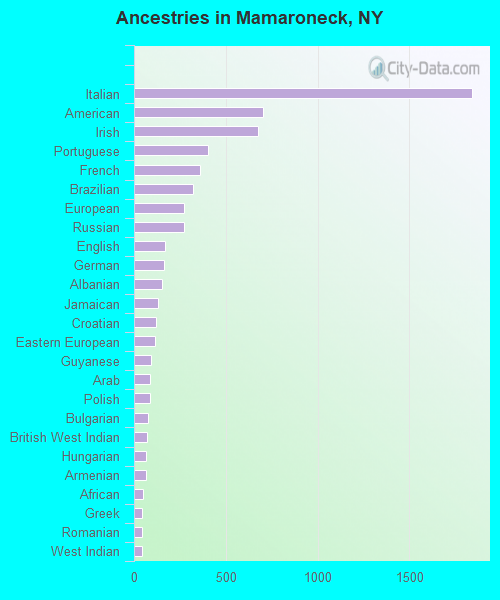
Ancestries in Mamaroneck
1,842 16.4% Italian703 6.3% American674 6.0% Irish404 3.6% Portuguese358 3.2% French323 2.9% Brazilian271 2.4% European270 2.4% Russian170 1.5% English161 1.4% German154 1.4% Albanian130 1.2% Jamaican120 1.1% Croatian116 1.0% Eastern European90 0.8% Guyanese87 0.8% Arab87 0.8% Polish78 0.7% Bulgarian70 0.6% British West Indian66 0.6% Hungarian65 0.6% Armenian48 0.4% African46 0.4% Greek43 0.4% Romanian42 0.4% West Indian31 0.3% Dutch24 0.2% French Canadian24 0.2% Welsh22 0.2% Ukrainian19 0.2% Scandinavian18 0.2% Moroccan18 0.2% Austrian18 0.2% Canadian17 0.2% Swedish13 0.1% Scottish12 0.1% Iraqi10 0.09% Lebanese6 0.05% Haitian5 0.04% Latvian5 0.04% Czech3 0.03% Lithuanian3 0.03% Nigerian
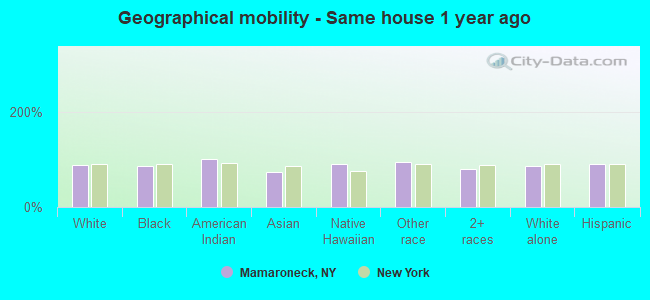
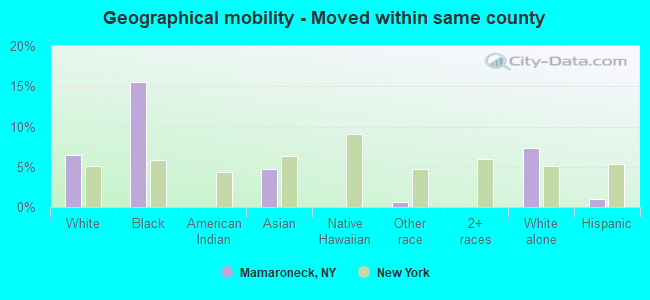
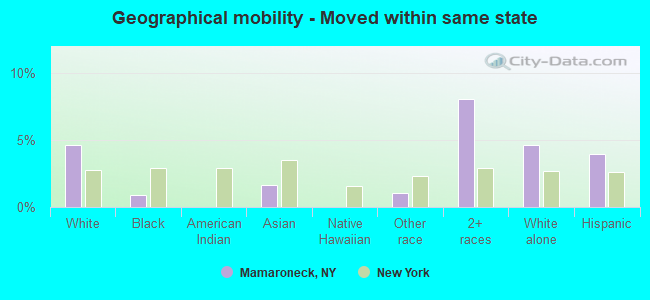
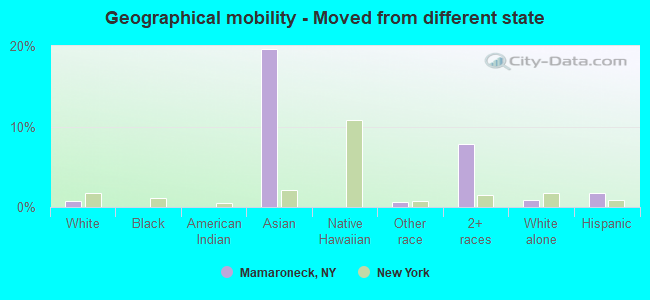
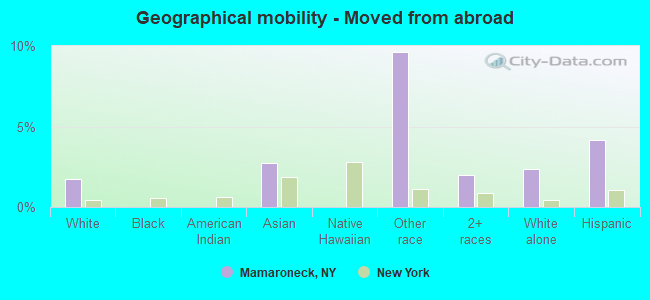
Geographical mobility in Mamaroneck Same house 1 year ago 10,931 86.8% White (Caucasian)696 84.7% Black or African American155 100.0% American Indian / Alaska Native573 73.9% Asian22 89.7% Native Hawaiian / Pacific Islander2,711 93.6% Other race1,682 80.3% Two or more races10,128 85.5% White alone, not Hispanic / Latino4,885 90.4% Hispanic or LatinoMoved within same county 809 6.4% White / Caucasian128 15.5% Black or African American37 4.8% Asian17 0.6% Other race867 7.3% White alone, not Hispanic / Latino53 1.0% Hispanic or LatinoMoved within same state 579 4.6% White / Caucasian7 0.9% Black or African American13 1.6% Asian30 1.0% Other race169 8.1% Two or more races550 4.6% White alone, not Hispanic / Latino213 3.9% Hispanic or LatinoMoved from different state 92 0.7% White / Caucasian153 19.7% Asian20 0.7% Other race163 7.8% Two or more races101 0.9% White alone, not Hispanic / Latino95 1.8% Hispanic or LatinoMoved from abroad 215 1.7% White21 2.7% Asian279 9.6% Other race41 2.0% Two or more races277 2.3% White alone, not Hispanic / Latino226 4.2% Hispanic or Latino
Children Nativity (place of birth) in Mamaroneck
Children under 6 years - Living with two parents Both parents native 411 99.8% Native1 0.2% Foreign-bornBoth parents foreign-born 251 89.3% Native30 10.7% Foreign-bornOne native, one foreign-born parent 273 100.0% NativeChildren under 6 years - Living with one parent Native parent 144 100.0% NativeForeign-born parent 6 100.0% NativeChildren 6 to 17 years - Living with two parents Both parents native 918 100.0% NativeBoth parents foreign-born 884 84.7% Native160 15.3% Foreign-bornOne native, one foreign-born parent 610 98.9% Native7 1.1% Foreign-bornChildren 6 to 17 years - Living with one parent Native parent 272 100.0% NativeForeign-born parent 349 51.8% Native324 48.2% Foreign-born