Races in Mansfield, New York (NY) Detailed Stats
Ancestries, Foreign-born residents, place of birth
2.1% of Mansfield, NY residents are foreign-born (1.6% born in North America, 0.5% born in Europe), which is 935.3% less than the foreign-born rate of 22.0% across the entire state of New York.
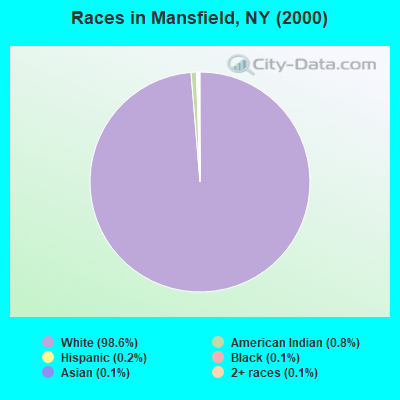
Race distribution in Mansfield

- 78998.6%White alone
- 60.8%American Indian alone
- 20.2%Hispanic
- 10.1%Black alone
- 10.1%Asian alone
- 10.1%Two or more races
2000
2022
-
- 11,760,98162.0%White alone
- 2,867,58315.1%Hispanic
- 2,812,62314.8%Black alone
- 1,035,9265.5%Asian alone
- 366,1161.9%Two or more races
- 75,4990.4%Other race alone
- 52,4990.3%American Indian alone
- 5,2300.03%Native Hawaiian and Other
Pacific Islander alone

-
- 10,408,93352.9%White alone
- 3,867,29919.7%Hispanic
- 2,633,84013.4%Black alone
- 1,776,2869.0%Asian alone
- 732,6703.7%Two or more races
- 216,1101.1%Other race alone
- 35,0820.2%American Indian alone
- 6,9310.04%Native Hawaiian and Other
Pacific Islander alone

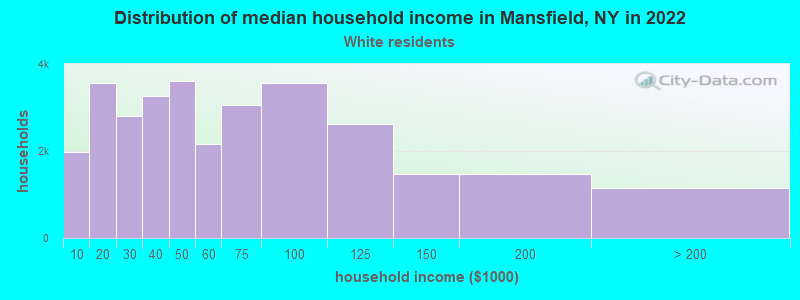
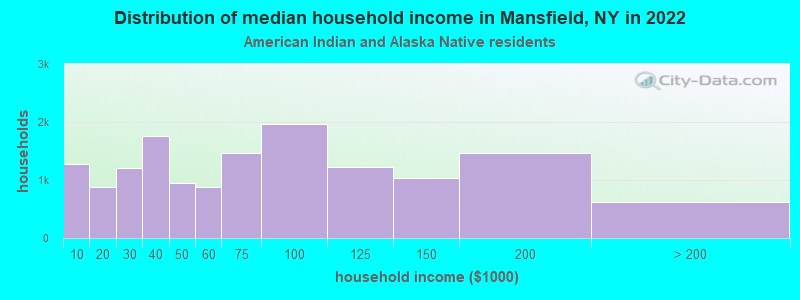
Income and house value in Mansfield
- Median household income in 2022
- $55,195White non-Hispanic householders
- $34,866American Indian and Alaska Native householders
- Median 2022 house value
- $141,969White Non-Hispanic householders
Household income for White non-Hispanic householders
Household income for American Indian and Alaska Native householders
Foreign-born residents in Mansfield
17 residents are foreign born (1.6% North America, 0.5% Europe).
| This city: | 2.1% |
| New York: | 20.4% |
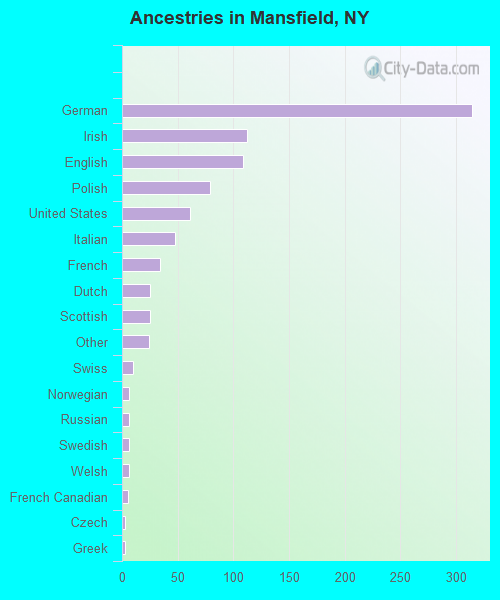
Ancestries in Mansfield

- 31435.7%German
- 11212.7%Irish
- 10912.4%English
- 799.0%Polish
- 616.9%United States
- 485.5%Italian
- 343.9%French
- 252.8%Dutch
- 252.8%Scottish
- 242.7%Other
- 101.1%Swiss
- 60.7%Norwegian
- 60.7%Russian
- 60.7%Swedish
- 60.7%Welsh
- 50.6%French Canadian
- 30.3%Czech
- 30.3%Greek
- 20.2%Hungarian
- 20.2%Scotch-Irish
Zip codes: 14755.